REVIEW 3 major objections 5 minor 16 references
Photophoresis in the circumjovian disk and its impact on the orbital configuration of the Galilean satellites
T0 review · 3 major / 5 minor · reviewed 2026-08-14 · deepseek-v4-flash
Pith's one-line read This paper argues that photophoresis in the circumjovian disk creates a surface-density bump near Io's orbit, halting Io's inward migration and enabling the 4:2:1 resonance of the Galilean satellites.
desk verdict A plausible, clearly presented new mechanism for halting Io's migration, but the surface-density bump is assumed via a viscosity jump rather than derived from photophoresis; worth refereeing as a proof of concept. read the letter →
The pith
A machine-rendered reading of the paper's core claim, the machinery that carries it, and where it could break.
The reading
What carries the argument
The load-bearing object is the light barrier, defined as the radius at which the outward photophoretic force on a dust grain equals the inward force of gas drag (the residual gravity from the disk's pressure support). The paper uses analytic expressions for both forces: the free-molecular photophoretic force from standard kinetic theory and the gas-drag term, both scaling as $a^3$, so the barrier location is independent of dust radius for small grains. The barrier does two jobs: it sets where dust is removed, and it fixes the radius where the disk's turbulent viscosity jumps. That viscosity jump is what actually creates the pressure maximum and surface-density bump; the paper shows in an appendix that the bump forms for any outer $\alpha$ as long as the inner $\alpha$ is about ten times larger.
What would settle it
Compute the ionization fraction and turbulent stress in a circumjovian disk with the dust abundance set by photophoresis, including turbulent diffusion of dust across the light barrier; if the resulting inner-disk $\alpha$ does not exceed the outer-disk $\alpha$ by roughly a factor of ten, the surface-density bump disappears and the proposed Io parking mechanism fails. A measurement that young Jupiter's luminosity or the disk accretion rate during satellite formation was outside the ranges considered ($L\sim 10^{-6}{-}10^{-5}\,L_\odot$, $\dot{M}\lesssim 10^{-7}\,M_J\,{\rm yr}^{-1}$) would also move the predicted barrier away from Io's orbit.
Extended reading notes
Core claim
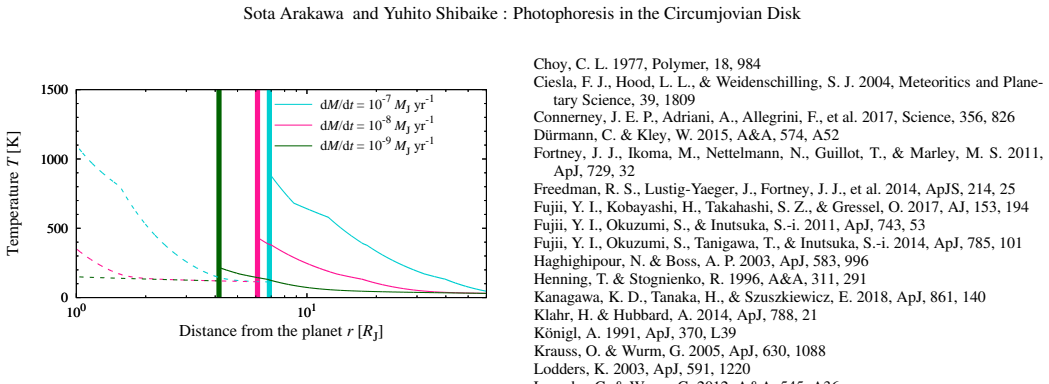
The central discovery is that the photophoretic force in a circumjovian accretion disk can balance the inward gas drag on micron-sized dust at a radius near Io's present orbit, so the region inside that radius becomes depleted of dust. Because dust grains remove free charges, the dust-poor inner disk has a higher ionization fraction and supports stronger magnetorotational-instability-driven accretion stress; the paper models this as a jump from $\alpha = 10^{-3}$ in the outer disk to $\alpha = 10^{-2}$ in the inner disk. In a steady-state viscous disk, a change in $\alpha$ at a fixed radius changes the slope of the surface density profile, producing a local pressure maximum and a bump in $\Sigma$ at the barrier. The paper computes the barrier location for mass accretion rates $\dot{M} = 10^{-7}$, $10^{-8}$, and $10^{-9}\,M_J\,{\rm yr}^{-1}$, finding $r_{\rm lb} = 6.9\,R_J$, $6.1\,R_J$, and $4.2\,R_J$ respectively, and argues that the resulting bump halts Io's migration and lets Europa and Ganymede be captured into 2:1 resonances.
Load-bearing premise
The whole bump rests on the assumption that removing dust raises the MRI-driven viscosity of the inner disk by about an order of magnitude (from $\alpha=10^{-3}$ to $10^{-2}$); if dust depletion does not produce that viscosity contrast, no surface-density bump forms and Io's migration is not halted.
Editorial extensions
If this is right
- Io's orbit becomes a natural parking radius: the light barrier sits at $6.1\,R_J$ for $\dot{M}=10^{-8}\,M_J\,{\rm yr}^{-1}$, close to Io's current $5.9\,R_J$, so no fine-tuned inner cavity is required.
- The scenario avoids the slow-spin requirement of the magnetic inner-cavity model, because the bump location is set by luminosity and accretion rate, not by Jupiter's rotation period and radius.
- Icy satellites survive: for $\dot{M}\lesssim 10^{-8}\,M_J\,{\rm yr}^{-1}$, the disk temperature at Ganymede's orbit falls below the water-ice sublimation temperature, unlike the silicate-sublimation bump model.
- Resonance capture works: the computed type-I migration timescale is orders of magnitude longer than the critical timescale for 2:1 resonance capture from N-body simulations, so Europa and Ganymede can be trapped after Io stalls.
- The mechanism is robust to the absolute value of $\alpha$; only the contrast between inner and outer viscosity matters, as verified for outer $\alpha = 10^{-3}$, $5\times10^{-4}$, and $2.5\times10^{-4}$.
Reading between the lines
- A natural next test is a self-consistent treatment of turbulent diffusion of dust across the light barrier, which could smooth the assumed sharp jump in dust abundance and opacity and possibly weaken the viscosity contrast on which the bump depends.
- The same photophoretic-barrier logic would likely apply to circumplanetary disks around Saturn and giant exoplanets, predicting pressure bumps and potential satellite- or ring-formation sites at radii set by the planet's luminosity and disk accretion rate.
- Because the barrier radius is independent of dust size for small grains but photophoresis weakens for larger pebbles, the mechanism predicts a dust-size sorting across the disk: fine dust is held back while cm-sized pebbles drift inward unless their aggregates have very low thermal conductivity, a signature that dust evolution calculations could test.
Signed reviews
Editorial analysis
A structured set of objections, weighed in public.
Referee Report
Summary. The paper argues that photophoresis in the circumjovian disk, driven by irradiation from young Jupiter, creates a "light barrier" where the photophoretic force balances gas drag, preventing µm-sized dust from drifting into the inner disk. The resulting dust-poor inner region is assumed to have higher ionization and therefore larger MRI-driven viscosity (α = 10^-2 versus 10^-3), producing a local maximum in surface density that can halt the inward migration of Io and enable 4:2:1 resonance capture of Europa and Ganymede. The authors compute the light barrier location for a steady-state α-disk model and show it is near Io's orbit for Mdot = 10^-8 to 10^-7 MJ/yr.
Significance. The proposed mechanism is novel, combining photophoresis with MRI-driven viscosity to explain the surface density bump invoked in satellite formation models. The force-balance calculation is straightforward and carefully checked against free-molecular, opacity, rotation, and particle-size assumptions in the appendices. The paper is honest in stating the limitations of the opacity and viscosity treatments. The key weakness is that the bump itself is not a self-consistent outcome of photophoresis: it arises from an assumed order-of-magnitude jump in α. If that jump is justified by future microphysical modeling, the scenario would be a valuable complement to the sublimation and magnetic-cavity mechanisms; in its present form, the paper is better read as a proof-of-concept scenario than as a demonstrated causal chain.
major comments (3)
- [Section 2.2 and Appendix G] The surface-density bump is generated by the assumed factor-of-10 jump in α at the light barrier, not by a self-consistently computed feedback between photophoretic dust depletion and MRI turbulence. In Section 2.2, α = 10^-3 (outer region) and α = 10^-2 (inner region) are imposed by hand, and Appendix G states explicitly that "the increase in α at the light barrier is the key to generating the bump." No calculation connects the assumed dust depletion fd = 10^-6 to the ionization fraction or to the actual MRI stress. Therefore the abstract's claim that photophoresis "could be the cause of the bump" is not directly supported: photophoresis is shown to create a dust-poor region, but the bump is manufactured by the assumed viscosity contrast. The authors should either derive the α jump from a microphysical ionization model or revise the claim to state that the bump forms if dust depletion raises α by an order of magnitude.
- [Section 2.2] The sharp boundary in dust abundance, fd = 0.1 outside and fd = 10^-6 inside, is assumed "for simplicity" with no treatment of turbulent diffusion. This sharp boundary is exactly the feature that produces the bump. If turbulent diffusion smooths the dust gradient, the ionization fraction and hence α would vary smoothly over a finite radial width, potentially eliminating the pressure maximum and the migration trap. The paper acknowledges that diffusion may be important but does not quantify the diffusion timescale or assess the robustness of the bump to finite mixing. Since the bump is the central result, a quantitative estimate of the mixing effect (or a model with a finite transition width) is needed.
- [Section 3.1] For the case Mdot = 10^-9 MJ/yr, the condition min{(FPh/FD)_n, (FPh/FD)_p} = 1 is satisfied at both r = 4.2 RJ and r = 10.9 RJ, and the paper speculates that the true light barrier lies between these radii. Because a central conclusion is that the bump is located near the current orbit of Io (5.9 RJ), the ambiguity in the barrier location should be resolved or explicitly discussed. In particular, the manuscript should clarify which of the two crossings acts as the barrier to inward-drifting dust from the outer disk, and why the inner crossing is physically relevant for the surface-density structure.
minor comments (5)
- [Section 2.1] The density of dust particles is given as ρp = 2 g cm^-2; the units should be g cm^-3.
- [Figure 2 / Section 3.1] For the Mdot = 10^-9 case, the double crossing of FPh/FD = 1 is not visible in the printed figure at the resolution provided; a zoom or explicit mark of the two crossing radii would help the reader follow the discussion.
- [Appendix F] The analytical fit for the Planck mean gas opacity, Eq. (F.1), should specify the pressure range and temperature range over which it is valid, since Figure F.1 shows pressure dependence but the text states the dependence is small.
- [Section 3.2 / Figure 4] The magnitude of the surface-density bump (fractional increase in Σ at the light barrier) is not stated; reporting this number would help evaluate whether the bump is strong enough to halt migration of an Io-mass satellite.
- [Appendix I] Equation (I.2) evaluates the migration timescale at r = 9 RJ, whereas the innermost satellite is located at r = 5.9 RJ; the choice of radius should be justified, or the evaluation should be repeated at the relevant orbital radius.
Circularity Check
The surface-density bump is produced by an assumed factor-of-10 viscosity jump, not by a calculated consequence of photophoretic dust depletion; the central prediction is partly built into the input.
-
fitted input called prediction
[Section 2.2, Eq. (3), and Appendix G; bump result used in Section 3.2]
"Thus, we assumed α = 10−3 for the outer region and α = 10−2 for the inner region. We note that the choice of absolute values of α does not change the results drastically; the increase in α at the light barrier is the key to generating the bump in the surface density distribution (see Appendix G)."
The bump is not a self-consistently calculated effect of photophoresis. In the steady-state solution Eq. (3) with ν = α c_s²/Ω_K, the surface density scales as Σ ∝ 1/ν at fixed radius, so imposing α_inner = 10 α_outer at r_lb directly produces a factor-of-10 jump in Σ and a pressure maximum at that radius. The paper asserts, but does not calculate, that dust depletion raises the ionization fraction and MRI stress by this amount; the cited 'could be larger' is not quantified. Appendix G confirms that the bump exists only because the inner turbulence is assumed stronger. Hence the abstract's claim that photophoresis 'could be the cause of the bump' reduces to the hand-imposed viscosity contrast; the photophoretic force only supplies the location of the discontinuity.
full rationale
The light-barrier location itself is derived from an independent force balance (FPh = FD) and is not circular: Appendix G shows that rlb depends only weakly on α, and the photophoresis formulas are taken from external laboratory/kinetic theory work. However, the central new result claimed in the abstract—the surface-density bump that halts Io's migration—is not a computed consequence of the photophoretic dust profile. The steady-state solution Eq. (3) directly converts the assumed α discontinuity (10^-3 outer, 10^-2 inner) into a Σ jump/bump at r_lb. The paper does not model the ionization fraction, electron density, or MRI stress as functions of dust abundance; it simply assumes the factor-of-10 viscosity contrast. Appendix G explicitly states that this α increase is 'the key to generating the bump.' Therefore, the existence and magnitude of the predicted bump reduce by construction to an input assumption, giving partial circularity. This is not a case of load-bearing self-citation or an imported uniqueness theorem; the same flaw would remain if all references were external. Score 6 reflects that one predicted feature is built into the input while the barrier-location part retains independent content.
Assumptions & free parameters
free parameters (4)
- fd_outer =
0.1
- fd_inner =
1e-6
- alpha_outer =
1e-3
- alpha_inner =
1e-2
assumptions (5)
- domain assumption The circumjovian disk is a steady-state viscous accretion disk with constant mass accretion rate and gas supply at rb = 27 RJ.
- ad hoc to paper Dust abundance changes discontinuously from fd = 0.1 to fd = 1e-6 at the light barrier, with no turbulent diffusion of dust.
- ad hoc to paper The effective viscosity is α = 1e-2 in the dust-poor inner region and α = 1e-3 in the outer region.
- domain assumption The abundance of nm and sub-µm dust is negligibly small, so dust opacity and ionization are governed by µm-sized grains.
- domain assumption The radiative intensity from the planet is I = L/(4πr^2) at the light barrier, and the photophoretic force formula, Eq. (1), applies.
Cite this review
Pith. "Pith review of Photophoresis in the circumjovian disk and its impact on the orbital configuration of the Galilean satellites." pith.science (2026). https://pith.science/paper/NGRHWW75
@misc{pith2026190803128,
  author       = {Pith},
  title        = {Pith review of: Photophoresis in the circumjovian disk and its impact on the orbital configuration of the Galilean satellites},
  year         = {2026},
  howpublished = {\url{https://pith.science/paper/NGRHWW75}},
  note         = {Machine review of arXiv:1908.03128}
}
read the original abstract
Jupiter has four large regular satellites called the Galilean satellites: Io, Europa, Ganymede, and Callisto. The inner three of the Galilean satellites orbit in a 4:2:1 mean motion resonance; therefore their orbital configuration may originate from the stopping of the migration of Io near the bump in the surface density distribution and following resonant trapping of Europa and Ganymede. The formation mechanism of the bump near the orbit of the innermost satellite, Io, is not yet understood, however. Here, we show that photophoresis in the circumjovian disk could be the cause of the bump, using analytic calculations of steady-state accretion disks. We propose that photophoresis in the circumjovian disk could stop the inward migration of dust particles near the orbit of Io. The resulting dust depleted inner region would have a higher ionization fraction, and thus admit increased magnetorotational-instability-driven accretion stress than the outer region. The increase of the accretion stress at the photophoretic dust barrier would form a bump in the surface density distribution, halting the migration of Io.
Figures


Figures from the paper (1 more)
Reference graph
Works this paper leans on
-
[1]
1976, Progress of The oretical Physics, 56, 1756 Arakawa, S., Tanaka, H., Kataoka, A., & Nakamoto, T
Adachi, I., Hayashi, C., & Nakazawa, K. 1976, Progress of The oretical Physics, 56, 1756 Arakawa, S., Tanaka, H., Kataoka, A., & Nakamoto, T. 2017, A& A, 608, L7 Arakawa, S., Tatsuuma, M., Sakatani, N., & Nakamoto, T. 2019 , Icarus, 324, 8 Balbus, S. A. & Hawley, J. F. 1991, ApJ, 376, 214 Batygin, K. 2018, AJ, 155, 178 Bell, K. R. & Lin, D. N. C. 1994, Ap...
work page 1976
-
[2]
2013), Msat is the mass of the satellite, and Rsat is the radius of the satellite
7 × 10¹⁰ erg g−1 is the latent heat of sublimation of H2O ice (Tanaka et al. 2013), Msat is the mass of the satellite, and Rsat is the radius of the satellite. Therefore, the evaporation timescale is shorter than the dissipation timescale of the c ircum- planetary disk (a few Myr). Moreover, the evaporation times cale is proportional to the radius Rsat an...
work page 2013
-
[3]
Here, we compare the photophoretic force FPh and the radiation force Frad
00 × 1010 cm s −1 is the speed of light. Here, we compare the photophoretic force FPh and the radiation force Frad. The force ratio of the radiation force to the photophoretic f orce is Frad FPh ≃ 6kthT cap ≃ 6 × 10⁻² ( T 300 K ) ( a 3 µm ) −1( p 102 dyn cm−2 ) −1 . (C.2) Then, we found that the radiation force is negligibly weaker than the photophoretic ...
work page 2012
-
[4]
2RJ ( B 150 G ) 4/ 7( ˙M 10−8MJ yr−1 ) −2/ 7 , (B.1) where µ∼ BR3 is the dipole moment of the planet, B is the surface magnetic field of the planet, and R = RJ is the plan- etary radius. Although the current magnetic field of Jupiter is 7.8 G, according to the observations from the Juno spacecraf t (Bolton et al. 2017; Connerney et al. 2017), young Jupiter ...
work page 2017
-
[5]
9 RJ), the orbital configuration of the Galilean satellites can be r epro- duced (Ogihara & Ida 2012, Shibaike et al. submitted). If the planetary magnetic field can be coupled e ffectively to the inner region of a circumplanetary accretion disk, then the disk co uld be disrupted at the radius rin (e.g., Königl 1991): rin = ( µ4 2GM ˙M2 ) 1/ 7 ≃
work page 2012
-
[6]
However, there is another requirement to make an inner cav- ity in a steady-state disk
9RJ could be achieved if the ionization degree of the circumjovian disk is high enough, and the plane - tary magnetic field is coupled to the disk. However, there is another requirement to make an inner cav- ity in a steady-state disk. To maintain its steady-state acc retion, the corotation radius rco should not be smaller than the radius of the inner cavi...
work page 1991
-
[7]
3RJ ( 2π/ωspin 36 hours ) 2/ 3 , (B.2) where ωspin is the angular velocity of the planetary spin. The rotation period of current Jupiter is 10 h; thus, the angular ve- locity of young Jupiter should have been about four times low er than that of current Jupiter if the inner cavity were created by the magnetic coupling between young Jupiter and the circumj...
work page 2010
-
[8]
21MR2ωspin. (B.3) Then, the planetary radius of young Jupiter would be as large as twice that of current Jupiter if we assumed conservation o f spin angular momentum. Evolutionary calculations of the pl ane- tary interior demonstrated, however, that the planetary ra dius of young Jupiter should have been about 1.5 times the current ra - dius at 1 Myr afte...
work page 2010
Show all 16 references
-
[9]
Appendix C: Radiation pressure The radiation pressure is caused by the direct momentum tran s- fer of photons
25RJ); however, subsequent N-body sim- ulations by Ogihara & Ida (2012) revealed that the positions of the cavity and the innermost satellite must have been the sam e. Appendix C: Radiation pressure The radiation pressure is caused by the direct momentum tran s- fer of photons...
2012
-
[10]
In contrast to FPh, the residual gravity caused by gas drag FD is independent of a/ lm (Weidenschilling 1977): FD = − 4πa3 3 ρp ρg dp dr
5 ( lm a ) 2 , (D.3) and FPh decreases with increasing of a. In contrast to FPh, the residual gravity caused by gas drag FD is independent of a/ lm (Weidenschilling 1977): FD = − 4πa3 3 ρp ρg dp dr . (D.4) Therefore, FPh/ FD is independent of a for the case of a < lm, while FP...
1977
-
[11]
(E.1) The heat conduction timescale within a dust particle, τcond, is (Krauss & Wurm 2005; Loesche & Wurm
4 × 10⁻² ( a 3 µm ) 5/ 2( T 300 K ) −1/ 2 s. (E.1) The heat conduction timescale within a dust particle, τcond, is (Krauss & Wurm 2005; Loesche & Wurm
2005
-
[12]
0 × 10−5 ( a 3 µm ) 2 s, (E.2) 10-5 10-4 10-3 10-2 10-1 100 101 102 102 103 κP, g [cm2 g-1] Temperature T [K] p = 100 dyn cm-2 p = 102 dyn cm-2 p = 104 dyn cm-2 p = 106 dyn cm-2 fitting 10-5 10-4 10-3 10-2 10-1 100 101 102 102 103 Fig. F .1. The Planck mean opacity of gas κP, ...
2014
-
[13]
The contribution of gas to the Rosseland mean opacity of a disk with solar metallicity, κR, g, is given by Freedman et al
4κR, d (Nakamoto & Nakagawa 1994). The contribution of gas to the Rosseland mean opacity of a disk with solar metallicity, κR, g, is given by Freedman et al. (2014), and we use their analytical fit of κR, g for the so- lar metallicity gas. We also evaluated κP, g, using Table 3...
2014
-
[14]
8] −1 cm2 g−1
15(T/ 100 K)0. 8] −1 cm2 g−1. (F.1) Within the temperature range of 100–2000 K, the pressure de- pendence of κP, g is small. Thus, we assume κP, g is only the func- tion of the temperature (see Figure F.1). We note that the dominant contributions to the Rosseland mean opacity ...
2000
-
[15]
Figure G.2 shows the surface density distribution of the dis k for various viscosity parameters
9RJ by choosing appropriate val- ues of the luminosity L and mass accretion rate ˙M. Figure G.2 shows the surface density distribution of the dis k for various viscosity parameters. We confirmed that a bump in the surface density distribution forms at the light barrier in all c...
2013
-
[16]
The migration timescale τmig is given by (e.g., Paardekooper et al
9 × 1025 g is the mass of Io and Minner is the mass of the inner satellite. The migration timescale τmig is given by (e.g., Paardekooper et al. 2011; Fujii et al
2011
Reviewed August 14, 2026 · model on record in the stance chip above.
Discussion (0). Continue with ORCID to comment.