Fast Optical Variability of the TeV Blazar PKS 1725+123 Observed by SVOM-VT and Insights from Multi-wavelength Follow-up Observations
Pith reviewed 2026-06-29 05:31 UTC · model grok-4.3
The pith
A two-zone spine-sheath jet model reproduces the high synchrotron peak and gamma-ray spectrum of the TeV FSRQ PKS 1725+123.
A machine-rendered reading of the paper's core claim, the machinery that carries it, and where it could break.
Core claim
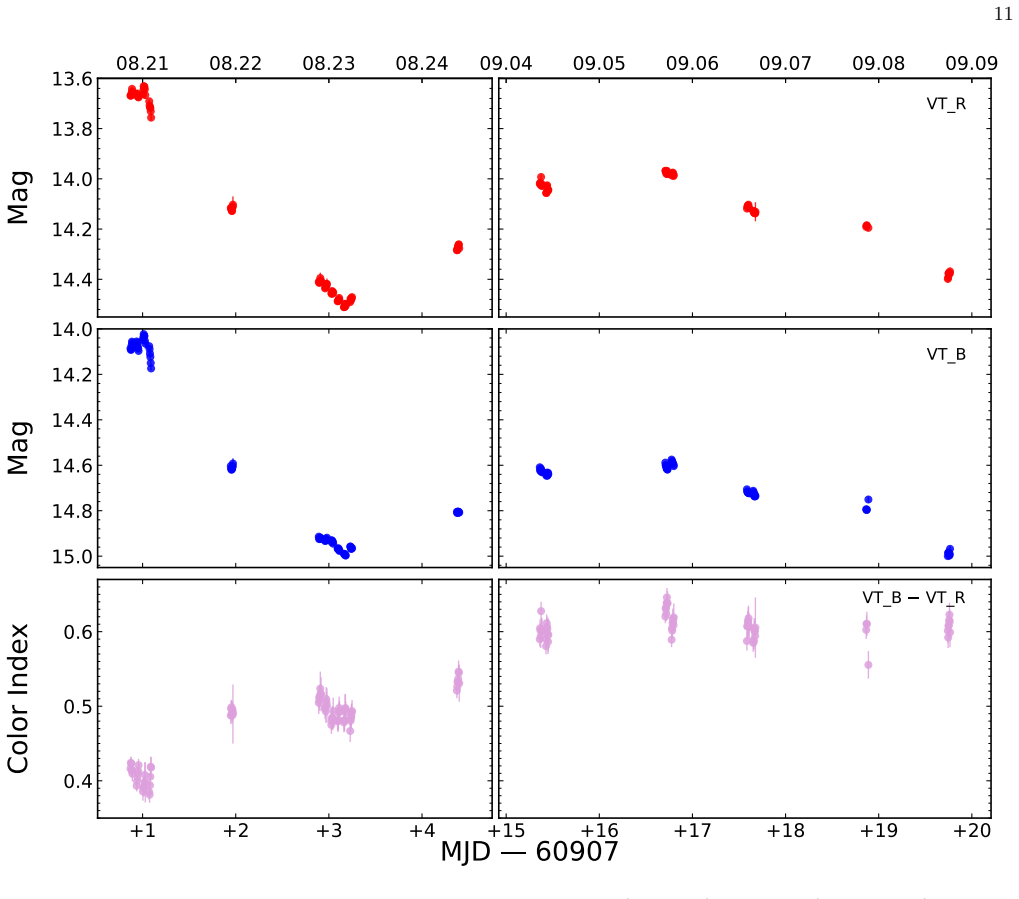
PKS 1725+123 exhibits fast optical variability on minute timescales in a high-flux state with bluer-when-brighter behavior. Its SED features a remarkably high synchrotron peak frequency. This is reproduced by a two-zone spine-sheath jet model in which the optical-X-ray emission arises from synchrotron radiation of relativistic electrons in a compact zone; the inverse Compton scattering of the same electrons accounts for the low-energy end of the Fermi-LAT spectrum; and the high-energy end of the Fermi-LAT spectrum is produced by inverse Compton scattering of the compact zone's synchrotron photons by a separate population of higher-energy electrons in an extended region.
What carries the argument
Two-zone spine-sheath jet model separating a compact zone (synchrotron plus low-energy IC) from an extended zone (high-energy IC of compact-zone photons).
If this is right
- The model requires the compact zone to be small enough to produce minute-scale optical variability.
- The gamma-ray spectrum must exhibit a break separating the two inverse Compton components from different zones.
- Optical and X-ray fluxes should vary together because they share the same electron population and zone.
- The extended zone must contain electrons at higher energies than those in the compact zone to upscatter the synchrotron photons.
Where Pith is reading between the lines
- Similar two-zone structures may appear in other FSRQs that reach TeV energies only during flares.
- Higher-cadence optical monitoring could directly measure the light-travel time across the compact zone.
- The model predicts that X-ray polarization should align with optical polarization if both arise from the same compact zone.
Load-bearing premise
A single electron population in the compact zone plus a separate higher-energy population in the extended zone can simultaneously match the optical color changes, synchrotron peak location, and broken power-law Fermi-LAT spectrum without external photon fields or extra parameters.
What would settle it
A gamma-ray spectrum that remains a single unbroken power law across the Fermi-LAT band, or the absence of correlated variability between optical and X-ray fluxes, would falsify the two-zone assignment of the emission components.
Figures


read the original abstract
PKS 1725+123 is a flat-spectrum radio quasar (FSRQ) with a redshift of $z=0.586$. The detection of this object in the TeV band was reported by the MAGIC telescopes and H.E.S.S. in August 2025. Subsequently, we promptly initiated Target-of-Opportunity observations using the Space-based multi-band astronomical Variable Objects Monitor (SVOM) satellite. By analyzing the observational optical data from SVOM-VT and comprehensively examining the Fermi-LAT and Swift-XRT observational data, it was found that the source is in a high-flux state across the optical, X-ray, and GeV $\gamma$-ray bands around the time of the TeV detections. Its optical flux reaches a historically unprecedented high level and shows significant variability on timescale as short as minutes. The variability is accompanied by changes in the color index, exhibiting a bluer when brighter behavior during the high-flux state. Based on the simultaneous multi-wavelength data, we construct the broadband spectral energy distribution (SED) of the source in the high-flux state. PKS 1725+123 demonstrates a remarkably high synchrotron peak frequency, which is distinctly different from that of other FSRQs. We propose a two-zone spine-sheath jet model to reproduce this SED. The optical--X-ray emission is generated by the synchrotron process of the relativistic electrons within a compact zone. The inverse Compton (IC) scattering processes of the same electron population contribute to the low-energy end of the Fermi-LAT spectrum, while the high-energy end of the Fermi-LAT spectrum is ascribed to the IC scattering of the synchrotron photons within the compact zone by the higher-energy electrons in an extended region.
Editorial analysis
A structured set of objections, weighed in public.
Referee Report
Summary. The manuscript reports Target-of-Opportunity multi-wavelength observations of the FSRQ PKS 1725+123 (z=0.586) triggered by its TeV detection. SVOM-VT optical data combined with Fermi-LAT and Swift-XRT show the source in a high-flux state with historically unprecedented optical brightness and variability on timescales as short as minutes, accompanied by bluer-when-brighter color changes. The high-state SED exhibits an unusually high synchrotron peak frequency. A two-zone spine-sheath jet model is proposed in which synchrotron and SSC emission from a compact zone account for the optical–X-ray and low-energy LAT bands, while IC scattering of compact-zone photons by higher-energy electrons in an extended zone accounts for the high-energy LAT segment.
Significance. The prompt, simultaneous coverage during the TeV high state supplies rare constraints on jet physics in FSRQs, especially the minute-scale optical variability and the atypical synchrotron peak location. If the two-zone model is quantitatively validated, it would illustrate how spine-sheath geometry can simultaneously reproduce a high synchrotron peak and a broken LAT spectrum without invoking external photon fields.
major comments (2)
- [SED modeling section] SED modeling section: the two-zone model is stated to reproduce the observed SED, yet no quantitative goodness-of-fit metrics (reduced χ², p-values), parameter uncertainties, or covariance information are supplied. Without these, it is impossible to judge whether the reproduction is unique or merely a tuned illustration.
- [Abstract and modeling description] Abstract and modeling description: the high-energy Fermi-LAT segment is assigned to the extended zone by construction to match the broken power-law shape. No explicit test is shown that rules out alternative explanations (different electron indices, external Compton on other fields, or a single-zone model with energy-dependent escape), leaving the necessity of the two-zone construction unquantified.
minor comments (2)
- Figure captions should explicitly state the time intervals over which each SED data set was averaged and whether the optical points include the rapid variability episodes.
- Notation for the two zones (compact vs. extended) should be defined once with consistent symbols throughout the text and figures.
Simulated Author's Rebuttal
We thank the referee for their constructive comments, which help clarify the presentation of our SED modeling. We respond to each major comment below.
read point-by-point responses
-
Referee: [SED modeling section] SED modeling section: the two-zone model is stated to reproduce the observed SED, yet no quantitative goodness-of-fit metrics (reduced χ², p-values), parameter uncertainties, or covariance information are supplied. Without these, it is impossible to judge whether the reproduction is unique or merely a tuned illustration.
Authors: We acknowledge that the manuscript presents the two-zone model as a reproduction of the SED features rather than a formal statistical fit. In the revised version we will report the specific parameter values adopted, include a reduced χ² calculated against the multi-wavelength data points, and provide estimated uncertainties on the principal parameters (e.g., magnetic field strength, electron indices, and zone sizes). Full covariance matrices are not feasible within the current modeling framework, but we will discuss parameter sensitivities to address uniqueness concerns. revision: yes
-
Referee: [Abstract and modeling description] Abstract and modeling description: the high-energy Fermi-LAT segment is assigned to the extended zone by construction to match the broken power-law shape. No explicit test is shown that rules out alternative explanations (different electron indices, external Compton on other fields, or a single-zone model with energy-dependent escape), leaving the necessity of the two-zone construction unquantified.
Authors: The two-zone construction is motivated by the requirement to simultaneously produce an unusually high synchrotron peak frequency (demanding a compact zone) and a spectral break in the LAT band. In the revision we will add an explicit comparison showing that a single-zone leptonic model requires extreme parameter choices to reach the observed synchrotron peak while still failing to reproduce the LAT break without additional ad-hoc assumptions. We will also briefly address why external-Compton scenarios are disfavored given the source properties. This will better quantify the motivation for the two-zone approach, although exhaustive exploration of every alternative remains beyond the scope of the present work. revision: partial
Circularity Check
No significant circularity detected
full rationale
The paper explicitly proposes a two-zone spine-sheath jet model as a way to reproduce the observed high-state SED, assigning synchrotron emission from a compact zone to the optical-X-ray band, SSC from the same electrons to the low-energy LAT segment, and IC from higher-energy electrons in an extended zone to the high-energy LAT segment. This is presented as a standard phenomenological fitting exercise to match fluxes, peak frequencies, and spectral shapes, with no claim of first-principles derivation, uniqueness theorem, or prediction that reduces to the input data by construction. No self-citations, ansatzes smuggled via prior work, or self-definitional steps appear in the provided text. The central claim remains a transparent model proposal rather than an internally forced result.
Axiom & Free-Parameter Ledger
Reference graph
Works this paper leans on
-
[1]
Fermi Large Area Telescope Fourth Source Catalog Data Release 4 (4FGL-DR4)
Abdo, A. A., Ackermann, M., Agudo, I., et al. 2010, ApJ, 721, 1425, doi: 10.1088/0004-637X/721/2/1425 Abdollahi, S., Acero, F., Baldini, L., et al. 2022, ApJS, 260, 53, doi: 10.3847/1538-4365/ac6751 Aharonian, F., Akhperjanian, A. G., Bazer-Bachi, A. R., et al. 2007, ApJL, 664, L71, doi: 10.1086/520635 Albert, J., Aliu, E., Anderhub, H., et al. 2007, ApJ,...
work page internal anchor Pith review Pith/arXiv arXiv doi:10.1088/0004-637x/721/2/1425 2010
-
[2]
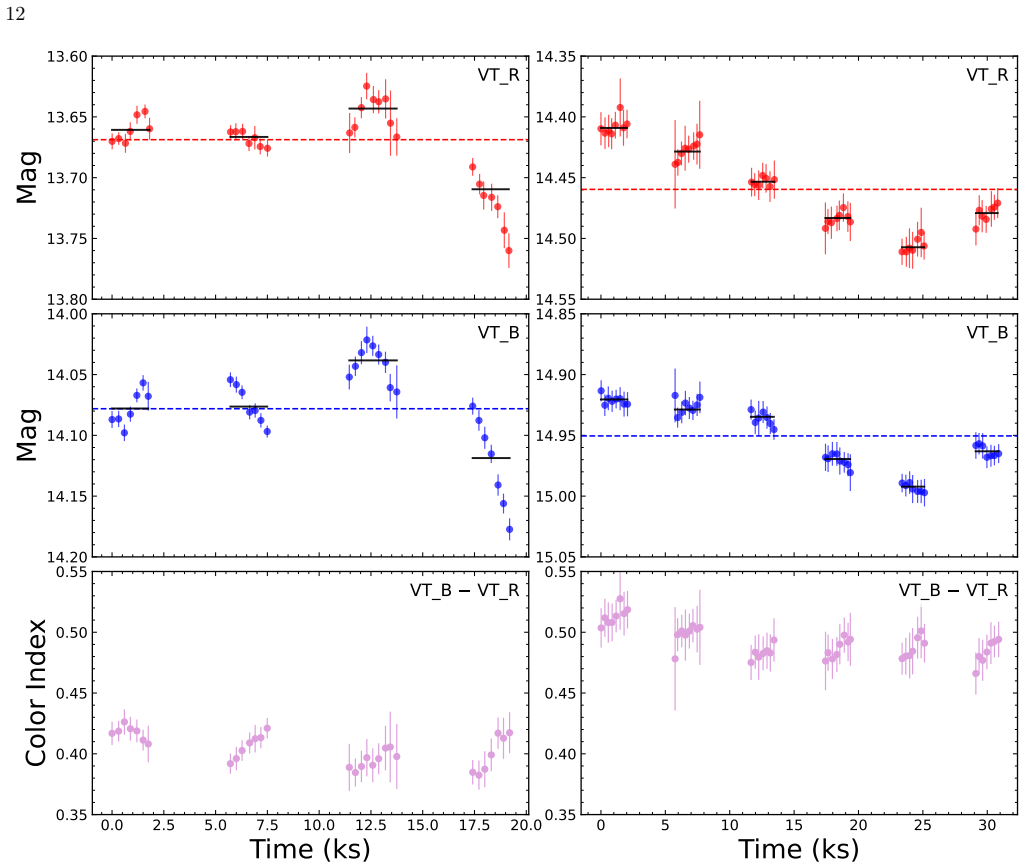
The time bin of the data points is also 5 minutes, the same as in Figure
Only the data from the consecutive four-orbit observations conducted on 2025 August 20–21 (left panels) and the consecutive six-orbit observations conducted on 2025 August 22–23 (right panels) are presented. The time bin of the data points is also 5 minutes, the same as in Figure
2025
-
[3]
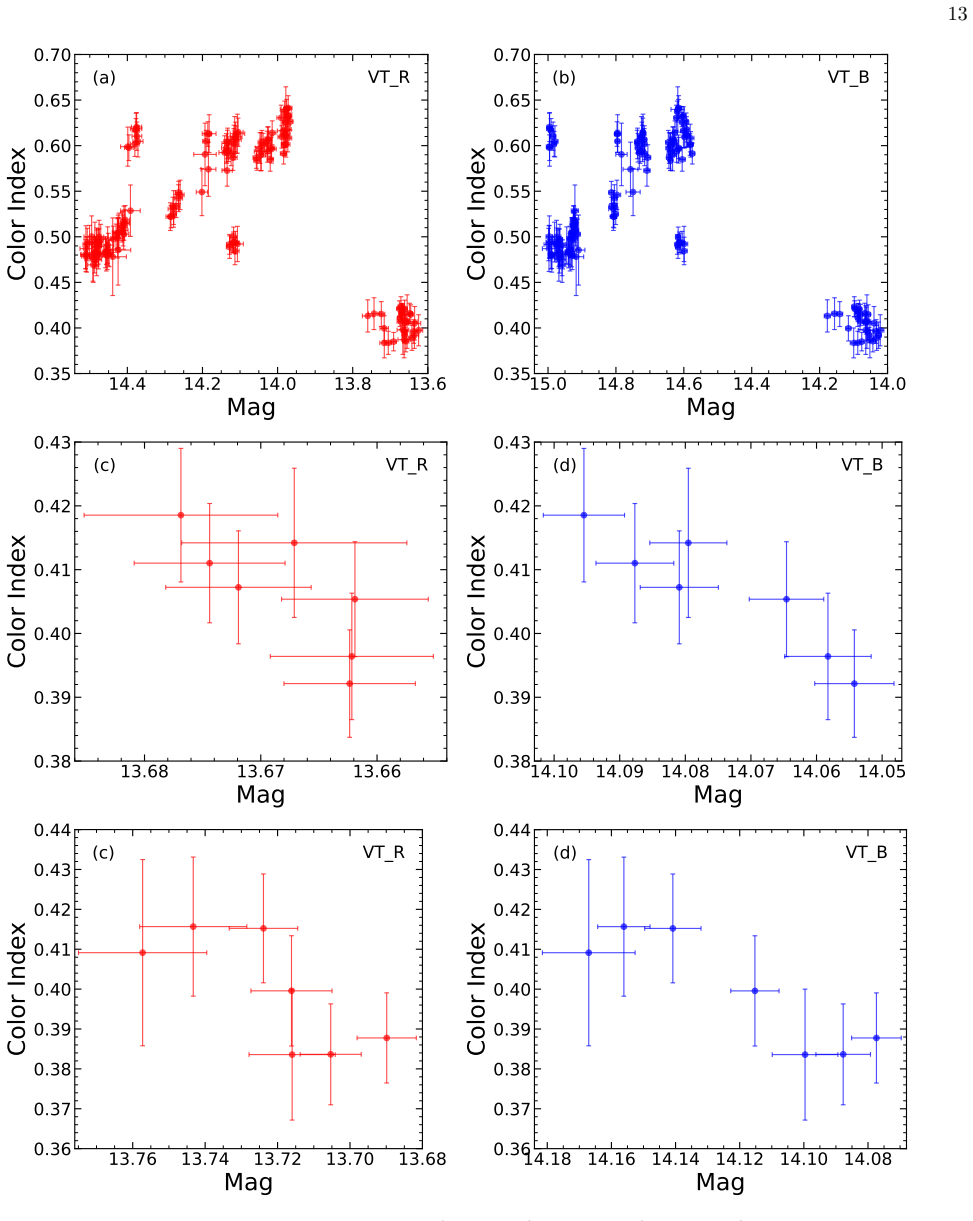
The horizontal dashed lines indicate the weighted-mean magnitude for the consecutive four-orbit (and six-orbit) observations, derived using Equation (1). The horizontal black solid lines denote the weighted-mean magnitude for each individual orbit observation. 13 13.613.814.014.214.4 Mag 0.35 0.40 0.45 0.50 0.55 0.60 0.65 0.70Color Index (a) VT_R 14.014.2...
-
[4]
Panels (e) and (f) illustrate the observational data from the fourth orbit of the consecutive four-orbit observations conducted on 2025 August 20–21
Panels (c) and (d) present the observational data from the second orbit of the consecutive four-orbit observations conducted on 2025 August 20–21. Panels (e) and (f) illustrate the observational data from the fourth orbit of the consecutive four-orbit observations conducted on 2025 August 20–21. 14 2 4 6 8 Flux [10 12 erg cm 2 s 1] 0.3 10 keV 0 2 4 6 Flux...
2025
-
[5]
The left panels show the three historical Swift-XRT observations, while the right panels display the Swift-XRT follow-up observations of the TeV detection for the source
corresponding to the TeV detections. The left panels show the three historical Swift-XRT observations, while the right panels display the Swift-XRT follow-up observations of the TeV detection for the source. MJD 60755 corresponds to 2025 March
2025
-
[6]
1–20” corresponds to all the SVOM-VT observation data in Figure 1, while “1–4
15 0 .11 1 01 001 0001 000010- 131 0- 121 0- 111 0- 101 0- 91 0- 8 F lux [erg cm- 2 s- 1]E nergy [GeV] 8.16-8.18 8.19-8.21 8.22-8.24 17-year HESS MAGIC Figure 5.Spectra observed by Fermi-LAT for PKS 1725+123, including the 17-year integrated spectrum (black symbols) and the three time-resolved spectra in the following time intervals: 2025 August 16–18 (ma...
2025
-
[7]
2024; Abdollahi et al
A.2.Fermi-LAT In the Fermi-LAT 14-year Source Catalog (4FGL-DR4, Ballet et al. 2024; Abdollahi et al. 2022), PKS 1725+123 is associated withγ-ray source 4FGL J1728.0+1216. We selected the Pass 8 data within the 0.1–1000 GeV band from a 15 ◦ region of interest (ROI) centered on the position of PKS 1725+123 (R.A.=262 ◦.029, decl.=12 ◦.261). The data cover t...
2024
-
[8]
gll iem v07.fits
and P8R3 SOURCE V3 instrument response function (IRF), with a bin size of 0.1 ◦. Photons with zenith angles exceeding 90 ◦ were excluded to minimize the background ofγ-rays produced in the Earth’s atmosphere. All sources within the ROI were included in the model. The spectral parameters of the sources located within a circle with a radius of 6 ◦ were left...
2004
-
[9]
light curve using a time bin of 1 day, as depicted in Figure 7(b). B.SED MODELING B.1.Model As described in Section 3.1, SVOM-VT has observed optical variability of PKS 1725+123 with a timescale of less than an hour, which suggests a small size of the emission region. Meanwhile, the hard optical spectrum, in combination with a soft X-ray spectrum, indicat...
2008
-
[10]
It should be noted that the derived parameter values are based on visual assessments and the model parameters cannot be fully constrained by the current observational data. B.2.Cooling and Acceleration Timescales of Electrons Given the rapid variability observed in the optical band, it was assumed that there is a compact emission region during the SED mod...
1979
-
[11]
Then, we obtaint acc ∼4×10 3 s
and assume an acceleration region width ∆r∼10 15 cm with Λ max ∼∆r. Then, we obtaint acc ∼4×10 3 s. It should be noted that the estimation results for the cooling and acceleration timescales of electrons are consistent with the observations. B.3.Jet Power By assuming that the the jet power is carried by relativistic electrons (P e), magnetic fields (PB), ...
2008
-
[12]
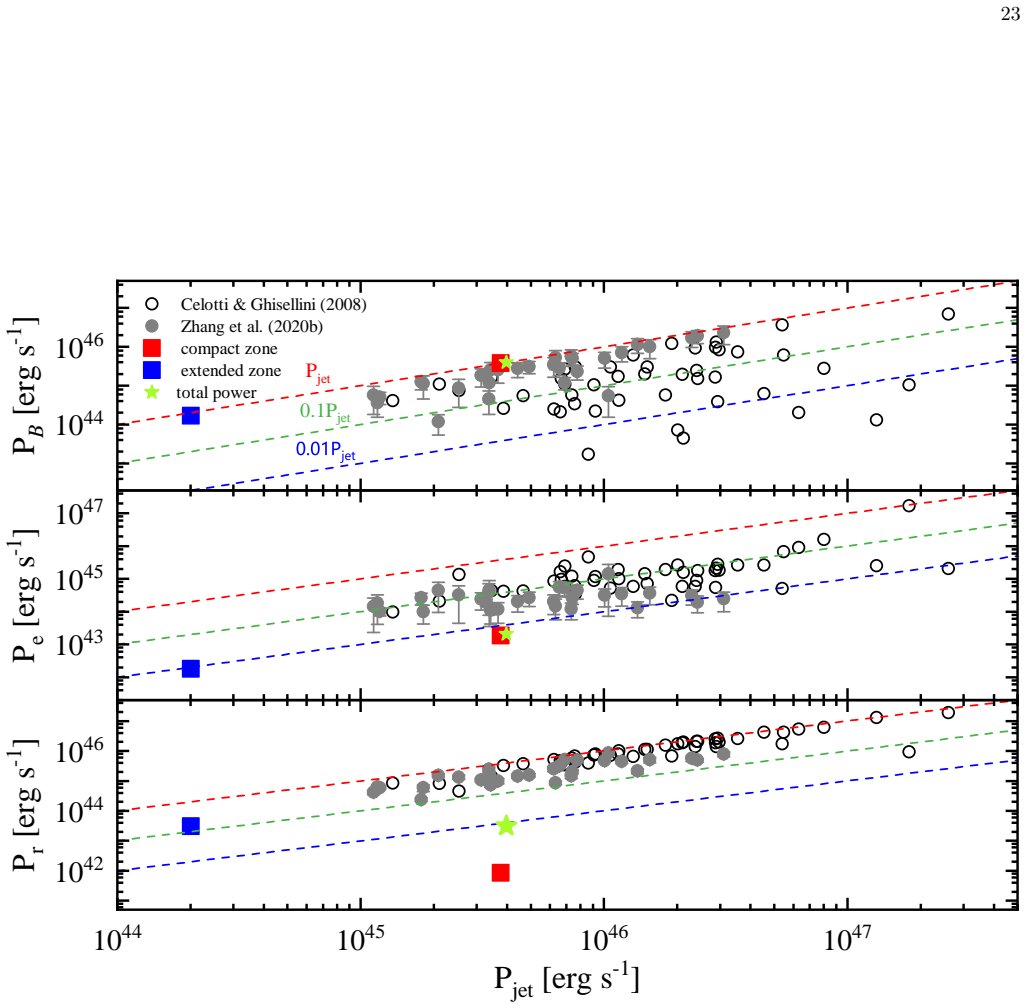
It is found that for the compact zone,P B/Pjet ∼0.995 andP r/Pjet ∼0.0002, and for the extended zone, PB/Pjet ∼0.841 andP r/Pjet ∼0.150. These results suggest that both zones are highly magnetized; however, the compact zone exhibits low radiation efficiency while the extended zone demonstrates high radiation efficiency. We compare the derived jet powers o...
2008
-
[13]
Comparing with otherγ-ray emission FSRQs, on average, PKS 1725+123 exhibits a low jet power and radiation efficiency, but a highly magnetized jet. 21 T able 2.Swift-XRT Spectral Analysis Results for PKS 1725+123 OBSID Date ExposureN 0 ΓX Fit StatisticF0.3−10 F0.3−2 F2−10 (YYYY-MM-DD) (s) (10 −4ph cm−2s−1keV−1) (10 −12erg cm−2s−1) 00019638001 2025-03-21 12...
2025
-
[14]
23 1 04 4104 6/s48 /s46/s48/s49/s80/s106 /s101/s1160.1Pj etPj et Celotti & Ghisellini (2008) Zhang et al. (2020b) compact zone extended zone total powerP B [erg s- 1]1 04 3104 5104 7Pe [erg s- 1]1 04 41 04 51 04 61 04 7104 2104 4104 6P j et [erg s- 1]P r [erg s- 1] Figure 8.P B,P e, andP r as functions ofP jet. The red and blue solid squares denote the va...
2008
discussion (0)
Sign in with ORCID, Apple, or X to comment. Anyone can read and Pith papers without signing in.