REVIEW 4 major objections 5 minor 53 references
Time evolution of the hierarchical networks between PubMed MeSH terms
T0 review · 4 major / 5 minor · reviewed 2026-08-14 · deepseek-v4-flash
Pith's one-line read New MeSH links attach by preference, not chance; child-rich nodes are favoured while high-ancestor nodes are avoided.
desk verdict A genuinely useful empirical study of how MeSH hierarchies grow and rewire, with a real but addressable statistical problem: the error bars assume independence across events that actually arrive in curator batches. read the letter →
The pith
A machine-rendered reading of the paper's core claim, the machinery that carries it, and where it could break.
The reading
What carries the argument
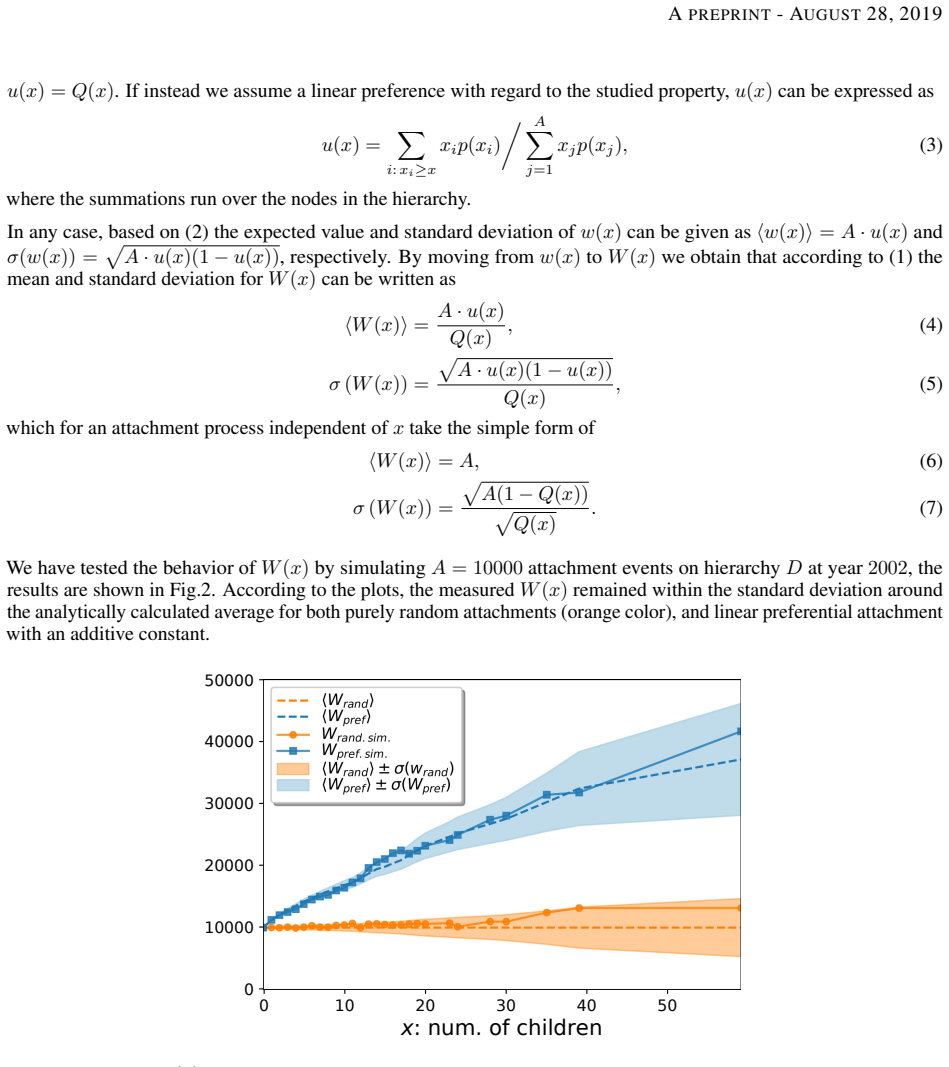
The carrying device is the ratio $W(x)=w(x)/Q(x)$, in which $Q(x)$ is the complementary cumulative distribution of a node property $x$ (number of children, parents, descendants, or ancestors) among available nodes, and $w(x)$ is the number of actually chosen nodes whose property is at least $x$. Under uniform random choice $W(x)$ is flat, an increasing $W(x)$ signals preference for large $x$, and a decreasing $W(x)$ signals anti-preference; the expected value and standard deviation of $W(x)$ are derived from a binomial model (Eq. 2) and used as error bands around the neutral value $W_{\mathrm{rand}}(x)$. For deletions the null model is selecting a uniformly random link, implemented by re-weighting $Q(x)$ by node degree, so that hubs are not mistakenly counted as preferred.
What would settle it
Run the same preference analysis with a null model that reshuffles which existing nodes are edited within each yearly update while preserving the number and type of edits, and check whether the strong preference for child-rich sources and the anti-preference for ancestor-rich sources remain outside the widened confidence intervals; a negative answer would overturn the central claim.
Extended reading notes
Core claim
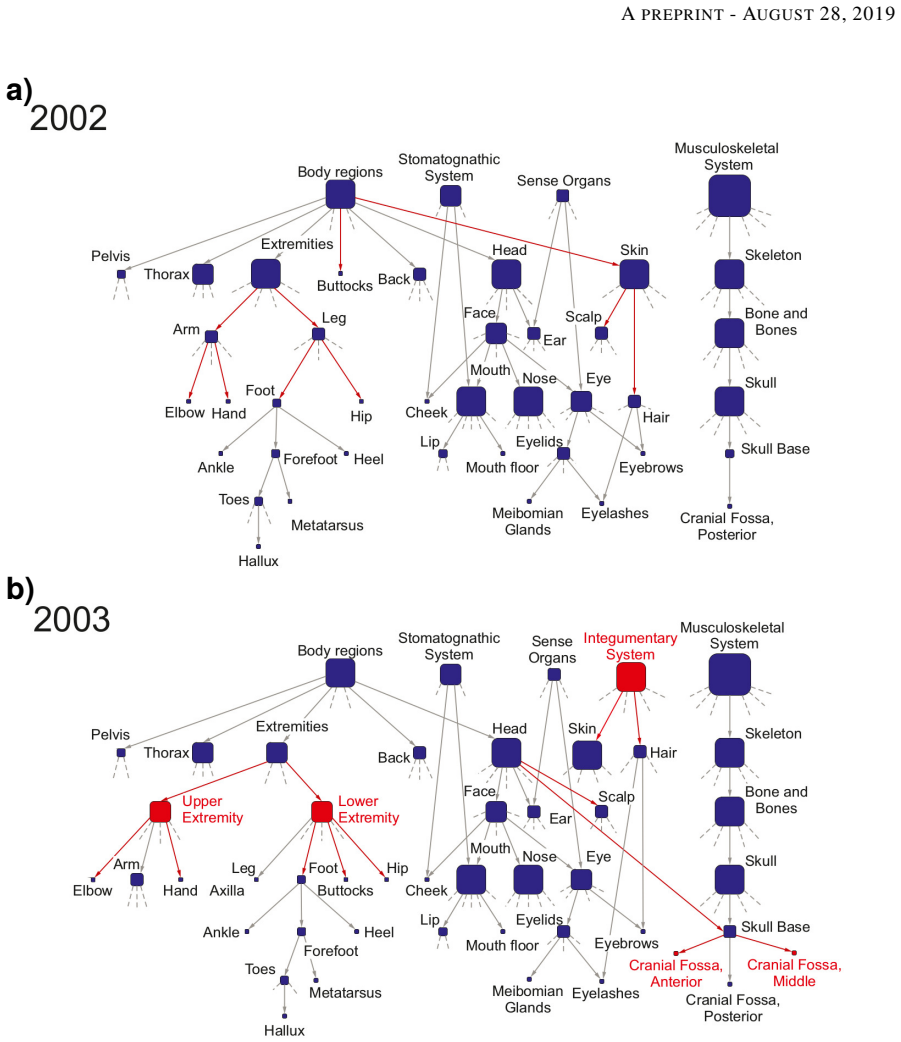
The central discovery is that the growth and restructuring of the MeSH hierarchies are not uniformly random. When a new link is added from an old node to a new term, source nodes with more children are chosen with significantly higher probability than uniform random selection would give; deletion events likewise strike nodes with many children and many descendants. Conversely, the total number of ancestors of the source node displays anti-preference across nearly all change types, meaning broad, shallow terms are less likely than chance to be the origin of a rewiring or a new link. Properties of the target node have a smaller influence than properties of the source node, and across the seven largest hierarchies the same combination of change type and property never shows preference in one hierarchy and anti-preference in another. The authors present these patterns as evidence that taxonomy evolution is shaped by an interplay of multiple non-uniform, hierarchy-specific attachment rules rather than by a single preferential-attachment law.
Load-bearing premise
The binomial error model in Eq. (2) treats every link addition and deletion as an independent Bernoulli trial with a fixed probability $u(x)$, so if MeSH updates are applied as coordinated batches by curators, the error bands around $W_{\mathrm{rand}}$ are too narrow and some apparent preferences could be false positives.
Editorial extensions
If this is right
- Deletion and rewiring between old nodes occur at the same magnitude as links to new nodes, so realistic models of hierarchy evolution must treat restructuring as a first-order process, not a perturbation.
- A single preferential-attachment rule cannot explain the data; predicting where the next change lands requires simultaneous preferences over out-degree, descendant count, and ancestor count.
- The anti-preference for high ancestor counts implies that reorganisation concentrates at intermediate depth, so future growth models should include a depth penalty for parent choice.
- Because no hierarchy displays the opposite preference on the same cell, the qualitative pattern is generalisable across the largest MeSH hierarchies and plausibly to curated hierarchies elsewhere.
- Source-node properties dominate target-node properties, so early indicators of upcoming rewiring should be measured on the parent side of a link.
Reading between the lines
- The observed anti-preference for ancestor count may reflect curator intent to place new terms under the most specifically relevant existing parent, so the pattern could be an emergent signature of expertise-driven classification rather than a purely structural law.
- If year-by-year edits are applied in coordinated batches, the independent-Bernoulli error bands in Eq. (7) are too narrow; a year-level permutation test would tell which reported preferences are robust to batch structure.
- The same $W(x)$ statistic can be exported to other curated hierarchies such as gene ontology or Wikipedia category trees, offering a direct test of whether organised knowledge systems share this preference pattern.
- A generative model linking parent choice to a power of child count multiplied by a decreasing function of depth could reproduce the joint pattern; fitting that function would turn the present qualitative findings into a quantitative evolution rule.
Signed reviews
Editorial analysis
A structured set of objections, weighed in public.
Referee Report
Summary. The paper studies the temporal evolution of the hierarchical networks formed by PubMed MeSH terms. Using yearly snapshots of 16 hierarchies (and 7 hierarchies with more than 1000 nodes during the whole period), the authors classify link changes into five types: additions involving old/new sources and targets, and deletions between old nodes. For each change type and for four node properties (number of children, number of parents, total descendants, total ancestors), they compare the observed complementary cumulative distribution of selected nodes against a random null model, computing W_emp(x) and comparing it to W_rand(x) plus or minus a binomial standard deviation. The central finding is that attachment events preferentially select source nodes with many children and many descendants, while the number of ancestors of the source node shows anti-preference across essentially all link-change types; deletion events also preferentially strike nodes with many children and descendants. The authors aggregate per-hierarchy classifications into a summary table and argue that the observed preferences are consistent across hierarchies.
Significance. If the statistical results hold, the paper provides a useful empirical characterization of how a large curated hierarchical ontology evolves, with concrete evidence that restructuring is not uniform but is biased by topological and hierarchical node properties. The analysis uses publicly available data, the methodology is transparent, and the authors validate the W(x) framework on simulated attachment events, which are strengths. The claimed preferences are potentially relevant for modeling the evolution of hierarchical systems beyond MeSH. However, the significance is conditional on the validity of the independence assumptions underlying the error bars and on the reproducibility of the qualitative classification scheme, both of which need strengthening before the empirical claims can be fully trusted.
major comments (4)
- [Data and methods, Eqs. (2), (10); Supporting Information Table I] The binomial error model in Eq. (2) treats each attachment or deletion event as an independent Bernoulli trial with a fixed probability u(x), and Eq. (10) sums variances over years. However, MeSH updates are coordinated annual curation batches, not independent per-link decisions. Supporting Information Table I shows hierarchy G in 2008 undergoing 632 node deletions, 1059 link deletions, and 345 old-to-new link additions in a single year, and hierarchy N in 2008 adding 254 nodes and 244 new-to-new links. Such coordinated restructuring induces positive correlations among events, so the variance around W_rand is underestimated and the classification labels, especially w+ and w- but possibly some s+/s- cells dominated by one batch, may be false positives. The authors should test for overdispersion, use a year-clustered bootstrap, or repeat the analysis excluding the major restructuring years.
- [Results, category definitions] The distinction between 'strong' and 'weak' preference is not reproducible: the categories are defined by whether W_emp(x) exceeds W_rand(x) + sigma(W_rand(x)) by 'a large amount' or 'a small amount', with no numerical threshold. Table 2 and the aggregated Table 3 therefore depend on an unreported judgment call. A quantitative rule (for example, W_emp above W_rand + k sigma for a stated constant k, or a formal test statistic applied uniformly to all cells) is needed.
- [Tables 2, S8-S14, and Table 3] The analysis classifies on the order of hundreds of cells (7 hierarchies, 5 link-change types, and 8 property-by-endpoint combinations per hierarchy), yet no correction for multiple testing is applied. Under the null hypothesis, a substantial number of w+ and w- labels would be expected to appear by chance. The authors should report adjusted significance levels or quantify the expected number of false classifications.
- [Table 3 and aggregation method] The aggregated Table 3 averages labels with weights s+=1, w+=p+=0.5, s0=0, w-=p-=-0.5, s-=-1, irrespective of the number of events or the statistical power underlying each label. A strong label from a hierarchy with few events contributes the same weight as one from hierarchy D with many events, and cells with more than three i.s. entries are simply marked i.s., potentially hiding genuine signals in smaller hierarchies. Weighting by event counts or by a confidence measure would make the aggregation more defensible.
minor comments (5)
- [Abstract and throughout] The term 'MeSH' is misspelled as 'MesH' in several places, including the abstract and the introduction.
- [Data and methods, basic properties] The sentence 'the total number of descendants of the individual roots ... varies roughly between a 1,00 and a 10,000 nodes' contains a typo and should read 'between 100 and 10,000 nodes'.
- [Discussion] The phrase 'the likelihood for nodes to take part in restructuring events can be effected by their properties' should use 'affected' rather than 'effected'.
- [Tables 2 and 3] The column headers for the link-change types are difficult to parse because of repeated 'source:' and 'target:' lines; clearer labels such as 'add new->new', 'add new->old', 'add old->new', 'add old->old', and 'delete old->old' would improve readability.
- [Figure 3] The text refers to colors 'orange' and 'blue' for the curves; if the journal does not guarantee color printing, the figure should also use distinguishable line styles or markers.
Circularity Check
No significant circularity: preferences are measured against an empirical null baseline derived from the data, not fitted or defined in terms of the conclusions.
full rationale
The paper's central claims are empirical measurements rather than derivations from assumptions that already contain the conclusion. W_emp(x) in Eq. (8) is constructed from observed counts w_t(x) of link-change events, while the neutral baseline W_rand and its standard deviation in Eqs. (9)-(10) are computed from the complementary cumulative distribution Q_t(x) of the available nodes or links under the null hypothesis of uniform selection. No parameter is fitted to the event counts and then reported as a prediction; the preference and anti-preference classifications are direct comparisons between observed and null expectations. The only self-citation, Ref. [23] (with a duplicate as Ref. [47]), supplies the comparison method from Pollner et al. 2006; this is a general methodological tool rather than a result specific to MeSH, and it is independently validated by the paper's own simulations in Fig. 2. Concerns about the binomial independence assumption under curated batch updates, such as the large coordinated restructuring of hierarchy G in 2008, are about statistical validity and overdispersion, not circularity: a too-narrow error band could cause false positive classifications, but it does not make the measured W_emp equal to the null model or to any fitted input. No load-bearing step reduces to its own inputs by construction, so the circularity score is 0.
Assumptions & free parameters
assumptions (4)
- domain assumption MeSH yearly snapshots provide an accurate and complete representation of the hierarchy evolution.
- standard math Attachment and detachment events are independent Bernoulli trials with a fixed per-event probability u(x).
- domain assumption Uniform random choice of nodes for attachment and of links for detachment is the correct neutral baseline.
- domain assumption Hierarchies with more than 1000 nodes are sufficient to generalize to all 16 MeSH hierarchies.
Cite this review
Pith. "Pith review of Time evolution of the hierarchical networks between PubMed MeSH terms." pith.science (2026). https://pith.science/paper/NMEN273P
@misc{pith2026190810214,
  author       = {Pith},
  title        = {Pith review of: Time evolution of the hierarchical networks between PubMed MeSH terms},
  year         = {2026},
  howpublished = {\url{https://pith.science/paper/NMEN273P}},
  note         = {Machine review of arXiv:1908.10214}
}
read the original abstract
Hierarchical organisation is a prevalent feature of many complex networks appearing in nature and society. A relating interesting, yet less studied question is how does a hierarchical network evolve over time? Here we take a data driven approach and examine the time evolution of the network between the Medical Subject Headings (MeSH) provided by the National Center for Biotechnology Information (NCBI, part of the U. S. National Library of Medicine). The network between the MeSH terms is organised into 16 different, yearly updated hierarchies such as "Anatomy", "Diseases", "Chemicals and Drugs", etc. The natural representation of these hierarchies is given by directed acyclic graphs, composed of links pointing from nodes higher in the hierarchy towards nodes in lower levels. Due to the yearly updates, the structure of these networks is subject to constant evolution: new MeSH terms can appear, terms becoming obsolete can be deleted or be merged with other terms, and also already existing parts of the network may be rewired. We examine various statistical properties of the time evolution, with a special focus on the attachment and detachment mechanisms of the links, and find a few general features that are characteristic for all MeSH hierarchies. According to the results, the hierarchies investigated display an interesting interplay between non-uniform preference with respect to multiple different topological and hierarchical properties.
Figures

Reference graph
Works this paper leans on
-
[1]
Statistical mechanics of complex networks
Albert R, Barabási AL. Statistical mechanics of complex networks. Rev Mod Phys. 2002;74:47–97
work page 2002
-
[2]
Evolution of Networks: From Biological Nets to the Internet and WWW
Mendes JFF, Dorogovtsev SN. Evolution of Networks: From Biological Nets to the Internet and WWW. Oxford: Oxford Univ. Press; 2003
work page 2003
-
[3]
Hierarchical Organization of Modularity in Metabolic Networks
Ravasz E, Somera AL, Mongru DA, Oltvai ZN, Barabási AL. Hierarchical Organization of Modularity in Metabolic Networks. Science. 2002;297:1551 – 1555
work page 2002
-
[4]
Hierarchical structure and the prediction of missing links in networks
Clauset A, Moore C, Newman MEJ. Hierarchical structure and the prediction of missing links in networks. Nature. 2008;453:98–101
work page 2008
-
[5]
Hierarchy in Natural and Social Sciences
Pumain D. Hierarchy in Natural and Social Sciences. vol. 3 of Methodos Series. Dodrecht, The Netherlands: Springer Netherlands; 2006
work page 2006
-
[6]
Measuring the hierarchy of feedforward networks
Corominas-Murtra B, Rodríguez-Caso C, Goñi J, Solé R. Measuring the hierarchy of feedforward networks. Chaos. 2011;21:016108
work page 2011
-
[7]
Why We Live in Hierarchies? A Quantitative Treatise
Zafeiris A, Vicsek T. Why We Live in Hierarchies? A Quantitative Treatise. Berlin: Springer; 2018
work page 2018
-
[8]
Hierarchy measures in complex networks
Trusina A, Maslov S, Minnhagen P, Sneppen K. Hierarchy measures in complex networks. Phys Rev Lett. 2004;92:178702
work page 2004
Show all 53 references
-
[9]
Hierarchy Measure for Complex Networks
Mones E, Vicsek L, Vicsek T. Hierarchy Measure for Complex Networks. PLoS ONE. 2012;7:e33799
2012
-
[10]
On the origins of hierarchy in complex networks
Corominas-Murtra B, Goñi J, Solé RV , Rodríguez-Caso C. On the origins of hierarchy in complex networks. Proc Natl Acad Sci USA. 2013;110:13316––13321
2013
-
[11]
Random walk hierarchy: What is more hierarchical, a chain a tree or a star? Scientific Reports
Czégel D, Palla G. Random walk hierarchy: What is more hierarchical, a chain a tree or a star? Scientific Reports. 2015;5:17994
2015
-
[12]
Finding hierarchy in directed online social networks
Gupte M, Shankar P, Li J, Muthukrishnan S, Iftode L. Finding hierarchy in directed online social networks. In: Proceedings of the 20th international conference on World wide web. ACM; 2011. p. 557–566
2011
-
[13]
Resolution of ranking hierarchies in directed networks
Letizia E, Barucca P, Lillo F. Resolution of ranking hierarchies in directed networks. PLOS ONE. 2018;13(2):1–25. doi:10.1371/journal.pone.0191604
2018 doi
-
[14]
Hierarchical sructure and modules in the Escherichia coli transcriptional regulatory network revealed by a new top-down approach
Ma HW, Buer J, Zeng AP. Hierarchical sructure and modules in the Escherichia coli transcriptional regulatory network revealed by a new top-down approach. BMC Bioinformatics. 2004;5:199
2004
-
[15]
The formation and maintenance of crayfish hierarchies: behavioral and self-structuring properties
Goessmann C, Hemelrijk C, Huber R. The formation and maintenance of crayfish hierarchies: behavioral and self-structuring properties. Behav Ecol Sociobiol. 2000;48:418––428. 11 A PREPRINT - AUGUST 28, 2019
2000
-
[16]
Hierarchical group dynamics in pigeon flocks
Nagy M, Akos Z, Biro D, Vicsek T. Hierarchical group dynamics in pigeon flocks. Nature. 2010;464:890––893
2010
-
[17]
Context-dependent hierarchies in pigeons
Nagy M, Vásárhelyi G, Pettit B, Roberts-Mariani I, Vicsek T, Biro D. Context-dependent hierarchies in pigeons. Proc Natl Acad Sci USA. 2013;110:13049––13054
2013
-
[18]
J Stat Phys
Ozogány K, Vicsek T. J Stat Phys. 2015;158:628. doi:https://doi.org/10.1007/s10955-014-1131-7
2015 doi
-
[19]
Ranking network of captive rhesus macaque society: A sophisticated corporative kingdom
Fushing H, McAssey MP, Beisner B, McCowan B. Ranking network of captive rhesus macaque society: A sophisticated corporative kingdom. PLoS ONE. 2011;6:e17817
2011
-
[20]
Hierarchy and dynamics of neural networks
Kaiser M, Hilgetag CC, Kötter R. Hierarchy and dynamics of neural networks. Front Neuroinform. 2010;4:112
2010
-
[21]
Hierarchical networks of scientific journals
Palla G, Tibély G, Mones E, Pollner P, Vicsek T. Hierarchical networks of scientific journals. Palgrave Communi- cations. 2015;1:15016
2015
-
[22]
Self-similar community structure in a network of human interactions
Guimerà R, Danon L, Díaz-Guilera A, Giralt F, Arenas A. Self-similar community structure in a network of human interactions. Phys Rev E. 2003;68:065103
2003
-
[23]
Preferential attachment of communities: The same principle, but a higher level
Pollner P, Palla G, Vicsek T. Preferential attachment of communities: The same principle, but a higher level. Europhys Lett. 2006;73:478–484
2006
-
[24]
Self-organization versus hierarchy in open-source social networks
Valverde S, Solé RV . Self-organization versus hierarchy in open-source social networks. Phys Rev E. 2007;76:046118
2007
-
[25]
Emergence of Leader-Follower Hierarchy Among Players in an On-Line Experiment
Tóth BJ, Palla G, Mones E, Havadi G, Páll N, Pollner P, et al. Emergence of Leader-Follower Hierarchy Among Players in an On-Line Experiment. In: 2018 IEEE/ACM International Conference on Advances in Social Networks Analysis and Mining (ASONAM); 2018. p. 1184–1190
2018
-
[26]
Confronting the mystery of urban hierarchy
Krugman PR. Confronting the mystery of urban hierarchy. J Jpn Int Econ. 1996;10:399––418
1996
-
[27]
Fractal Cities: A Geometry of Form and Function
Batty M, Longley P. Fractal Cities: A Geometry of Form and Function. San Diego: Academic; 1994
1994
-
[28]
Comparing the Hierarchy of Keywords in On-Line News Portals
Tibély G, Sousa-Rodrigues D, Pollner P, Palla G. Comparing the Hierarchy of Keywords in On-Line News Portals. PLoS ONE. 2016;11:e0165728
2016
-
[29]
Information theoretical analysis of the aggregation and hierarchical structure of ecological networks
Hirata H, Ulanowicz R. Information theoretical analysis of the aggregation and hierarchical structure of ecological networks. J Theor Biol. 1985;116:321—-341
1985
-
[30]
On quantifying hierarchical connections in ecology
Wickens J, Ulanowicz R. On quantifying hierarchical connections in ecology. J Soc Biol Struct. 1988;11:369––378
1988
-
[31]
Unfinished Synthesis: Biological Hierarchies and Modern Evolutionary Thought
Eldredge N. Unfinished Synthesis: Biological Hierarchies and Modern Evolutionary Thought. New York: Oxford Univ. Press; 1985
1985
-
[32]
The hierarchical structure of organisms
McShea DW. The hierarchical structure of organisms. Paleobiology. 2001;27:405––423
2001
-
[33]
The Evolutionary Origins of Hierarchy
Mengistu H, Huizinga J, Mouret JB, Clune J. The Evolutionary Origins of Hierarchy. PLOS Computational Biology. 2016;12(6):1–23. doi:10.1371/journal.pcbi.1004829
2016 doi
-
[34]
Structure and dynamical behavior of non-normal networks
Asllani M, Lambiotte R, Carletti T. Structure and dynamical behavior of non-normal networks. Science Advances. 2018;4(12). doi:10.1126/sciadv.aau9403
2018 doi
-
[35]
space of physics journals
Katchanov YL, Markova YV . The “space of physics journals”: topological structure and the Journal Impact Factor. Scientometrics. 2017;113(1):313–333. doi:10.1007/s11192-017-2471-2
2017 doi
-
[36]
Science Mapping: A Systematic Review of the Literature
Chen C. Science Mapping: A Systematic Review of the Literature. Journal of Data and Information Science. 2017;2(2):1–40. doi:https://doi.org/10.1515/jdis-2017-0006
2017 doi
-
[37]
In: Science Mapping Tools and Applications
Chen C, Song M. In: Science Mapping Tools and Applications. Springer, Cham; 2017
2017
-
[38]
The rise of graphene expectations: Anticipatory practices in emergent nanotech- nologies
Alvial-Palavicino C, Konrad K. The rise of graphene expectations: Anticipatory practices in emergent nanotech- nologies. Futures. 2018;doi:https://doi.org/10.1016/j.futures.2018.10.008
2018 doi
-
[39]
Mapping the Landscape and Evolutions of Green Supply Chain Management
Shan W, Wang J. Mapping the Landscape and Evolutions of Green Supply Chain Management. Sustainability. 2018;10(3). doi:10.3390/su10030597
2018 doi
-
[40]
Group performance is maximized by hierarchical competence distribution
Zafeiris A, Vicsek T. Group performance is maximized by hierarchical competence distribution. Nature Communications. 2013;4:2484. doi:https://doi.org/10.1038/ncomms3484
2013 doi
-
[41]
Glassy nature of hierarchical organizations
Zamani M, Vicsek T. Glassy nature of hierarchical organizations. Scientific Reports. 2017;7:1382. doi:10.1038/s41598-017-01503-y
2017 doi
-
[42]
Stability of glassy hierarchical networks
Zamani M, Camargo-Forero L, Vicsek T. Stability of glassy hierarchical networks. New Journal of Physics. 2018;20(2):023025. doi:10.1088/1367-2630/aaa8ca
2018 doi
-
[43]
Emergence of scaling in random networks
Barabási AL, Albert R. Emergence of scaling in random networks. Science. 1999;286:509–512
1999
-
[44]
Evolution of the social network of scientific collaborations
Barabási AL, Jeong H, Néda Z, Ravasz E, Schubert A, Vicsek T. Evolution of the social network of scientific collaborations. Physica A. 2002;311:590–614. 12 A PREPRINT - AUGUST 28, 2019
2002
-
[45]
Measuring preferential attachment in evolving networks
Jeong H, Néda Z, Barabási AL. Measuring preferential attachment in evolving networks. EPL. 2003;61:567
2003
-
[46]
Clustering and preferential attachment in growing networks
Newman MEJ. Clustering and preferential attachment in growing networks. Phys Rev E. 2001;64:025102(R)
2001
-
[47]
Preferential attachment of communities: The same principle, but a higher level
Pollner P, Palla G, Vicsek T. Preferential attachment of communities: The same principle, but a higher level. EPL. 2006;73:478
2006
-
[48]
Quantifying social group evolution
Palla G, Barabási AL, Vicsek T. Quantifying social group evolution. Nature. 2007;446:664–667
2007
-
[49]
A Maximum-Entropy approach for accurate document annotation in the biomedical domain
Tsatsaronis G, Macari N, Torge S, Dietze H, Schroeder M. A Maximum-Entropy approach for accurate document annotation in the biomedical domain. Journal of Biomedical Semantics. 2012;3:S2
2012
-
[50]
de Leenheer P. 5. In: Hepp M, de Leenheer P, Moor AD, Sure Y , editors. Ontology evolution. US: Springer; 2008. p. 131–176
2008
-
[51]
In: Küppers BO, Hahn U, Artmann S, editors
McCray AT, Lee K. In: Küppers BO, Hahn U, Artmann S, editors. Taxonomic Change as a Reflection of Progress in a Scientific Discipline. Berlin, Heidelberg: Springer Berlin Heidelberg; 2013. p. 189–208
2013
-
[52]
In: Gelbukh A, editor
Tsatsaronis G, Varlamis I, Kanhabua N, Nørvåg K. In: Gelbukh A, editor. Temporal Classifiers for Predicting the Expansion of Medical Subject Headings. Berlin, Heidelberg: Springer Berlin Heidelberg; 2013. p. 98–113
2013
-
[53]
Available from: https://www.nlm
In this study we use publicly available data from the website of PubMed;. Available from: https://www.nlm. nih.gov/mesh/filelist.html. Supporting information S1 Basic properties of the MeSH hierarchies Owing to the yearly updates, the MeSH hierarchies evolve in time, displayin...
2019
Reviewed August 14, 2026 · model on record in the stance chip above.
Discussion (0). Continue with ORCID to comment.