REVIEW 3 major objections 5 minor 41 references
This paper presents AR(p)-FOCuS, an exact and computationally efficient implementation of the generalized likelihood-ratio test for online detection of mean changes when the noise is an autoregressive process of order p, achieving average O
Reviewed by Pith at T0; open to challenge. T0 means a machine referee read the full paper against a public rubric. the ladder, T0–T4 →
T0 review · deepseek-v4-flash
2026-08-01 21:18 UTC pith:NTNOSIQZ
load-bearing objection Solid algorithmic extension of FOCuS to AR(p) noise; the O(log n) claim and the power claim are less secure than the abstract suggests. the 3 major comments →
An Efficient Likelihood Ratio Test for Online Changepoint Detection in the Presence of Autocorrelation
The pith
A machine-rendered reading of the paper's core claim, the machinery that carries it, and where it could break.
Core claim
AR(p)-FOCuS is an exact implementation of the GLR test for a change in mean when the noise is AR(p), not an approximation. The central identity is Proposition 1: LR_n(μ1) = max( max_{j=1..p} S_{n,n−j}(μ1), Q_n(μ1) ), where Q_n satisfies the recursion Q_n(μ1) = max{ S_{n−1,n−p−1}(μ1), Q_{n−1}(μ1) } + C_n(μ1). This separates the likelihood-ratio statistic into contributions from changes that occurred within the last p observations—handled directly—and older changes, which are propagated recursively. The recursion enables functional pruning: the algorithm stores the statistic as a piecewise-quadratic function of the post-change mean and discards quadratics that can never become maximal, so the
What carries the argument
The key machinery is the recursion of Proposition 1, which splits the likelihood-ratio statistic into two parts: the recent-change terms S_{n,n−j}(μ1) for j=1,…,p, which capture the transient effect of a mean shift on the first p whitened observations, and the older-change term Q_n(μ1), which is updated recursively. This split allows the FOCuS-style functional pruning to operate only on Q_n, where the post-change mean has reached its long-run level. The algorithm stores the statistic as a set of quadratics in μ1, each corresponding to a candidate changepoint, and prunes those that cannot be optimal for any future data. The pruning is the mechanism that keeps the per-iteration cost at O(log n
Load-bearing premise
The method's advantage rests on the assumption that the true noise is genuinely AR(p) and that its order and coefficients can be estimated reliably from a change-free probation period; if that period is short or the model is misspecified, the paper's own simulations show it can perform worse than the plain IID detector.
What would settle it
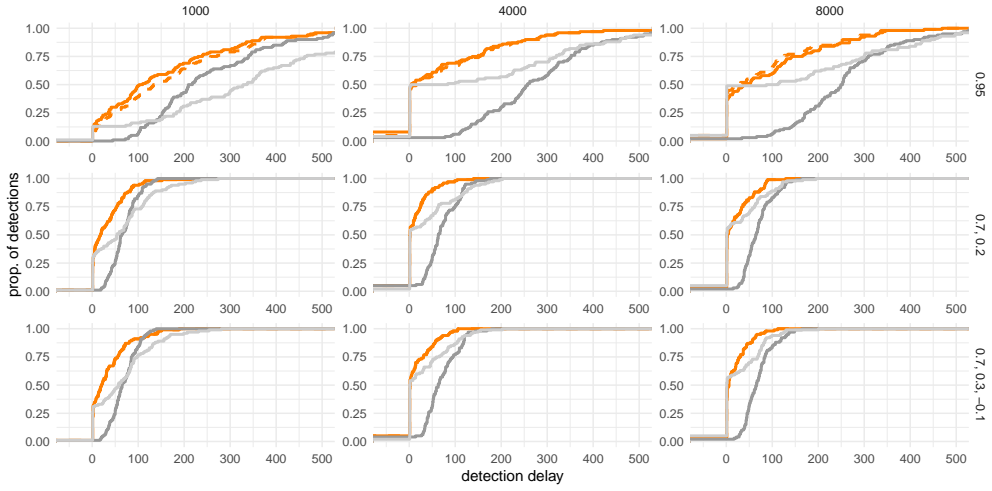
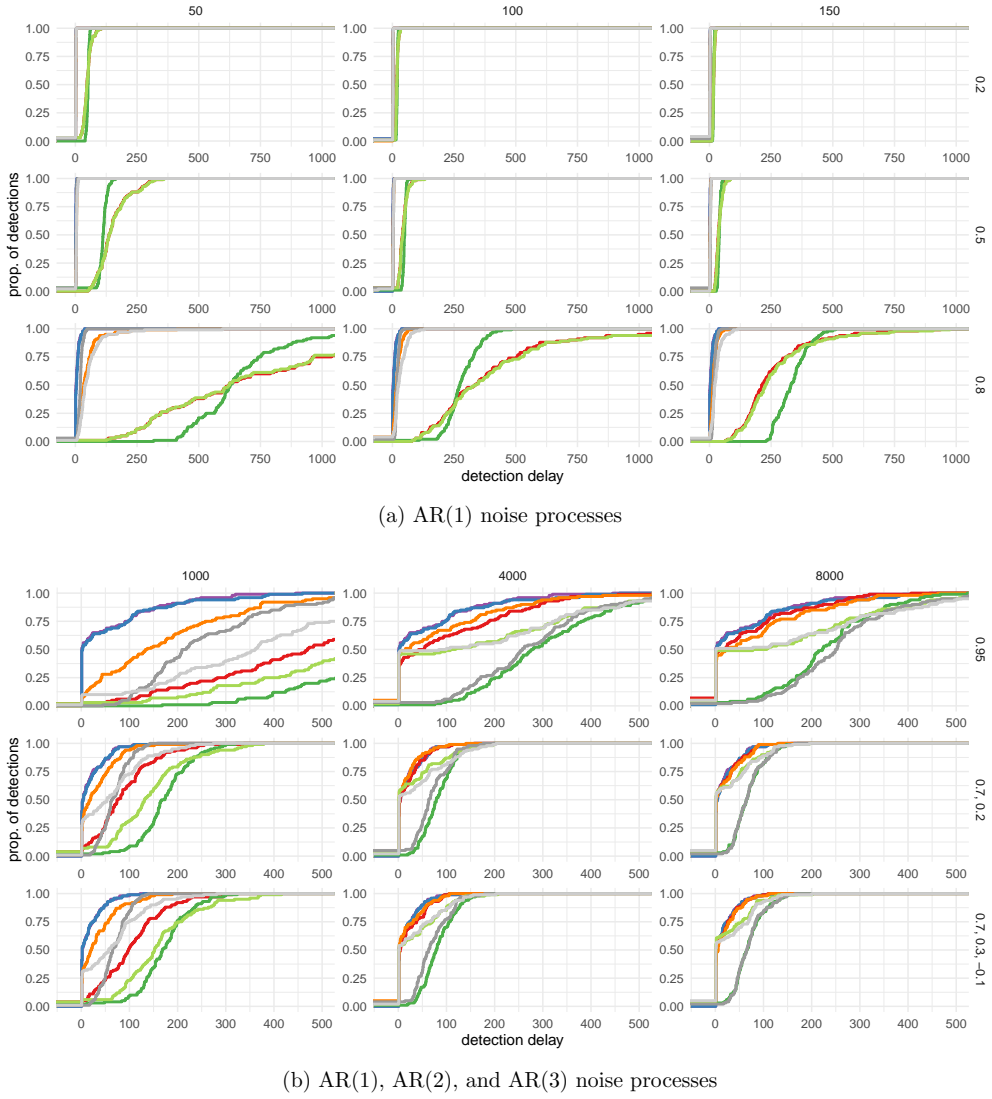
Simulate data that is not AR(p)—for instance, long-range dependence or a slow linear trend—then calibrate the threshold using the paper's constant-mean AR(p) null and check whether the empirical false-positive rate stays at the nominal level. Alternatively, feed truly IID data while assuming a strong AR(1) coefficient (e.g., ρ=0.9) and observe detection power for small changes: the paper's Figure 16 indicates it can fall to near zero, which would directly expose the sensitivity to misspecification.
If this is right
- AR(p)-FOCuS provides an exact online GLR test for mean changes under AR(p) noise, so practitioners no longer need to ignore autocorrelation or rely on approximate pre-whitening.
- The average O(log n) per-iteration cost makes the method practical for high-frequency data streams where a naive GLR computation would be infeasible.
- Simulations show that modelling the AR structure reduces detection delay substantially when autocorrelation is strong, while remaining competitive with IID-based methods when autocorrelation is weak.
- When AR parameters are estimated from a probation period, performance converges to the oracle version as the probation period grows, and over-specifying the AR order is safer than under-specifying it.
- On the telecommunications datasets, AR(p)-FOCuS detects more changepoints and achieves lower average delays than both IID FOCuS and pre-whitened FOCuS on commonly detected changes.
Where Pith is reading between the lines
- Inference: The recursion's separation of 'recent' and 'old' changes is a structural idea that could extend to other stationary noise models (e.g., ARMA) where the likelihood ratio has a similar finite-memory transient.
- Inference: Because the detection threshold is calibrated under a constant-mean AR(p) null, applying the method to streams with slow trends or non-AR dependence may inflate false positives; a model diagnostic or a more robust calibration (e.g., block bootstrap) would be a prudent extension.
- Inference: The logarithmic storage guarantee likely depends on the quadratic form of the Gaussian likelihood ratio; testing sub-Gaussian or heavy-tailed noise would reveal whether the pruning property is robust beyond the Gaussian case.
Editorial analysis
A structured set of objections, weighed in public.
Referee Report
Summary. The paper extends the FOCuS online changepoint-detection algorithm to observations whose noise follows an AR(p) process. The main methodological content is a recursion (Proposition 1) that expresses the generalized likelihood-ratio statistic for a change in mean under AR(p) noise as a maximum of a small set of quadratic functions, thus permitting functional pruning. An extension to unknown pre-change mean and a pruning rule for that case (Proposition 2) are also given, together with a Monte Carlo calibration procedure that accounts for AR parameter estimation from a probation period. Simulation studies compare the proposed AR(p)-FOCuS with IID FOCuS and with prewhitening-based FOCuS under various AR processes and probation lengths, and a real telecommunications dataset is analysed. The paper claims an average O(log n) per-iteration cost, based on the observed number of stored quadratics, and greater detection power than IID-based tests on autocorrelated data.
Significance. If the central claims hold, the paper is a practically useful extension of FOCuS: it gives a clean derivation of the GLR statistic for AR(p) noise, a functional pruning recursion that appears correct, an explicit treatment of unknown pre-change mean, and a threshold calibration procedure that propagates estimation uncertainty from the probation period. The inclusion of replication code and the honest discussion of estimation sensitivity (Sections 4.2, 6, and Appendix E.3) are strengths. However, the two headline claims—average O(log n) complexity and power gains on autocorrelated data—are currently supported only partially: the complexity result is empirical, and the power gains are conditional on correct or well-estimated AR(p) structure. The real-data application supplies no ground truth, so the reported detection-count improvements are not yet conclusive evidence of sensitivity.
major comments (3)
- [§4.1, Figure 3, and abstract]
- [§4.2 and Appendix E.3, Figure 16]
- [§5, Table 1]
minor comments (5)
- [Appendix B]
- [References and text]
- [Figure 3 caption and §4.1]
- [§3.1]
- [Appendix E.1, Figure 13 caption]
Circularity Check
No significant circularity: the AR(p)-FOCuS recursion is an algebraic identity for the GLR statistic, and the power/complexity claims are supported by independent simulations and published prior work.
full rationale
The paper's central derivation, Proposition 1 (Eqs. 3.3–3.4), is an exact algebraic recursion for the generalized likelihood-ratio statistic under AR(p) noise, proven in Appendix A directly from the definition of LR_{τ,n}(μ1) in Eq. 3.2. It does not fit any parameter and rename it as a prediction. AR parameters and thresholds are estimated on separate probation/calibration data (Section 3.2) and evaluated on independently simulated test data with 100 replications, so the reported gains in detection power are empirical results, not construction by definition. The O(log n) average-cost claim inherits the FOCuS pruning principle from Romano et al. (2023b), a published, peer-reviewed algorithm; it is not an unverified self-citation, and Figure 3 separately verifies the stored-curve count for AR(p) settings. The paper's own Sections 4.2.1 and E.3 (Figures 4 and 16) explicitly acknowledge that short probation periods or misspecified AR parameters can make AR(p)-FOCuS worse than plain FOCuS, which is an honest scope limitation rather than a hidden circular step. The abstract's broad 'autocorrelated data' wording is overgeneralized relative to these caveats, but that is a correctness/scope concern, not circularity.
Axiom & Free-Parameter Ledger
axioms (3)
- domain assumption Innovations ε_t are IID Gaussian with known variance (after standardisation).
- domain assumption The AR(p) process is stationary and the coefficients ρ_i and order p are known (or estimable from a probation period).
- ad hoc to paper The functional pruning ensures the number of retained quadratics is O(log n) in expectation for the AR(p) recursion.
read the original abstract
Changepoint detection methods have seen considerable development in recent years, with online algorithms capable of identifying structural changes in streaming data in near real time. However, the majority of existing methods are designed under the assumption of IID observations, rendering them susceptible to either more false positives or longer detection delays when applied to data exhibiting temporal dependence, a common feature of many real-world data streams. In this article, we extend the generalised likelihood-ratio (GLR) statistic to autoregressive processes of order $p$, and adapt the focus algorithm to develop a computationally efficient online change detector. The resulting AR($p$)-focus algorithm achieves an average computational cost of $\mathcal{O}(\log n)$ per iteration, making it suitable for high-frequency data streams. Through simulation studies, the proposed approach is seen achieving greater detection power than IID-based tests when the underlying data exhibit temporal correlation. We further illustrate the practical utility of AR($p$)-focus through an application to a real-world telecommunications dataset.
Figures






Reference graph
Works this paper leans on
-
[1]
Adams, R. P. and MacKay, D. J. C. (2007). Bayesian online changepoint detection
2007
-
[2]
and Ghysels, E
Andreou, E. and Ghysels, E. (2002). Detecting multiple breaks in financial market volatility dynamics. Journal of Applied Econometrics , 17(5):579--600
2002
-
[3]
and Kirch, C
Aue, A. and Kirch, C. (2024). The state of cumulative sum sequential changepoint testing 70 years after page. Biometrika , 111(2):367--391
2024
-
[4]
A., and Bardwell, L
Austin, E., Eckley, I. A., and Bardwell, L. (2024). Detection of emergent anomalous structure in functional data. Technometrics , 66(4):614--624
2024
-
[5]
and Nikiforov, I
Basseville, M. and Nikiforov, I. V. (1995). Detection of abrupt changes: theory and applications. Journal of the Royal Statistical Society-Series A Statistics in Society , 158(1):185
1995
-
[6]
and Killick, R
Beaulieu, C. and Killick, R. (2018). Distinguishing trends and shifts from memory in climate data. Journal of Climate , 31(23):9519--9543
2018
-
[7]
Chen, H. (2019). Sequential change-point detection based on nearest neighbors. The Annals of Statistics , 47(3):1381--1407
2019
-
[8]
Chen, Y., Wang, T., and Samworth, R. J. (2022). High-dimensional, multiscale online changepoint detection. Journal of the Royal Statistical Society Series B: Statistical Methodology , 84(1):234--266
2022
-
[9]
J., Hornik, K., and Kaun, C.-M
Chu, C.-S. J., Hornik, K., and Kaun, C.-M. (1995). MOSUM tests for parameter constancy. Biometrika , 82(3):603--617
1995
-
[10]
J., Stinchcombe, M., and White, H
Chu, C.-S. J., Stinchcombe, M., and White, H. (1996). Monitoring structural change. Econometrica: Journal of the Econometric Society , pages 1045--1065
1996
-
[11]
Crupi, R., Dilillo, G., Bissaldi, E., Ward, K., Fiore, F., and Vacchi, A. (2023). Searching for long faint astronomical high energy transients: a data driven approach. Experimental Astronomy , 56(2):421--476
2023
-
[12]
and Hackl, P
Eiauer, P. and Hackl, P. (1978). The use of MOSUMS for quality control. Technometrics , 20(4):431--436
1978
-
[13]
and Liu, Z
Fearnhead, P. and Liu, Z. (2007). On-line inference for multiple changepoint problems. Journal of the Royal Statistical Society Series B: Statistical Methodology , 69(4):589--605
2007
-
[14]
Gombay, E. (2008). Change detection in autoregressive time series. Journal of Multivariate Analysis , 99(3):451--464
2008
-
[15]
Guan, H., Bates, D., and Zhou, L. (2025). Keeping medical ai healthy and trustworthy: A review of detection and correction methods for system degradation. IEEE Transactions on Biomedical Engineering
2025
-
[16]
Z., Bhatti, U
Hasnain, A., Sheng, Y., Hashmi, M. Z., Bhatti, U. A., Hussain, A., Hameed, M., Marjan, S., Bazai, S. U., Hossain, M. A., Sahabuddin, M., et al. (2022). Time series analysis and forecasting of air pollutants based on prophet forecasting model in Jiangsu province, China . Frontiers in Environmental Science , 10:945628
2022
-
[17]
Henry, D., Simani, S., and Patton, R. J. (2010). Fault detection and diagnosis for aeronautic and aerospace missions. In Fault tolerant flight control: A benchmark challenge , pages 91--128. Springer
2010
-
[18]
Hipel, K. W. and McLeod, A. I. (1994). Time series modelling of water resources and environmental systems , volume 45. Elsevier
1994
-
[19]
R., Stevens, N
Jeske, D. R., Stevens, N. T., Tartakovsky, A. G., and Wilson, J. D. (2018). Statistical methods for network surveillance. Applied Stochastic Models in Business and Industry , 34(4):425--445
2018
-
[20]
and Weber, S
Kirch, C. and Weber, S. (2018). Modified sequential change point procedures based on estimating functions. Electronic Journal of Statistics , 12:1579--1613
2018
-
[21]
Lai, T. L. (1995a). Sequential changepoint detection in quality control and dynamical systems. Journal of the Royal Statistical Society: Series B (Methodological) , 57(4):613--644
-
[22]
Lai, T. L. (1995b). Sequential changepoint detection in quality control and dynamical systems. Journal of the Royal Statistical Society: Series B (Methodological) , 57(4):613--644
-
[23]
Lai, T. L. and Xing, H. (2010). Sequential change-point detection when the pre-and post-change parameters are unknown. Sequential Analysis , 29(2):162--175
2010
-
[24]
Liehrmann, A., Delannoy, E., Launay-Avon, A., Gilbault, E., Loudet, O., Castandet, B., and Rigaill, G. (2023). Diffsegr: an rna-seq data driven method for differential expression analysis using changepoint detection. NAR Genomics and Bioinformatics , 5(4):lqad098
2023
-
[25]
Lorden, G. (1971). Procedures for reacting to a change in distribution. The Annals of Mathematical Statistics , pages 1897--1908
1971
-
[26]
Page, E. S. (1954). Continuous inspection schemes. Biometrika , 41(1/2):100--115
1954
-
[27]
Page, E. S. (1955). A test for a change in a parameter occurring at an unknown point. Biometrika , 42(3/4):523--527
1955
-
[28]
Pishchagina, L., Romano, G., Fearnhead, P., Runge, V., and Rigaill, G. (2026). Online multivariate changepoint detection: Leveraging links with computational geometry. Journal of the Royal Statistical Society Series B: Statistical Methodology , 88(1):171--194
2026
-
[29]
and Stavrakakis, G
Pouliezos, A. and Stavrakakis, G. S. (2013). Real time fault monitoring of industrial processes , volume 12. Springer Science & Business Media
2013
-
[30]
A., and Fearnhead, P
Romano, G., Eckley, I. A., and Fearnhead, P. (2023a). A log-linear nonparametric online changepoint detection algorithm based on functional pruning. IEEE Transactions on Signal Processing , 72:594--606
-
[31]
A., Fearnhead, P., and Rigaill, G
Romano, G., Eckley, I. A., Fearnhead, P., and Rigaill, G. (2023b). Fast online changepoint detection via functional pruning CUSUM statistics. Journal of Machine Learning Research , 24(81):1--36
-
[32]
Romano, G., Rigaill, G., Runge, V., and Fearnhead, P. (2022). Detecting abrupt changes in the presence of local fluctuations and autocorrelated noise. Journal of the American Statistical Association , 117(540):2147--2162
2022
-
[33]
and Venkatraman, E
Siegmund, D. and Venkatraman, E. S. (1995). Using the generalized likelihood ratio statistic for sequential detection of a change-point. The Annals of Statistics , 23(1):255--271
1995
-
[34]
G., Rozovskii, B
Tartakovsky, A. G., Rozovskii, B. L., and Shah, K. (2005). A nonparametric multichart cusum test for rapid intrusion detection. In Proceedings of Joint Statistical Meetings , volume 7, page 11
2005
-
[35]
Tsay, R. S. (2005). Analysis of financial time series . John Wiley & Sons
2005
-
[36]
Ward, K., Dilillo, G., Eckley, I., and Fearnhead, P. (2025). Poisson-focus: An efficient online method for detecting count bursts with application to gamma ray burst detection. Journal of the American Statistical Association , 120(549):7--19
2025
-
[37]
Ward, K., Romano, G., Eckley, I., and Fearnhead, P. (2024). A constant-per-iteration likelihood ratio test for online changepoint detection for exponential family models. Statistics and Computing , 34(3):99
2024
-
[38]
and Fridlyand, J
Willenbrock, H. and Fridlyand, J. (2005). A comparison study: applying segmentation to array cgh data for downstream analyses. Bioinformatics , 21(22):4084--4091
2005
-
[39]
A., and Fearnhead, P
Yang, Z., Eckley, I. A., and Fearnhead, P. (2024). A communication-efficient, online changepoint detection method for monitoring distributed sensor networks. Statistics and Computing , 34(3):115
2024
-
[40]
Yu, Y., Padilla, O. H. M., Wang, D., and Rinaldo, A. (2023). A note on online change point detection. Sequential Analysis , 42(4):438--471
2023
-
[41]
Zaliskyi, M., Ostroumov, I., Kuzmenko, N., and Ivannikova, V. (2025). Algorithms of reliability data processing for navigation systems. In 2025 Integrated Communications, Navigation and Surveillance Conference (ICNS) , pages 1--9. IEEE
2025
discussion (0)
Sign in with ORCID, Apple, or X to comment. Anyone can read and Pith papers without signing in.