REVIEW 5 major objections 4 minor 2 cited by
Southern massive stars at high angular resolution. Physical separations and mass ratios
T0 review · 5 major / 4 minor · reviewed 2026-08-04 · deepseek-v4-flash
Pith's one-line read Massive-star binaries beyond roughly 1000 AU are deficient in near-equal-mass companions, with an upper mass-ratio limit that declines toward larger separations.
desk verdict Solid conversion of smash+ to physical units with a robust qualitative result—no equal-mass companions beyond ~100 AU—but the abstract's kappa-trend claim and the by-eye qcrit envelope overreach their uncertainties. read the letter →
The pith
A machine-rendered reading of the paper's core claim, the machinery that carries it, and where it could break.
The reading
What carries the argument
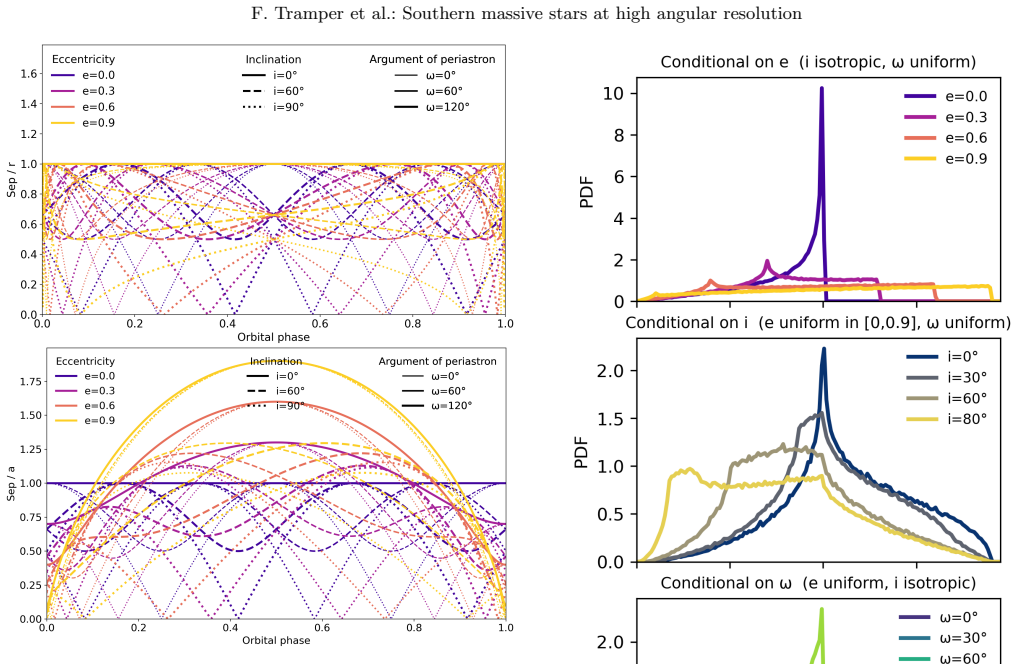
The analysis runs on two coupled tools. First, a spectrophotometric calibration uses existing grids of O-star parameters (absolute magnitudes, bolometric corrections, mass–luminosity relations) to turn spectral type, luminosity class, and H-band photometry into distances, primary masses, and companion masses, with companions assumed to be main-sequence dwarfs unless that would give a mass ratio above unity. Second, Monte Carlo detection maps simulate 10,000 mock observations of the survey, drawing companions with uniformly distributed mass ratios and orbital configurations (eccentricities uniform between 0 and 0.9, random 3D orientations), and comparing predicted magnitude contrasts and proj
What would settle it
A targeted follow-up of the widest pairs (Sep > 1000 AU, q < 0.7) measuring radial velocities or proper motions would test whether they are physically bound; if a large fraction are chance alignments, the mass-ratio envelope is not a property of binaries. Conversely, a deeper survey reaching q < 0.5 at 10^4 AU would test whether the declining upper mass ratio is a real limit or a sensitivity effect.
Extended reading notes
Core claim
Within the sensitivity limits of smash+, the detection probability for companions is very uniform across projected separations of roughly 1 to 10^4 AU and mass ratios down to about 0.2, with the one exception near 500 AU where two instruments overlap. The paper therefore treats the observed sample as directly representative of the underlying population in that window. It derives projected separations that follow a flat power law in log-separation, and mass ratios following f_q ∝ q^κ with κ decreasing from values compatible with spectroscopic-binary results inside ~100 AU (κ ≈ −0.6, consistent both with roughly flat distributions and with a steeper slope suggested in earlier work) to a clear
Load-bearing premise
The whole conclusion hangs on the assumption that every detected pair within the survey's field is a real binary and that companions are main-sequence dwarfs on orbits with a uniform spread of eccentricities; if chance alignments or evolved companions are common, the completeness and the mass-ratio envelope would shift.
Editorial extensions
If this is right
- The observed smash+ sample needs no completeness corrections for binaries with 1 < log(a/AU) < 4 and q > 0.2, so its separation and mass-ratio statistics are the population's statistics.
- The separation distribution being log-uniform implies a roughly constant number of companions per decade of separation in the intermediate regime, bridging the spectroscopic and wide-imaging domains.
- The mass-ratio power-law index κ decreases with separation, meaning wide companions are progressively more skewed toward low masses relative to their primaries.
- Beyond ~1000 AU, mass ratios above ~0.7 are rare, and beyond 10^4 AU none above ~0.5 are found, defining an avoidance zone in the q–Sep plane.
- The calibration can be paired with independent distances to flag stars whose photometry signals a different evolutionary history, such as merger or mass-transfer products.
Reading between the lines
- A natural extension not explored in the paper: use the same detection maps to invert the observed q–Sep plane into formation constraints — if the dwarf and eccentricity priors are right, the declining q_max points to wide binaries forming as largely independent draws of mass rather than fragmenting into correlated pairs.
- The empirical envelope q_crit ≈ 1 − 0.2 log10(Sep/100 AU) should be testable in other massive-star populations, e.g. B-type stars or extragalactic OB associations; a steeper or absent envelope would indicate environment-dependent formation.
- Because chance alignments were not statistically subtracted for the widest pairs, re-observing the claimed wide companions with astrometry or radial velocities would separate true binaries from field stars; a large contamination fraction would lower the wide-pair statistics but leave the mass-ratio ceiling as an upper limit.
Editorial analysis
A structured set of objections, weighed in public.
Referee Report
Summary. This paper converts the high-angular-resolution smash+ observations of southern O stars into physical units. It constructs an H-band absolute-magnitude/bolometric-correction/mass calibration from Martins & Plez (2006) and Brott et al. (2011), derives spectrophotometric distances and primary/companion masses, and validates these against cluster distances, ALS III/Gaia distances, and dynamical masses. It then computes Monte Carlo detection maps to quantify completeness. The main results are that the survey is nearly complete for 1<log(a/AU)<4 and q>0.2, that projected separations follow an Oepik-like log-uniform distribution, that mass ratios follow f_q∝q^κ with κ≈−0.6 within 100 AU and decreasing beyond 1000 AU, and that there is a deficit of near-equal-mass companions at >100 AU, quantified by an upper limit qcrit≈1−0.2[log10(Sep/AU)−2].
Significance. If these results hold, they fill the observational gap between spectroscopic and wide visual binaries for massive stars and provide important constraints on binary formation and evolution. The paper is careful in its calibration and validation: the appendices give explicit polynomial coefficients, the distances are checked against cluster and ALS III/Gaia values, and primary masses are checked against dynamical masses. The Monte Carlo completeness treatment is also clearly described. However, the most novel claim—the declining upper mass-ratio envelope—depends on model assumptions and censored upper limits that need to be tested quantitatively.
major comments (5)
- [§2.2.2 and Figs. 13–14, Eq. (6)] The headline upper mass-ratio envelope is entangled with the companion-mass assumption. When the dwarf assumption yields q>1, the companion is assigned the least evolved luminosity class that gives q<1, and the mass is reported as an upper limit. Thus the near-unity points beyond 100 AU in Figs. 13–14 are not independent measurements; they are censored by construction. Eq. (6) is then fitted by eye to this censored envelope. Please show the q–Sep diagram with the uncensored dwarf-assumption values and with an alternative evolved-companion calibration, and quantify how the location and slope of Eq. (6) change. Without this, the claimed avoidance zone is not distinguishable from a modeling artifact.
- [§3.2, Fig. 9 and §2.2.2] The 'near-complete' claim rests on Monte Carlo maps that assume all companions are main-sequence dwarfs, the same assumption used to convert ΔH to q. The completeness maps therefore do not test the hypothesis that a substantial fraction of wide companions are evolved; if evolved companions are brighter at fixed mass, both the detection probability and the derived q change. Please compute detection maps with alternative companion luminosity-class distributions (e.g., drawn from the primary LC distribution) and report the completeness at q>0.5 and a>1000 AU. This is load-bearing because the paper uses the uniformity of the maps to justify skipping bias corrections.
- [§4.2, Fig. 11] The decrease of the mass-ratio power-law index with separation is based on N=44 (Sep<100 AU) and N=27 (Sep>1000 AU). The reported 95% intervals (κ<100 = −0.6^{+0.9}_{−0.7}; κ>1000 ≈ −1.6 with lower bound ≈ −2.8) overlap substantially. A formal test of the difference between the two κ values, or a joint fit with log(Sep) as a covariate, is required before claiming a decrease. Similarly, Eq. (6) is a by-eye envelope without uncertainties; it should be fitted with a defined method (e.g., treating upper limits as censored) and its slope tested against zero.
- [Table F.1 and §2.2.2] The upper-limit rule is not reflected in the catalog: Table F.1 contains multiple mass ratios q>1 (e.g., HD 113904 B-A q≈161; HD 167971 Aa-Ab q≈1.86; HD 93161A A-C q≈1.49) and no upper-limit flag. This contradicts the statement in §4.3 that no companions with q>0.8 exist beyond 100 AU except those with upper limits, or the table entries are exceptions that need documentation. Please enforce the rule consistently, add flags, or explain why these entries bypass it; the mass-ratio distributions and figures are not reproducible without this.
- [§4, Figs. 10–14] All detected pairs within 8'' are treated as physical, with no assessment of chance-alignment contamination. At the mean distance of ~2 kpc, 8'' corresponds to ~1.6×10^4 AU; the widest bins, including the N=27 sample beyond 1000 AU, are the most likely to be contaminated by background/foreground stars. A few unrelated faint stars would steepen the apparent wide-separation κ and would not be identifiable in these plots. Please estimate the expected number of chance alignments (e.g., using a Galactic model or Gaia proper motions) and show the results with and without the widest, unverified pairs.
minor comments (4)
- [§2.1.2, Eq. (1)] The text states the systematic distance offset is about 5%, but Eq. (1) gives d_H = −122.3 + 1.19 d_Gaia, which at the mean distance of 1915 pc implies an overestimate of roughly 12%. Please reconcile the stated percentage with the fitted relation.
- [§5 and throughout] There are several typos: 'acrement' should be 'agreement', 'teh' should be 'the', 'independant' should be 'independent', 'polynamial' should be 'polynomial', and 'seperation' should be 'separation'. In §3.1, 'the -semi major axis' has a stray hyphen.
- [Fig. 11] The κ values and confidence intervals are difficult to read from the figure; please print the fitted value and 95% intervals in the caption or in the text for each panel.
- [§5] The phrase 'we have converted the smash+of Paper I into physical units' is missing a word; it should read 'the smash+ observations of Paper I'.
Circularity Check
No significant circularity: the conversion to physical units, completeness maps, and empirical q-Sep envelope rest on external calibrations and observational data, with at most a mild consistency loop in the dwarf-companion assumption.
full rationale
The paper's conversion chain is not definitionally circular. Distances are derived from an absolute-magnitude calibration anchored to Martins & Plez (2006) and are externally checked against cluster distances and ALSIII-Gaia distances (Sect. 2.1.2, Figs. 3-4). Primary masses come from Martins et al. (2005) and Brott et al. (2011) and are validated against dynamical masses in Table 1 and Fig. 5. Companion masses use the same external dwarf mass-luminosity relation, with the explicit caveat that a dwarf assumption is adopted and that bright companions near evolved primaries are assigned upper limits (Sect. 2.2.2). The detection probability maps (Sect. 3.2) are a Monte-Carlo sensitivity model, not a fit to the target distributions; they reuse the dwarf assumption and the adopted primary masses, which creates a consistency loop but does not make the observed separation or mass-ratio distributions equal to the model by construction. The claimed near-completeness is an inference from the maps, conditional on stated orbital assumptions. The qcrit envelope (Eq. 6) is an explicitly tentative by-eye fit to the same data it describes, but it is presented as a description of the data, not as an independent prediction. The documented ~5% distance offset is explicitly shown not to affect log(Sep) (Delta log Sep ~ 0.02) and would shift primary and companion masses in the same direction. No uniqueness theorem, ansatz-smuggling citation, or renaming of a known result carries the argument. The mild reuse of the dwarf assumption across mass derivation and detection completeness is a modeling limitation, not a circular reduction.
Assumptions & free parameters
free parameters (6)
- Polynomial coefficients for M_K as function of LC and SpT (Tables A.1 and A.2) =
Numerous, e.g., LC V SpT relation: a=-0.00096, b=0.29395, c=-5.85071
- Polynomial coefficients for BC_H (Tables D.1, D.2, D.3) =
Numerous, e.g., LC V: a=0.0584, b=1.0719, c=-0.8398 for BC_H(M_H)
- Mass-luminosity exponent fit coefficients (Table E.1) =
Brott ZAMS: a=-2.449e-4, b=-3.502e-3, c=3.050e-2, d=-0.211, e=4.331
- (H-K)_0 color =
-0.10 mag
- Total-to-selective extinction R_V =
3.1
- qcrit envelope slope and normalization (Eq. 6) =
qcrit approximately 1 - 0.2 * (log10(Sep/AU) - 2)
assumptions (6)
- domain assumption Martins and Plez 2006 absolute K-band magnitudes and the adopted (H-K)_0 are valid for all O stars in the sample.
- domain assumption The mass-luminosity relations from Martins et al. 2005 and Brott et al. 2011 correctly give masses for O primaries and dwarf companions.
- domain assumption Detected companions are predominantly main-sequence dwarfs.
- domain assumption Orbital orientations are random in 3D and eccentricities are uniformly distributed between 0 and 0.9.
- standard math The Keplerian projection equations in Section 3.1 relate instantaneous projected separation to semi-major axis.
- domain assumption All detected pairs within 8 arcseconds are physically associated rather than chance projections.
Cite this review
Pith. "Pith review of Southern massive stars at high angular resolution. Physical separations and mass ratios." pith.science (2026). https://pith.science/paper/NUO3FM22
@misc{pith2026250918431,
  author       = {Pith},
  title        = {Pith review of: Southern massive stars at high angular resolution. Physical separations and mass ratios},
  year         = {2026},
  howpublished = {\url{https://pith.science/paper/NUO3FM22}},
  note         = {Machine review of arXiv:2509.18431}
}
abstract
Context. A key property of massive stars is their high degree of multiplicity, which can impact their evolution and end-of-life products. The Southern Massive Stars at High Angular Resolution survey (smash+) use interferometric and high-angular resolution techniques to detect companions at intermediate separations, from about 1 milli-arsec to 8$\arcsec$, a domain that so far has remained largely unexplored. Aims. In this paper, we convert the angular separations and magnitude contrasts into physical units, i.e. projected physical separations and mass ratios. We also derive the sensitivity of the survey for various physical and orbital parameters and we investigate the orbital separation and mass distributions. Methods. We develop a spectral type/luminosity class - H-band luminosity - mass calibration based on existing grids of physical parameters of O stars and we use these to obtain the photometric distance to each system. We also derive the individual masses of the primaries and of each detected companion. Results. The probability of detecting companions is very uniform within the sensitivity limits of the smash+ survey, which can be considered near-complete for binaries with 1 $<$ log(a/AU ) $<$ 4 and q = M2/M1 $>$ 0.2. The projected separations follow a uniform distribution in log-separation. The mass ratios follow a power-law distribution $f_q \propto q^{\kappa}$ with $\kappa$ values that decrease towards larger separation. For resolved companions within 100 AU, we find $\kappa_{<100} = -0.6^{+0.9}_{-0.7}$ which is both compatible with the power-law distributions derived for spectroscopic binaries ($\kappa \sim 0$) and that proposed in an earlier study by Moe \& Di Stefano ($\kappa = -1.4 \pm 0.4$). Beyond $\sim$1000 AU, we observe a clear lack of (near)equal-mass companions, with an upper mass-ratio limit declining towards larger separations.
Figures


Figures from the paper (8 more)



Forward citations
Cited by 2 Pith papers
-
Southern Massive Stars at High Angular Resolution (SMaSH+): Properties of hierarchical massive triples
SMaSH+ survey data yields the first observationally grounded distributions of key parameters for 26 hierarchical massive triples, dominated by tight inner binaries and wider tertiaries with no strong mass-separation c...
-
Star cluster formation from turbulent clumps. V. Stellar clustering around massive stars
N-body simulations show massive stars in TCCA clusters rapidly acquire triple or higher multiples and local density enhancements via dynamics, with multiplicity trends and shallower N_* profiles than competitive accre...
Reference graph
Works this paper leans on
-
[1]
, " * write output.state after.block = add.period write newline
ENTRY address author booktitle chapter edition editor howpublished institution journal key month note number organization pages publisher school series title type volume year label extra.label sort.label short.list INTEGERS output.state before.all mid.sentence after.sentence after.block FUNCTION init.state.consts #0 'before.all := #1 'mid.sentence := #2 '...
-
[2]
write newline
" write newline "" before.all 'output.state := FUNCTION n.dashify 't := "" t empty not t #1 #1 substring "-" = t #1 #2 substring "--" = not "--" * t #2 global.max substring 't := t #1 #1 substring "-" = "-" * t #2 global.max substring 't := while if t #1 #1 substring * t #2 global.max substring 't := if while FUNCTION word.in bbl.in " " * FUNCTION format....
-
[3]
M., Lim , P
Astropy Collaboration , Price-Whelan , A. M., Lim , P. L., et al. 2022, , 935, 167
2022
-
[4]
M., Sip o cz , B
Astropy Collaboration , Price-Whelan , A. M., Sip o cz , B. M., et al. 2018, , 156, 123
2018
-
[5]
P., Tollerud , E
Astropy Collaboration , Robitaille , T. P., Tollerud , E. J., et al. 2013, , 558, A33
2013
-
[6]
2022, , 658, A69
Banyard , G., Sana , H., Mahy , L., et al. 2022, , 658, A69
2022
-
[7]
E., Cantiello , M., et al
Brott , I., de Mink , S. E., Cantiello , M., et al. 2011, , 530, A115
2011
-
[8]
R., Dufton , P
Dunstall , P. R., Dufton , P. L., Sana , H., et al. 2015, , 580, A93
2015
Show all 54 references
-
[9]
2012, , 537, A146
Ekstr \"o m , S., Georgy , C., Eggenberger , P., et al. 2012, , 537, A146
2012
-
[10]
& Rix , H.-W
El-Badry , K. & Rix , H.-W. 2019, , 482, L139
2019
-
[11]
2019, , 489, 5822
El-Badry , K., Rix , H.-W., Tian , H., Duch \^e ne , G., & Moe , M. 2019, , 489, 5822
2019
-
[12]
2013, , 433, 1300
Ferrero , G., Gamen , R., Benvenuto , O., & Fern \'a ndez-Laj \'u s , E. 2013, , 433, 1300
2013
-
[13]
Fitzpatrick , E. L. 1999, , 111, 63
1999
-
[14]
J., Sana , H., Le Bouquin , J
Frost , A. J., Sana , H., Le Bouquin , J. B., et al. 2025, , 701, A171
2025
-
[15]
J., Sana , H., Mahy , L., et al
Frost , A. J., Sana , H., Mahy , L., et al. 2024, Science, 384, 214
2024
-
[16]
2017, ArXiv e-prints
Johnston , C., Buysschaert , B., Tkachenko , A., Aerts , C., & Neiner , C. 2017, ArXiv e-prints
2017
-
[17]
V., Piskunov , A
Kharchenko , N. V., Piskunov , A. E., R \"o ser , S., Schilbach , E., & Scholz , R.-D. 2005, , 438, 1163
2005
-
[18]
Kiminki , M. M. & Smith , N. 2018, , 477, 2068
2018
-
[19]
A., Kiminki , D
Kobulnicky , H. A., Kiminki , D. C., Lundquist , M. J., et al. 2014, , 213, 34
2014
-
[20]
2011, The Messenger, 146, 18
Lacour , S., Tuthill , P., Ireland , M., Amico , P., & Girard , J. 2011, The Messenger, 146, 18
2011
-
[21]
2012, , 50, 107
Langer , N. 2012, , 50, 107
2012
-
[22]
2011, , 535, A67
Le Bouquin , J.-B., Berger , J.-P., Lazareff , B., et al. 2011, , 535, A67
2011
-
[23]
2008, , 489, 713
Linder , N., Rauw , G., Martins , F., et al. 2008, , 489, 713
2008
-
[24]
2017, ArXiv e-prints
Mahy , L., Damerdji , Y., Gosset , E., et al. 2017, ArXiv e-prints
2017
-
[25]
2010, , 708, 1537
Mahy , L., Rauw , G., Martins , F., et al. 2010, , 708, 1537
2010
-
[26]
H., Sim \'o n-D \' az , S., et al
Ma \' z Apell \'a niz , J., Barb \'a , R. H., Sim \'o n-D \' az , S., et al. 2018, , 615, A161
2018
-
[27]
2019, , 626, A20
Ma \' z Apell \'a niz , J., Trigueros P \'a ez , E., Negueruela , I., et al. 2019, , 626, A20
2019
-
[28]
& Plez , B
Martins , F. & Plez , B. 2006, , 457, 637
2006
-
[29]
Martins , F., Schaerer , D., & Hillier , D. J. 2005, , 436, 1049
2005
-
[30]
D., Gies , D
Mason , B. D., Gies , D. R., Hartkopf , W. I., et al. 1998, , 115, 821
1998
-
[31]
D., Hartkopf , W
Mason , B. D., Hartkopf , W. I., Gies , D. R., Henry , T. J., & Helsel , J. W. 2009, , 137, 3358
2009
-
[32]
Mel'Nik , A. M. & Dambis , A. K. 2009, , 400, 518
2009
-
[33]
& Di Stefano , R
Moe , M. & Di Stefano , R. 2017, , 230, 15
2017
-
[34]
I., Barb \'a , R
Morrell , N. I., Barb \'a , R. H., Niemela , V. S., et al. 2001, , 326, 85
2001
-
[35]
2014, , 568, A94
Nasseri , A., Chini , R., Harmanec , P., et al. 2014, , 568, A94
2014
-
[36]
1924, Tartu Obs
\"O pik , E. 1924, Tartu Obs. Publ, 26
1924
-
[37]
2025, , submitted
Pantaleoni, G., Maíz Apellániz, J., et al. 2025, , submitted
2025
-
[38]
2024, , 168, 209
Pauwels , T., Reggiani , M., Sana , H., & Mahy , L. 2024, , 168, 209
2024
-
[39]
R., Epps , J
Penny , L. R., Epps , J. G., & Snyder , J. D. 2016, , 832, 211
2016
-
[40]
R., Gies , D
Penny , L. R., Gies , D. R., Wise , J. H., Stickland , D. J., & Lloyd , C. 2002, , 575, 1050
2002
-
[41]
R., Ouzts , C., & Gies , D
Penny , L. R., Ouzts , C., & Gies , D. R. 2008, , 681, 554
2008
-
[42]
R., Seyle , D., Gies , D
Penny , L. R., Seyle , D., Gies , D. R., et al. 2001, , 548, 889
2001
-
[43]
Perets , H. B. 2025, arXiv e-prints, arXiv:2504.02939
2025 arXiv
-
[44]
2022, , 658, A198
Rainot , A., Reggiani , M., Sana , H., Bodensteiner , J., & Absil , O. 2022, , 658, A198
2022
-
[45]
2016, , 594, A33
Rauw , G., Rosu , S., Noels , A., et al. 2016, , 594, A33
2016
-
[46]
E., de Koter , A., et al
Sana , H., de Mink , S. E., de Koter , A., et al. 2012, Science, 337, 444
2012
-
[47]
& Evans , C
Sana , H. & Evans , C. J. 2011, in IAU Symposium, Vol. 272, Active OB Stars: Structure, Evolution, Mass Loss, and Critical Limits, ed. C. Neiner , G. Wade , G. Meynet , & G. Peters , 474--485
2011
-
[48]
2011, , 416, 817
Sana , H., James , G., & Gosset , E. 2011, , 416, 817
2011
-
[49]
2014, , 215, 15
Sana , H., Le Bouquin , J.-B., Lacour , S., et al. 2014, , 215, 15
2014
-
[50]
2013, , 553, A131
Sana , H., Le Bouquin , J.-B., Mahy , L., et al. 2013, , 553, A131
2013
-
[51]
2001, , 370, 121
Sana , H., Rauw , G., & Gosset , E. 2001, , 370, 121
2001
-
[52]
I., Sana , H., Mahy , L., et al
Villase \ n or , J. I., Sana , H., Mahy , L., et al. 2025, , 698, A41
2025
-
[53]
I., Taylor , W
Villase \ n or , J. I., Taylor , W. D., Evans , C. J., et al. 2021, , 507, 5348
2021
-
[54]
White , R. J. & Ghez , A. M. 2001, , 556, 265
2001
Reviewed August 4, 2026 · model on record in the stance chip above.
Discussion (0). Sign in to comment.