Enhancing Graph Neural Networks Using Proximity Graphs for Dust Source Emission Forecasting
Pith reviewed 2026-06-26 18:08 UTC · model grok-4.3
The pith
Proximity graphs let GNNs outperform random graphs and LSTM models when forecasting dust source emissions.
A machine-rendered reading of the paper's core claim, the machinery that carries it, and where it could break.
Core claim
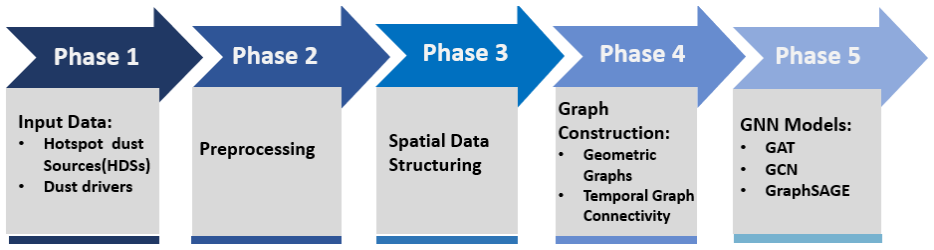
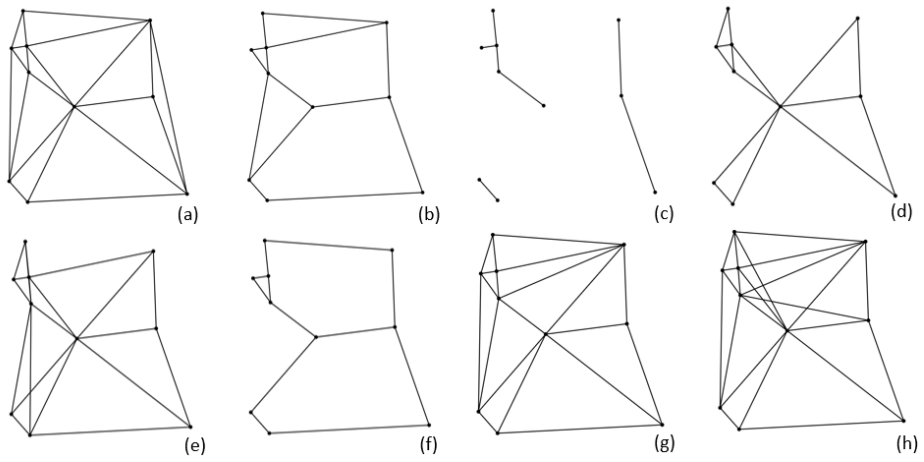
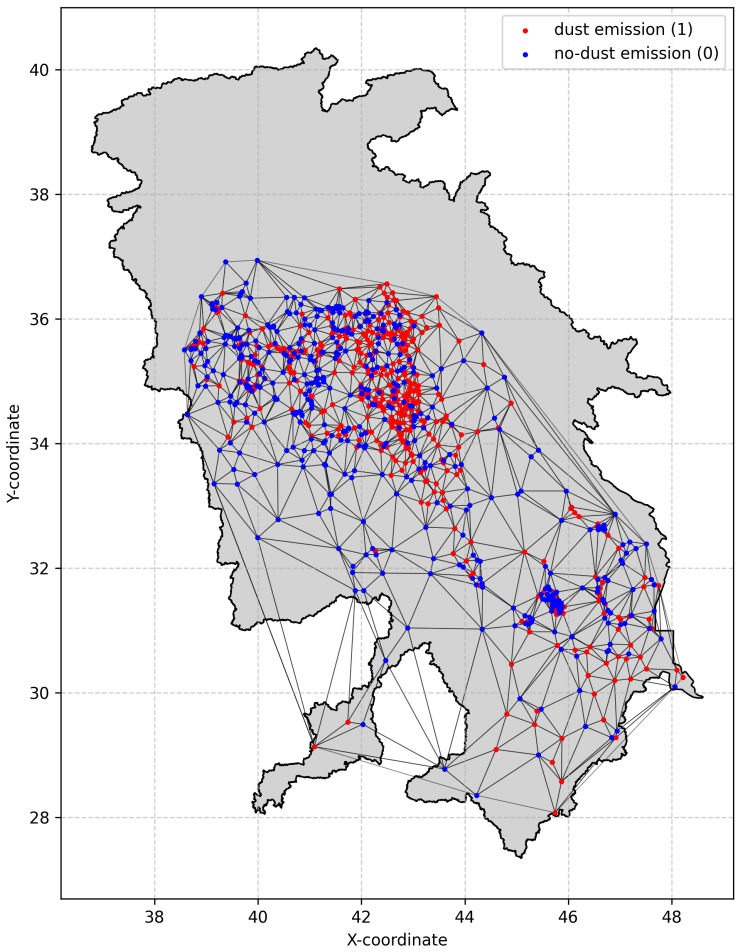
Proximity graphs such as Delaunay triangulation, Gabriel graph, k-Nearest Neighbor graph, and Yao graph, when used as the structure for message passing in GraphSAGE, Graph Convolutional Networks, and Graph Attention Networks, enable substantially more accurate dust source emission forecasts than the same GNN architectures run on random graphs or than LSTM models.
What carries the argument
Proximity graphs (Delaunay triangulation, Gabriel graph, k-Nearest Neighbor graph, Yao graph) that connect data points according to spatial proximity rules and serve as the fixed topology for GNN message passing.
If this is right
- GNNs paired with proximity graphs produce lower forecast error than LSTM baselines on the dust emission task.
- Random graphs as input to the same GNNs yield markedly worse results, isolating the contribution of the proximity structure.
- Multiple proximity-graph constructions (Delaunay, Gabriel, kNN, Yao) all improve performance relative to random graphs.
- The same GNN variants benefit from the proximity structure, indicating the gain is not limited to one message-passing scheme.
Where Pith is reading between the lines
- The same proximity-graph construction could be tested on other spatiotemporal forecasting problems where location data are available.
- If proximity graphs reduce the need for hand-crafted spatial features, they might simplify model pipelines in related environmental prediction tasks.
- A controlled study that varies the density or type of proximity edges while holding the GNN fixed would clarify which geometric properties drive the observed gains.
Load-bearing premise
Proximity graphs built from the dust emission data points capture the relevant spatial and temporal relationships more effectively than random connections.
What would settle it
An experiment that trains identical GNN architectures on the same dust dataset once with proximity graphs and once with random graphs and finds no statistically significant difference in forecast error would falsify the central claim.
Figures
read the original abstract
Accurate prediction of dust source emissions is critical for mitigating the significant environmental and health hazards posed by dust storms. Traditional forecasting methods often struggle to capture the complex spatiotemporal dynamics of these phenomena. In this paper, we demonstrate that proximity graphs enable Graph Neural Networks (GNNs) to effectively model the intricate spatial and temporal relationships between data points. Specifically, we use proximity graphs--such as Delaunay triangulation, Gabriel graph, k-Nearest Neighbor graph, and Yao graph--as the input for GNNs (including GraphSAGE, Graph Convolutional Networks, and Graph Attention Networks) to perform message passing. Our approach highlights the effectiveness of integrating proximity graphs with GNNs for robust and accurate dust source forecasting. To emphasize the importance of proximity graph representations, we compare our method against GNNs using random graphs for message passing. The results show that GNNs with proximity graphs significantly outperform those with random graphs and are also far superior to Long Short-Term Memory (LSTM) model in dust source emission forecasting.
Editorial analysis
A structured set of objections, weighed in public.
Referee Report
Summary. The manuscript claims that proximity graphs (Delaunay triangulation, Gabriel graph, k-NN, Yao graph) used as input structures for GNNs (GraphSAGE, GCN, GAT) enable effective modeling of spatial and temporal relationships in dust source emission data, yielding significant outperformance over GNNs with random graphs and over LSTM baselines.
Significance. If the central empirical claim holds after addressing baseline controls, the work would demonstrate a practical benefit of geometry-aware graph constructions for spatiotemporal forecasting in environmental applications. The exploration of multiple proximity graph families alongside standard GNN variants is a positive aspect of the experimental design.
major comments (2)
- [Abstract] Abstract: the claim that GNNs with proximity graphs 'significantly outperform' those with random graphs supplies no metrics, dataset description, validation procedure, or error analysis, rendering the headline result unverifiable.
- [Abstract] Abstract: the random-graph baseline is not stated to be matched to the proximity graphs on average degree, edge count, or connectivity statistics. Without explicit degree or edge-count parity (e.g., via configuration model), performance differences cannot be isolated to the proximity property rather than incidental graph-density effects.
Simulated Author's Rebuttal
We thank the referee for the constructive feedback on our manuscript. The comments highlight important issues of verifiability and baseline rigor in the abstract, which we address below. We will incorporate revisions to strengthen the presentation of our results.
read point-by-point responses
-
Referee: [Abstract] Abstract: the claim that GNNs with proximity graphs 'significantly outperform' those with random graphs supplies no metrics, dataset description, validation procedure, or error analysis, rendering the headline result unverifiable.
Authors: We agree that the abstract would benefit from greater specificity to support the performance claims. In the revised version we will add quantitative metrics (e.g., percentage reductions in RMSE or MAE), a concise dataset description, and a statement of the validation procedure (e.g., temporal cross-validation) so that the headline result is verifiable directly from the abstract. revision: yes
-
Referee: [Abstract] Abstract: the random-graph baseline is not stated to be matched to the proximity graphs on average degree, edge count, or connectivity statistics. Without explicit degree or edge-count parity (e.g., via configuration model), performance differences cannot be isolated to the proximity property rather than incidental graph-density effects.
Authors: We acknowledge the concern. Although the full experimental section constructs random graphs with edge counts and average degrees matched to each proximity graph family, this matching is not explicitly stated in the abstract. We will revise both the abstract and the methods/experiments sections to clearly describe the degree- and edge-count parity (via configuration-model sampling) so that the performance gap can be attributed to the proximity property. revision: yes
Circularity Check
Empirical benchmark comparison; no derivation reduces to inputs
full rationale
The paper reports an empirical comparison of GNN variants (GraphSAGE, GCN, GAT) on proximity graphs (Delaunay, Gabriel, k-NN, Yao) versus random graphs and LSTM baselines for dust emission forecasting. The abstract states the superiority is shown by direct performance measurement on the dataset, providing an external benchmark. No equations, fitted parameters, predictions of related quantities, or self-citation chains are present in the provided text that would make the central claim equivalent to its inputs by construction. The result is statistically falsifiable on held-out data and does not rely on renaming or self-definition.
Axiom & Free-Parameter Ledger
Reference graph
Works this paper leans on
-
[1]
N. J. Middleton, Desert dust hazards: A global review, Aeolian research 24 (2017) 53–63
2017
-
[2]
G. S. Okin, A. R. Baker, I. Tegen, N. M. Mahowald, F. J. Dentener, R. A. Duce, J. N. Galloway, K. Hunter, M. Kanakidou, N. Kubilay, et al., Impacts of atmospheric nutrient deposition on marine productivity: Roles of nitrogen, phosphorus, and iron, Global Biogeochemical Cycles 25 (2) (2011)
2011
-
[3]
M. H. R. Moghaddam, A. Sedighi, S. Fasihi, M. K. Firozjaei, Effect of environmental policies in com- bating aeolian desertification over sejzy plain of iran, Aeolian research 35 (2018) 19–28
2018
-
[4]
A. S. Goudie, Desert dust and human health disorders, Environment international 63 (2014) 101–113
2014
-
[5]
R. J. Mustafa, M. R. Gomaa, M. Al-Dhaifallah, H. Rezk, Environmental impacts on the performance of solar photovoltaic systems, Sustainability 12 (2) (2020) 608
2020
-
[6]
A. D. Boloorani, M. Soleimani, R. Papi, N. Nasiri, N. N. Samany, S. Mirzaei, A. Al-Hemoud, Assessing the role of drought in dust storm formation in the tigris and euphrates basin, Science of The Total Environment 921 (2024) 171193
2024
-
[7]
A. I. Al-Taei, A. A. Alesheikh, A. D. Boloorani, Evaluating the effects of land use/land cover change on the emergence of hazardous dust sources in the tigris-euphrates basin, Spatial Information Research 32 (5) (2024) 569–582
2024
-
[9]
A. Y. A. Abdelmajeed, R. Juszczak, Challenges and limitations of remote sensing applications in northern peatlands: present and future prospects, Remote Sensing 16 (3) (2024) 591
2024
-
[11]
Von Holdt, F
J. Von Holdt, F. Eckardt, G. Wiggs, Landsat identifies aeolian dust emission dynamics at the landform scale, Remote Sensing of Environment 198 (2017) 229–243
2017
-
[12]
R. Papi, S. Attarchi, A. D. Boloorani, N. N. Samany, Knowledge discovery of middle east dust sources using apriori spatial data mining algorithm, Ecological Informatics 72 (2022) 101867
2022
-
[13]
Z. Yi, Y. Wang, Z. Zeng, W. Li, H. Che, X. Zhang, Decadal trends and drivers of dust emissions in east asia: Integrating statistical and shap-based interpretability approaches, Remote Sensing 17 (7) (2025) 1313
2025
-
[14]
P. Shi, P. Yan, Y. Yuan, M. A. Nearing, Wind erosion research in china: past, present and future, Progress in Physical Geography 28 (3) (2004) 366–386
2004
-
[15]
Shepherd, E
G. Shepherd, E. Terradellas, A. Baklanov, U. Kang, W. Sprigg, S. Nickovic, A. Darvishi Boloorani, A. Al-Dousari, S. Basart, A. Benedetti, et al., Global assessment of sand and dust storms (2016)
2016
-
[16]
A. S. Goudie, N. J. Middleton, Desert dust in the global system, Springer, 2006
2006
-
[17]
Cheng, J
T. Cheng, J. Haworth, J. Wang, Spatio-temporal autocorrelation of road network data, Journal of Geographical Systems 14 (4) (2012) 389–413
2012
-
[18]
J. R. Quinlan, C4. 5: programs for machine learning, Elsevier, 2014
2014
-
[19]
J. R. Quinlan, C4. 5: programs for machine learning, Elsevier, 2014. 13
2014
-
[20]
A. Ziat, E. Delasalles, L. Denoyer, P. Gallinari, Spatio-temporal neural networks for space-time series forecasting and relations discovery, in: 2017 IEEE International Conference on Data Mining (ICDM), IEEE, 2017, pp. 705–714
2017
-
[21]
Gholami, A
H. Gholami, A. Mohamadifar, A. L. Collins, Spatial mapping of the provenance of storm dust: Appli- cation of data mining and ensemble modelling, Atmospheric Research 233 (2020) 104716
2020
-
[22]
Gholami, A
H. Gholami, A. Mohamadifar, A. Sorooshian, J. D. Jansen, Machine-learning algorithms for predicting land susceptibility to dust emissions: The case of the jazmurian basin, iran, Atmospheric pollution research 11 (8) (2020) 1303–1315
2020
-
[23]
A. D. Boloorani, Y. Kazemi, A. Sadeghi, S. N. Shorabeh, M. Argany, Identification of dust sources using long term satellite and climatic data: A case study of tigris and euphrates basin, Atmospheric Environment 224 (2020) 117299
2020
-
[24]
R. Papi, A. A. Kakroodi, M. Soleimani, L. Karami, F. Amiri, S. K. Alavipanah, Identifying sand and dust storm sources using spatial-temporal analysis of remote sensing data in central iran, Ecological Informatics 70 (2022) 101724
2022
-
[25]
Bloemheuvel, J
S. Bloemheuvel, J. van den Hoogen, M. Atzmueller, Graph construction on complex spatiotemporal data for enhancing graph neural network-based approaches, International Journal of Data Science and Analytics 18 (2) (2024) 157–174
2024
-
[26]
G. Jin, Y. Liang, Y. Fang, Z. Shao, J. Huang, J. Zhang, Y. Zheng, Spatio-temporal graph neural networks for predictive learning in urban computing: A survey, IEEE transactions on knowledge and data engineering 36 (10) (2023) 5388–5408
2023
-
[27]
D.-T. Lee, B. J. Schachter, Two algorithms for constructing a delaunay triangulation, International Journal of Computer & Information Sciences 9 (3) (1980) 219–242
1980
-
[28]
L. E. Peterson,k-Nearest neighbor, Scholarpedia 4 (2) (2009) 1883
2009
-
[29]
D. W. Matula, R. R. Sokal, Properties of gabriel graphs relevant to geographic variation research and the clustering of points in the plane, Geographical analysis 12 (3) (1980) 205–222
1980
-
[30]
Damian, K
M. Damian, K. Raudonis, Yao graphs span theta graphs, in: International Conference on Combinatorial Optimization and Applications, Springer, 2010, pp. 181–194
2010
-
[31]
Ciano, A
G. Ciano, A. Rossi, M. Bianchini, F. Scarselli, On inductive–transductive learning with graph neural networks, IEEE Transactions on Pattern Analysis and Machine Intelligence 44 (2) (2021) 758–769
2021
-
[32]
C.B.Barber, D.P.Dobkin, H.Huhdanpaa, Thequickhullalgorithmforconvexhulls, ACMTransactions on Mathematical Software (TOMS) 22 (4) (1996) 469–483
1996
-
[33]
T. Kipf, Semi-supervised classification with graph convolutional networks, arXiv preprint arXiv:1609.02907 (2016)
Pith/arXiv arXiv 2016
-
[34]
Velickovic, G
P. Velickovic, G. Cucurull, A. Casanova, A. Romero, P. Lio, Y. Bengio, et al., Graph attention networks, stat 1050 (20) (2017) 10–48550
2017
-
[35]
Hamilton, Z
W. Hamilton, Z. Ying, J. Leskovec, Inductive representation learning on large graphs, Advances in neural information processing systems 30 (2017)
2017
-
[36]
A. I. Al-Taei, A. A. Alesheikh, A. D. Boloorani, Evaluating the effects of land use/land cover change on the emergence of hazardous dust sources in the tigris-euphrates basin, Spatial Information Research 32 (5) (2024) 569–582. 14
2024
-
[37]
A. D. Boloorani, R. Papi, M. Soleimani, A. Al-Hemoud, F. Amiri, L. Karami, N. N. Samany, M. Bakhtiari, S. Mirzaei, Visual interpretation of satellite imagery for hotspot dust sources identifi- cation, Remote Sensing Applications: Society and Environment 29 (2023) 100888
2023
-
[38]
Rahmati, F
O. Rahmati, F. Mohammadi, S. S. Ghiasi, J. Tiefenbacher, D. D. Moghaddam, F. Coulon, O. A. Nalivan, D. T. Bui, Identifying sources of dust aerosol using a new framework based on remote sensing and modelling, Science of The Total Environment 737 (2020) 139508
2020
-
[39]
Y. Shao, C. Dong, A review on east asian dust storm climate, modelling and monitoring, Global and Planetary Change 52 (1-4) (2006) 1–22
2006
-
[40]
Hengl, J
T. Hengl, J. Mendes de Jesus, G. B. Heuvelink, M. Ruiperez Gonzalez, M. Kilibarda, A. Blagotić, W. Shangguan, M. N. Wright, X. Geng, B. Bauer-Marschallinger, et al., Soilgrids250m: Global gridded soil information based on machine learning, PLoS one 12 (2) (2017) e0169748
2017
-
[41]
Hochreiter, J
S. Hochreiter, J. Schmidhuber, Long short-term memory, Neural computation 9 (8) (1997) 1735–1780. 15
1997
discussion (0)
Sign in with ORCID, Apple, or X to comment. Anyone can read and Pith papers without signing in.