REVIEW 3 major objections 4 minor 71 references
Space evaluation at the starting point of soccer transitions
T0 review · 3 major / 4 minor · reviewed 2026-08-15 · deepseek-v4-flash
Pith's one-line read OBPV measures soccer transition space pitch-wide and separates successful counterattacks from failed ones.
desk verdict A reasonable pitch-wide extension of OBSO with a data-driven transition kernel, but the headline counter-attack validation is confounded by field progression. read the letter →
The pith
A machine-rendered reading of the paper's core claim, the machinery that carries it, and where it could break.
The reading
What carries the argument
The mechanism is the replacement of two components of OBSO. The score model (probability of scoring from a point as a decreasing function of goal distance) is replaced by the field value model $w_{field}(x,y) = \exp(-y^2/(2\sigma(x)^2)) \times weight(x)$, with $weight(x) = (1 + \exp(-(x+15)/30))^{-1}$ and $\sigma(x) = 34(1+weight(x))$; this map assigns high value to the corridor beside the penalty box and the central vital zone while keeping nonzero value across the pitch. The fixed Gaussian transition model is replaced by a transition kernel built from kernel density estimation of pass start and end points within each of eighteen pitch areas, using a data-driven bandwidth doubled for smoothing. Together with the unchanged PPCF term, these two components define OBPV and do the work: the field value decides which space matters, the kernel decides where a pass is realistically likely to go, and the product evaluates a player's off-ball positioning at the start of a transition.
What would settle it
Recompute the comparison with a field value model estimated from data (for example, by fitting the location weights to the probability that a pass received there leads to a shot within the next two events) and check whether successful counterattacks still show higher maximum OBPV than failed ones. If the gap disappears or reverses under a plausible alternative map, the reported effect is an artifact of the hand-set constants rather than of space itself.
Extended reading notes
Core claim
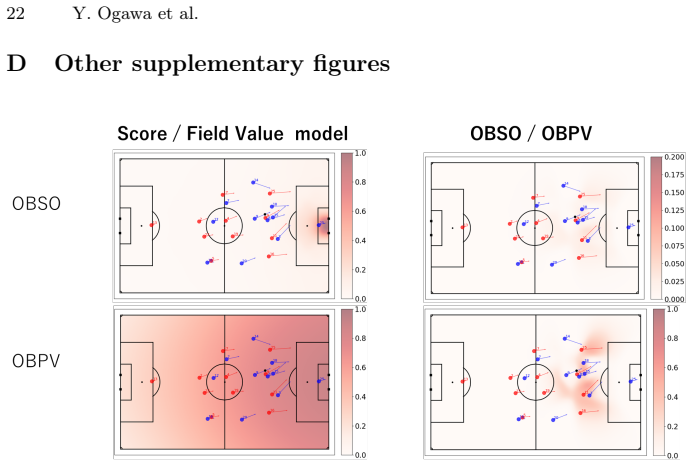
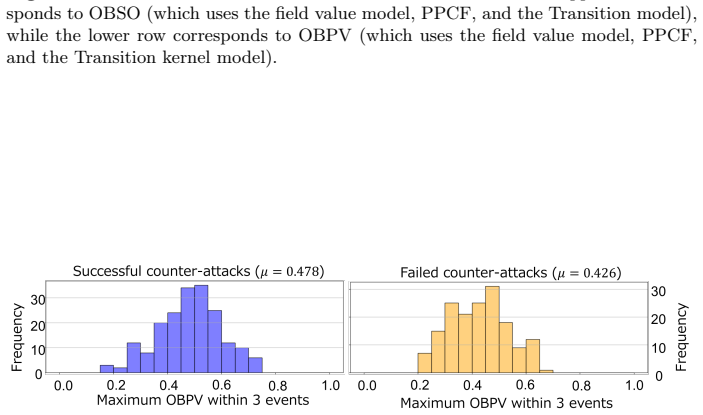
The central claim, on the paper's own terms, is that $OBPV(r) = w_{field}(r) \cdot P(C_r|D) \cdot P(TK_r|D)$ gives an interpretable numerical value to every point on the pitch during an attack, including deep midfield areas where counterattacks begin. Here $w_{field}$ is the field value model weighting attacking importance, $P(C_r|D)$ is the potential pitch control field giving the probability that the attacking team reaches and controls a ball played to $r$, and $P(TK_r|D)$ is the transition kernel, a kernel density estimate of where passes actually go from each of eighteen pitch zones. Using this quantity, the study reports that successful counterattacks (those reaching a shot) show mean maximum OBPV 0.478 over the first three events versus 0.426 for failed ones, with a rank-based test giving $p = 2.44 \times 10^{-6}$ and effect size $d = 0.243$. It further reports that OBPV separates La Liga teams by transition style: teams whose OBPV jumps most during positive transitions tend to play fewer passes per sequence, and teams whose opponents gain little OBPV after negative transitions tend to win more balls high up the pitch. The paper also shows OBPV distinguishes two nearly identical situations that OBSO scores almost equally, because it values positions that offer the next pass or cross, not just a direct shot.
Load-bearing premise
Every OBPV number inherits the hand-set map that decides which parts of the pitch count as valuable attacking space, and the paper does not derive or validate that map with data; if a different reasonable map reshuffles which transitions score high, the main comparison collapses.
Editorial extensions
If this is right
- Transition starting points are no longer dead zones: OBPV gives far-from-goal areas interpretable values, so counterattack space can be compared quantitatively instead of through near-zero scores.
- If OBPV increase during positive transitions tracks fewer passes per sequence ($r = -0.71$ for most teams), a team's aggressiveness after regaining possession can be read from a single spatial index.
- If teams that suppress opponent OBPV gains also win balls in advanced areas ($r = -0.67$), OBPV functions as a pressing-quality measure in addition to an attacking-space measure.
- Because OBPV assigns different values to situations OBSO ties, it can identify penetrative-pass targets and crossing options that shot-oriented metrics miss.
Reading between the lines
- A testable extension would replace the hand-set field value map with a data-fitted importance function learned from the outcomes of actual next events; if that fitted map reproduces the counterattack gap, the current result is robust, and if not, the gap is driven by the chosen weighting.
- Because the transition kernel is averaged over all players and teams in each zone, the metric likely compresses team-specific passing style; conditioning the kernel on the passing team could change OBPV ranks and separate team style more sharply.
- The reported team correlations suggest OBPV increase could serve as a scoutable proxy for verticality and counterpressing, but that link is only correlational; testing it against a league-wide expected-goals model of transitions would clarify whether the space value actually converts into chances.
- The numerical thresholds and the sigmoid midpoint are tied to the geometry of one competition's attacking patterns; applying OBPV to other leagues or formats would require re-estimating the kernel and rechecking the field constants.
Signed reviews
Editorial analysis
A structured set of objections, weighed in public.
Referee Report
Summary. The paper proposes OBPV (Off-Ball Positioning Value), a pitch-wide space evaluation metric for soccer transitions. OBPV is defined in Eq. (4) as the product of a hand-designed field value model w_field, the PPCF P(C_r|D), and a transition kernel model P(TK_r|D) estimated by kernel density estimation from real pass data. The authors evaluate OBPV on La Liga 2023/24 tracking and event data. The central empirical claim, in Section 4.1, is that successful counter-attacks (defined as those ending in a shot) have significantly higher maximum OBPV over the first three events than failed counter-attacks (means 0.478 vs 0.426, Mann-Whitney p=2.44e-6, effect size d=0.243). The paper further reports team-level correlations between OBPV increases after positive transitions and pass counts, and after negative transitions and balls won in advanced areas, characterizing La Liga teams' transition styles. The main contribution is an interpretable extension of OBSO that assigns non-negligible values to midfield and deep areas.
Significance. If the central discriminating result were robust, OBPV would be a practically useful, interpretable tool for transition analysis, filling a real gap left by scoring-probability-based metrics like OBSO. The paper also makes a methodological contribution by replacing the fixed Gaussian transition model with a location-dependent kernel density estimate, which is a sensible and data-driven improvement. The authors are transparent about the model components and provide visual examples. However, the significance is tempered by the lack of validation of the hand-chosen field value model and by the apparent confound between OBPV and simple forward progression in the counter-attack comparison. The team-level analyses also rely on post hoc sample exclusion and report correlations without uncertainty estimates. These issues affect the strength of the main claims rather than the internal consistency of the model definition, so the contribution is promising but not yet convincingly established.
major comments (3)
- [Section 4.1, Eqs. (4)-(5)] The main counter-attack comparison is potentially confounded by field progression. Because w_field(x,y) in Eq. (5) is monotonically increasing in the longitudinal coordinate x, and because StatsBomb's 'From Counter' label requires possession to travel at least 18 yards and be at least 75% direct toward goal, successful counter-attacks are by definition more likely to reach larger x within the first three events. Taking the maximum OBPV over those events therefore tends to select later, more advanced positions. The paper reports no covariate control for starting position, maximum x, or distance progressed. To support the claim that OBPV measures 'effective space utilization' rather than simply attacker advancement, the authors should include a comparison controlling for the maximum longitudinal position or distance progressed, or show that the discrimination persists when using a version of OBPV with w_field set to a constant.
- [Section 3.2 and Appendix C] The field value model w_field is a hand-chosen function whose constants (sigmoid midpoint x=-15 m, scale 30 m, and sigma(x)=34(1+weight(x))) are not derived from data and are not validated against any football outcome. Every OBPV value, including the central Section 4.1 result and all team comparisons, inherits this map. The manuscript states the model 'mirrors' attacking importance but provides no empirical support. Because the claim is that OBPV captures effective space use, the authors should validate the field value model, for example by testing whether alternative parameterizations or alternative spatial importance maps (e.g., a data-driven one) change the sign or significance of the counter-attack discrimination, or by comparing the model's predictions to an external criterion such as pass completion or shot generation.
- [Section 4.2, Fig. 3] The team-level correlations are reported without p-values or confidence intervals, and the exclusion of Real Madrid and Barcelona is justified post hoc by their final league standing. The statement 'Excluding Real Madrid and Barcelona... a moderate negative correlation was observed (r=-0.71)' is not accompanied by the full-sample correlation or a prespecified criterion for exclusion. Reporting the full-sample Spearman correlation with uncertainty, and a sensitivity analysis that includes all 20 teams, is necessary before the team-characterization conclusions can be considered supported.
minor comments (4)
- [Section 3.3, Eq. (7)] The formula for h_Silverman has the exponent written as -(1/5); the text says 'h_Silverman becomes narrower as n increases,' which is correct for n^{-1/5}, but the notation '1/nh' in Eq. (6) is standard yet the double bandwidth in Eq. (7) could be explained more explicitly.
- [Section 3.1] The synchronization method is cited as [64], but the paper does not state how many events were excluded due to synchronization failure, which would help assess potential selection bias.
- [Section 4.1] The paper calls the comparison the 'starting point' of counter-attacks, but the analysis uses the maximum OBPV over the first three events. The wording 'starting point' is therefore somewhat misleading; consider clarifying that the maximum over the opening sequence is the unit of analysis.
- [Fig. 8] The caption reports p < 1.0e-5, which is consistent with p=2.44e-6, but it would be clearer to report the exact p-value in the caption as well.
Circularity Check
No circularity found: OBPV is built from independently specified inputs and is not fitted to the counter-attack outcome it later compares.
full rationale
The paper's derivation chain is self-contained in the sense required by the circularity rules. OBPV (Eq. 4) is defined as the product of a hand-specified field value model w_field (Eq. 5), the PPCF from OBSO, and a transition kernel estimated by KDE from pass data (Eq. 6). None of these components is fitted to the success/failure labels used in Section 4.1; the w_field constants (sigmoid midpoint -15 m, scale 30 m, sigma(x)=34(1+weight(x))) are chosen a priori, not learned from the outcome of counter-attacks. The central empirical comparison (successful vs failed counter-attacks, means 0.478 vs 0.426, p=2.44e-6) therefore is not a fitted-input-called-prediction loop. The self-citations that appear (e.g., [26], [28], [62]) are used as related-work or extension comparisons, not as load-bearing justification for the main result, and no uniqueness theorem is imported from the authors' prior work. The skeptic's concern that w_field increases monotonically with x and that the 'From Counter' label requires forward travel is a real validity threat: the observed OBPV difference may partly reflect progression distance rather than space utilization. However, that is a confound or alternative explanation, not a circular derivation: there is no equation in the paper under which 'successful counter-attack' and 'higher maximum OBPV' are identical by construction. Since no specific reduction to the model's own inputs can be exhibited, the appropriate circularity score is 0.
Assumptions & free parameters
free parameters (5)
- Longitudinal sigmoid midpoint =
-15 m
- Longitudinal sigmoid scale =
30 m
- Lateral spread function sigma(x) =
34 * (1 + weight(x))
- KDE bandwidth multiplier =
2
- Transition distance cutoff =
35 m
assumptions (4)
- domain assumption OBSO independence assumption alpha=0
- domain assumption PPCF parameters from prior work
- domain assumption Pass distributions stationary per pitch area
- ad hoc to paper Field value model represents attacking importance
Cite this review
Pith. "Pith review of Space evaluation at the starting point of soccer transitions." pith.science (2026). https://pith.science/paper/O7XZ3MYE
@misc{pith2026250514711,
  author       = {Pith},
  title        = {Pith review of: Space evaluation at the starting point of soccer transitions},
  year         = {2026},
  howpublished = {\url{https://pith.science/paper/O7XZ3MYE}},
  note         = {Machine review of arXiv:2505.14711}
}
read the original abstract
Soccer is a sport played on a pitch where effective use of space is crucial. Decision-making during transitions, when possession switches between teams, has been increasingly important, but research on space evaluation in these moments has been limited. Recent space evaluation methods such as OBSO (Off-Ball Scoring Opportunity) use scoring probability, so it is not well-suited for assessing areas far from the goal, where transitions typically occur. In this paper, we propose OBPV (Off-Ball Positioning Value) to evaluate space across the pitch, including the starting points of transitions. OBPV extends OBSO by introducing the field value model, which evaluates the entire pitch, and by employing the transition kernel model, which reflects positional specificity through kernel density estimation of pass distributions. Experiments using La Liga 2023/24 season tracking and event data show that OBPV highlights effective space utilization during counter-attacks and reveals team-specific characteristics in how the teams utilize space after positive and negative transitions.
Figures


Figures from the paper (5 more)



Reference graph
Works this paper leans on
-
[1]
com/2023/08/spanish-la-liga-stats-2023-24, accessed on 14 01, 2025
Analyst, O.: Spanish la liga stats: 2023-24 season (2024),https://theanalyst. com/2023/08/spanish-la-liga-stats-2023-24, accessed on 14 01, 2025
work page 2024
-
[2]
International Journal of Performance Analysis in Sport0(0), 1– 17 (2025)
Andrew Peters, Nimai Parmar, M.D., James, N.: A rule-based approach to classify counterpressing – analysis of its risks and relationship with rest defence. International Journal of Performance Analysis in Sport0(0), 1– 17 (2025). https://doi.org/10.1080/24748668.2025.2473799,https://doi.org/10. 1080/24748668.2025.2473799
arXiv 2025
- [3]
-
[4]
Barreira, D., Garganta, J., Guimarães, P., Machado, J., Anguera, M.T.: Ball re- covery patterns as a performance indicator in elite soccer. Proceedings of the Institution of Mechanical Engineers, Part P: Journal of Sports Engineering and Technology228(1), 61–72 (2014). https://doi.org/10.1177/1754337113493083
-
[5]
Data Mining and Knowledge Discovery35(5), 2009–2049 (Sep 2021)
Bauer, P., Anzer, G.: Data-driven detection of counterpressing in profes- sional football. Data Mining and Knowledge Discovery35(5), 2009–2049 (Sep 2021). https://doi.org/10.1007/s10618-021-00763-7,https://doi.org/10.1007/ s10618-021-00763-7
-
[6]
Journal of Quantitative Analysis in Sports15(2), 97–116 (2019)
Bransen, L., Van Haaren, J., van de Velden, M.: Measuring soccer players’ contri- butions to chance creation by valuing their passes. Journal of Quantitative Analysis in Sports15(2), 97–116 (2019)
work page 2019
-
[7]
Brefeld, U., Lasek, J., Mair, S.: Probabilistic movement models and zones of con- trol. Machine Learning108(01 2019). https://doi.org/10.1007/s10994-018-5725-1
-
[8]
In: Proceedings of the 8th MIT Sloan Sports Analytics Conference, Boston, MA, USA
Cervone, D., D’Amour, A., Bornn, L., Goldsberry, K.: Pointwise: Predicting points and valuing decisions in real time with nba optical tracking data. In: Proceedings of the 8th MIT Sloan Sports Analytics Conference, Boston, MA, USA. vol. 28, p. 3 (2014)
work page 2014
Show all 71 references
-
[9]
Journal of the American Statistical Association111(514), 585–599 (2016)
Cervone, D., D’Amour, A., Bornn, L., Goldsberry, K.: A multiresolution stochas- tic process model for predicting basketball possession outcomes. Journal of the American Statistical Association111(514), 585–599 (2016)
2016
-
[10]
Chang, Y.H., Maheswaran, R.T., Kwok, S.J.J., Levy, T., Wexler, A.D., Squire, K.: Quantifying shot quality in the nba. In: Proceedings of the 8th MIT sloan sports analytics conference (2014),https://api.semanticscholar.org/ CorpusID:221170672 Space evaluation at the starting po...
2014
-
[11]
In: Proceedings of the 25th ACM SIGKDD Conference on Knowledge Discovery and Data Mining
Decroos, T., Bransen, L., Van Haaren, J., Davis, J.: Actions speak louder than goals: Valuing player actions in soccer. In: Proceedings of the 25th ACM SIGKDD Conference on Knowledge Discovery and Data Mining. pp. 1851–1861 (2019)
2019
-
[12]
In: Joint European Conference on Machine Learning and Knowledge Discovery in Databases
Decroos, T., Davis, J.: Player vectors: Characterizing soccer players’ playing style from match event streams. In: Joint European Conference on Machine Learning and Knowledge Discovery in Databases. pp. 569–584. Springer (2019)
2019
-
[13]
Data Mining and Knowledge Discovery36(3), 987–1014 (2022)
Dick, U., Link, D., Brefeld, U.: Who can receive the pass? a computational model for quantifying availability in soccer. Data Mining and Knowledge Discovery36(3), 987–1014 (2022)
2022
-
[14]
Frontiers in Sports and Active Living3(2021)
Fassmeyer, D., Anzer, G., Bauer, P., Brefeld, U.: Toward automatically la- beling situations in soccer. Frontiers in Sports and Active Living3(2021). https://doi.org/10.3389/fspor.2021.725431,https://www.frontiersin.org/ journals/sports-and-active-living/articles/10.3389/fspor...
2021
-
[15]
FBref: 2023-2024 la liga stats (2024),https://fbref.com/en/comps/12/ 2023-2024/2023-2024-La-Liga-Stats, accessed on 14 01, 2025
2024
-
[16]
In: 12th MIT Sloan Sports Analytics Confer- ence (2018)
Fernández, J., Bornn, L.: Wide open spaces: A statistical technique for measuring space creation in professional soccer. In: 12th MIT Sloan Sports Analytics Confer- ence (2018)
2018
-
[17]
In: 13th MIT Sloan Sports Analytics Conference (2019)
Fernández, J., Bornn, L., Cervone, D.: Decomposing the immeasurable sport: A deep learning expected possession value framework for soccer. In: 13th MIT Sloan Sports Analytics Conference (2019)
2019
-
[18]
Fujii, K.: Machine learning in sports: Open approach for next play analytics (2025)
2025
-
[19]
In: European Conference on Machine Learning and Knowledge Discovery in Databases (ECML-PKDD’17)
Fujii, K., Inaba, Y., Kawahara, Y.: Koopman spectral kernels for comparing com- plex dynamics: Application to multiagent sport plays. In: European Conference on Machine Learning and Knowledge Discovery in Databases (ECML-PKDD’17). pp. 127–139. Springer (2017)
2017
-
[20]
PLoS One15(11), e0241863 (2020)
Fujii, K., Yoshihara, Y., Matsumoto, Y., Tose, K., Takeuchi, H., Isobe, M., Mizuta, H., Maniwa, D., Okamura, T., Murai, T., et al.: Cognition and interpersonal coor- dination of patients with schizophrenia who have sports habits. PLoS One15(11), e0241863 (2020)
2020
-
[21]
Systems and Computers in Japan36(6), 49–58 (2005)
Fujimura,A.,Sugihara,K.:Geometricanalysisandquantitativeevaluationofsport teamwork. Systems and Computers in Japan36(6), 49–58 (2005)
2005
-
[22]
Big Data7(1), 57–70 (2019)
Goes, F.R., Kempe, M., Meerhoff, L.A., Lemmink, K.A.: Not every pass can be an assist: a data-driven model to measure pass effectiveness in professional soccer matches. Big Data7(1), 57–70 (2019)
2019
-
[23]
Interna- tional Journal of Performance Analysis in Sport15(3), 851–872 (2015)
Gonzalez-Rodenas, J., Lopez-Bondia, I., Calabuig, F., Pérez-Turpin, J.A., Aranda, R.: The effects of playing tactics on creating scoring op- portunities in random matches from us major league soccer. Interna- tional Journal of Performance Analysis in Sport15(3), 851–872 (2015)...
2015
-
[24]
In: 12th MIT Sloan Sports Analytics Conference (2018),https://api.semanticscholar.org/ CorpusID:221471459
Hobbs, J., Power, P., Sha, L., Ruiz, H., Lucey, P.: Quantifying the value of transitions in soccer via spatiotemporal trajectory clustering. In: 12th MIT Sloan Sports Analytics Conference (2018),https://api.semanticscholar.org/ CorpusID:221471459
2018
-
[25]
Journal of Sports Sci- ences33(12), 1205–1213 (2015)
Hongyou Liu, Miguel-Ángel Gomez, C.L.P., Sampaio, J.: Match statistics related to winning in the group stage of 2014 brazil fifa world cup. Journal of Sports Sci- ences33(12), 1205–1213 (2015). https://doi.org/10.1080/02640414.2015.1022578, https://doi.org/10.1080/02640414.201...
2015
-
[26]
Iwashita, S., Scott, A., Umemoto, R., Ding, N., Fujii, K.: Space evaluation based on pitch control using drone video in ultimate (2024),https://arxiv.org/abs/ 2409.14588
2024 arXiv
-
[27]
In: 2023 IEEE 12th Global Conference on Consumer Electronics (GCCE)
Kobayashi, R., Umemoto, R., Takeda, K., Fujii, K.: Score prediction using multiple object tracking for analyzing movements in 2-vs-2 handball. In: 2023 IEEE 12th Global Conference on Consumer Electronics (GCCE). pp. 946–947. IEEE (2023)
2023
-
[28]
In: ECML-PKDD workshop (2024)
Kono, R., Fujii, K.: Mathematical models for off-ball scoring prediction in basket- ball. In: ECML-PKDD workshop (2024)
2024
-
[29]
PLoS One 10(12), 1–14 (12 2015)
Lamas, L., Santana, F., Heiner, M., Ugrinowitsch, C., Fellingham, G.: Modeling the offensive-defensive interaction and resulting outcomes in basketball. PLoS One 10(12), 1–14 (12 2015). https://doi.org/10.1371/journal.pone.0144435,https:// doi.org/10.1371/journal.pone.0144435
2015 doi
-
[30]
PLoS One11(12), e0168768 (2016)
Link, D., Lang, S., Seidenschwarz, P.: Real time quantification of dangerousity in football using spatiotemporal tracking data. PLoS One11(12), e0168768 (2016)
2016
-
[31]
In: Proceedings of the MIT Sloan Sports Analytics Conference (2020)
Llana, S., Madrero, P., Fernández, J., Barcelona, F.: The right place at the right time: Advanced off-ball metrics for exploiting an opponent’s spatial weaknesses in soccer. In: Proceedings of the MIT Sloan Sports Analytics Conference (2020)
2020
-
[32]
In: Proceedings of MIT Sloan Sports Analytics Conference
Lucey, P., Bialkowski, A., Monfort, M., Carr, P., Matthews, I.: quality vs quantity: Improved shot prediction in soccer using strategic features from spatiotemporal data. In: Proceedings of MIT Sloan Sports Analytics Conference. pp. 1–9 (2014)
2014
-
[33]
Frontiers in Sports and Active Living3, 676179 (2021)
Martens, F., Dick, U., Brefeld, U.: Space and control in soccer. Frontiers in Sports and Active Living3, 676179 (2021)
2021
-
[34]
Journal of Sports Sciences32(11), 1076– 1083 (2014)
Martin Vogelbein, S.N., Hökelmann, A.: Defensive transition in soccer – are prompt possession regains a measure of success? a quantitative analysis of ger- man fußball-bundesliga 2010/2011. Journal of Sports Sciences32(11), 1076– 1083 (2014). https://doi.org/10.1080/02640414.2...
2014
-
[35]
Statistica Neerlandica61(4), 432–445 (2007)
McHale, I., Scarf, P.: Modelling soccer matches using bivariate discrete distribu- tions with general dependence structure. Statistica Neerlandica61(4), 432–445 (2007)
2007
-
[36]
Interfaces42(4), 339– 351 (2012)
McHale, I.G., Scarf, P.A., Folker, D.E.: On the development of a soccer player performance rating system for the english premier league. Interfaces42(4), 339– 351 (2012)
2012
-
[37]
arXiv preprint arXiv:2402.06815 (2024)
Mendes-Neves, T., Meireles, L., Mendes-Moreira, J.: Estimating player perfor- mance in different contexts using fine-tuned large events models. arXiv preprint arXiv:2402.06815 (2024)
2024 arXiv
-
[38]
arXiv preprint arXiv:2402.06820 (2024)
Mendes-Neves, T., Meireles, L., Mendes-Moreira, J.: Forecasting events in soccer matches through language. arXiv preprint arXiv:2402.06820 (2024)
2024 arXiv
-
[39]
In: Workshop on Machine Learning and Data Mining for Sports Analytics (2021)
Merckx, S., Robberechts, P., Euvrard, Y., Davis, J.: Measuring the effectiveness of pressing in soccer. In: Workshop on Machine Learning and Data Mining for Sports Analytics (2021)
2021
-
[40]
In: International Workshop on Machine Learning and Data Mining for Sports Analytics
Müller, O., Caron, M., Döring, M., Heuwinkel, T., Baumeister, J.: Pivot: a par- simonious end-to-end learning framework for valuing player actions in handball using tracking data. In: International Workshop on Machine Learning and Data Mining for Sports Analytics. pp. 116–128....
2021
-
[41]
Scientific Reports11(1), 5509 (2021)
Narizuka, T., Yamazaki, Y., Takizawa, K.: Space evaluation in football games via field weighting based on tracking data. Scientific Reports11(1), 5509 (2021)
2021
-
[42]
ACM Transactions on Intelligent Systems and Technology (TIST)10(5), 1–27 (2019) Space evaluation at the starting point of soccer transitions 13
Pappalardo, L., Cintia, P., Ferragina, P., Massucco, E., Pedreschi, D., Giannotti, F.: Playerank: data-driven performance evaluation and player ranking in soccer via a machine learning approach. ACM Transactions on Intelligent Systems and Technology (TIST)10(5), 1–27 (2019) Sp...
2019
-
[43]
Phatak, A., Biermann, H., Wieland, F.: Expected Counter: Probabilistic modelling of the occurrence and danger of counter-attacks in soccer before they occur. (2022)
2022
-
[44]
In: Proceedings of the 23rd ACM SIGKDD International Conference on Knowledge Discovery and Data Mining
Power, P., Ruiz, H., Wei, X., Lucey, P.: Not all passes are created equal: Objec- tively measuring the risk and reward of passes in soccer from tracking data. In: Proceedings of the 23rd ACM SIGKDD International Conference on Knowledge Discovery and Data Mining. pp. 1605–1613 (2017)
2017
-
[45]
In: International Workshop on Machine Learning and Data Mining for Sports Analytics
Rahimian, P., Kim, H., Schmid, M., Toka, L.: Pass receiver and outcome prediction in soccer using temporal graph networks. In: International Workshop on Machine Learning and Data Mining for Sports Analytics. pp. 52–63. Springer (2023)
2023
-
[46]
In: International Workshop on Machine Learning and Data Mining for Sports Analytics
Rahimian,P.,daSilvaGuerraGomes,D.G.,Berkovics,F.,Toka,L.:Let’spenetrate the defense: a machine learning model for prediction and valuation of penetrative passes. In: International Workshop on Machine Learning and Data Mining for Sports Analytics. pp. 41–52. Springer (2022)
2022
-
[47]
In: Yin, H., Camacho, D., Tino, P., Allmendinger, R., Tallón-Ballesteros, A.J., Tang, K., Cho, S.B., Novais, P., Nascimento, S
Raudonius,L.,Allmendinger,R.:Evaluatingfootballplayeractionsduringcounter- attacks. In: Yin, H., Camacho, D., Tino, P., Allmendinger, R., Tallón-Ballesteros, A.J., Tang, K., Cho, S.B., Novais, P., Nascimento, S. (eds.) Intelligent Data Engi- neering and Automated Learning – ID...
2021
-
[48]
Journal of the Royal Statistical Society
Reep, C., Benjamin, B.: Skill and chance in association football. Journal of the Royal Statistical Society. Series A (General)131(4), 581–585 (1968),http://www. jstor.org/stable/2343726
1968
-
[49]
In: FC Barcelona Analytics in Sports Tomorrow Congress (2020)
Rios-Neto, H., Jr., W.M., Vaz-de Melo, P.O.S.: A new look into off-ball scoring op- portunity: taking into account the continuous nature of the game. In: FC Barcelona Analytics in Sports Tomorrow Congress (2020)
2020
-
[50]
In: StatsBomb Innovation in Football Conference (2019)
Robberechts, P.: Valuing the art of pressing. In: StatsBomb Innovation in Football Conference (2019)
2019
-
[51]
In: Proceedings of the 29th ACM SIGKDD Conference on Knowledge Dis- covery and Data Mining
Robberechts, P., Van Roy, M., Davis, J.: un-xpass: Measuring soccer player’s cre- ativity. In: Proceedings of the 29th ACM SIGKDD Conference on Knowledge Dis- covery and Data Mining. pp. 4768–4777 (2023)
2023
-
[52]
Shaw, L.: Laurieontracking (April 2020),https://github.com/ Friends-of-Tracking-Data-FoTD/LaurieOnTracking, accessed on 11 19, 2024
2020
-
[53]
Silverman,B.W.:DensityEstimationforStatisticsandDataAnalysis,Monographs on Statistics and Applied Probability, vol. 26. Chapman and Hall, London (1986)
1986
-
[54]
In: Proceedings of the 28th ACM SIGKDD Conference on Knowledge Discovery and Data Mining
Simpson, I., Beal, R.J., Locke, D., Norman, T.J.: Seq2event: Learning the language of soccer using transformer-based match event prediction. In: Proceedings of the 28th ACM SIGKDD Conference on Knowledge Discovery and Data Mining. pp. 3898–3908 (2022)
2022
-
[55]
arXiv preprint arXiv:2302.10760 (2023)
Sotudeh, H.: Potential penetrative pass (p3). arXiv preprint arXiv:2302.10760 (2023)
2023 arXiv
-
[56]
In: Proceedings of the 12th MIT sloan sports analytics conference
Spearman, W.: Beyond expected goals. In: Proceedings of the 12th MIT sloan sports analytics conference. pp. 1–17 (2018)
2018
-
[57]
In: Proceeding of the 11th MIT Sloan Sports Analytics Conference (2017)
Spearman, W., Basye, A., Dick, G., Hotovy, R., Pop, P.: Physics-based modeling of pass probabilities in soccer. In: Proceeding of the 11th MIT Sloan Sports Analytics Conference (2017)
2017
-
[58]
PLOS ONE18(2), 1–20 (02 2023)
Supola, B., Hoch, T., Baca, A.: Modeling the formation of defensive gaps in basketball: Cutting on a teammate’s drive. PLOS ONE18(2), 1–20 (02 2023). https://doi.org/10.1371/journal.pone.0281467
2023 doi
-
[59]
In: Proceedings of 3rd IEEE International Conference on Image Processing
Taki, T., Hasegawa, J.i., Fukumura, T.: Development of motion analysis system for quantitative evaluation of teamwork in soccer games. In: Proceedings of 3rd IEEE International Conference on Image Processing. vol. 3, pp. 815–818. IEEE (1996) 14 Y. Ogawa et al
1996
-
[60]
In: International Workshop on Machine Learning and Data Mining for Sports Analytics
Teranishi, M., Tsutsui, K., Takeda, K., Fujii, K.: Evaluation of creating scoring opportunities for teammates in soccer via trajectory prediction. In: International Workshop on Machine Learning and Data Mining for Sports Analytics. pp. 53–73. Springer (2022)
2022
-
[61]
PLoS One17(1), e0263051 (2022)
Toda, K., Teranishi, M., Kushiro, K., Fujii, K.: Evaluation of soccer team defense based on prediction models of ball recovery and being attacked: A pilot study. PLoS One17(1), e0263051 (2022)
2022
-
[62]
In: StatsBomb Conference (2023)
Umemoto, R., Fujii, K.: Evaluation of team defense positioning by computing counterfactuals using statsbomb 360 data. In: StatsBomb Conference (2023)
2023
-
[63]
arXiv preprint arXiv:2212.00021 (2022)
Umemoto, R., Tsutsui, K., Fujii, K.: Location analysis of players in uefa euro 2020 and 2022 using generalized valuation of defense by estimating probabilities. arXiv preprint arXiv:2212.00021 (2022)
2022 arXiv
-
[64]
In: ECML-PKDD workshop
Van Roy, M., Cascioli, L., Davis, J.: Etsy: A rule-based approach to event and tracking data synchronization. In: ECML-PKDD workshop. pp. 11–23 (2023)
2023
-
[65]
In: Proceedings of the 2021 StatsBomb Conference, London, UK
Van Roy, M., Robberechts, P., Davis, J.: Optimally disrupting opponent build-ups. In: Proceedings of the 2021 StatsBomb Conference, London, UK. pp. 1–16 (2021)
2021
-
[66]
International Journal of Performance Analysis in Sport11(3), 438–449 (2011)
Wright, C., Atkins, S., Polman, R., Jones, B., Sargeson, L.: Factors as- sociated with goals and goal scoring opportunities in professional soc- cer. International Journal of Performance Analysis in Sport11(3), 438–449 (2011). https://doi.org/10.1080/24748668.2011.11868563,htt...
2011
-
[67]
IEEE Transactions on Visualization and Computer Graphics29(1), 929–939 (2023)
Wu, Y., Deng, D., Xie, X., He, M., Xu, J., Zhang, H., Zhang, H., Wu, Y.: Obtracker: Visual analytics of off-ball movements in basketball. IEEE Transactions on Visualization and Computer Graphics29(1), 929–939 (2023). https://doi.org/10.1109/TVCG.2022.3209373
2023
-
[68]
Complex & Intelligent Systems pp
Yeung, C., Fujii, K.: A strategic framework for optimal decisions in football 1-vs-1 shot-taking situations: An integrated approach of machine learning, theory-based modeling, and game theory. Complex & Intelligent Systems pp. 1–20 (2024)
2024
-
[69]
arXiv preprint arXiv:2502.02785 (2025)
Yeung, C., Ide, K., Someya, T., Fujii, K.: Openstarlab: Open approach for spatio- temporal agent data analysis in soccer. arXiv preprint arXiv:2502.02785 (2025)
2025 arXiv
-
[70]
arXiv preprint arXiv:2302.09276 (2023)
Yeung, C.C., Sit, T., Fujii, K.: Transformer-based neural marked spatio tem- poral point process model for football match events analysis. arXiv preprint arXiv:2302.09276 (2023)
2023 arXiv
-
[71]
wie kann es sein, dass klopp noch keinen hat- trick erzielt hat?
Zeitung, S.: "wie kann es sein, dass klopp noch keinen hat- trick erzielt hat?" (2015),https://www.sueddeutsche.de/sport/ premier-league-bei-klopps-liverpoolern-klemmt-das-gaspedal-1.2695408, accessed on 13 03, 2025 Space evaluation at the starting point of soccer transitions ...
2015
Reviewed August 15, 2026 · model on record in the stance chip above.
Discussion (0). Continue with ORCID to comment.