REVIEW 3 major objections 6 minor 44 references
Sensor-Based Estimation of Dim Light Melatonin Onset (DLMO) Using Features of Two Time Scales
T0 review · 3 major / 6 minor · reviewed 2026-08-14 · deepseek-v4-flash
Pith's one-line read A two-step model combining a week of sleep timing with one day of wearable sensor data estimates DLMO within one hour for 64.5% of held-out test cases.
desk verdict Real contribution undercut by validation-fold significance testing; test set shows promise but not proof. read the letter →
The pith
A machine-rendered reading of the paper's core claim, the machinery that carries it, and where it could break.
The reading
What carries the argument
The machinery is a two-step feature-combination rule. In the first step, the previous week of daily sleep midpoints $T_i$ is compressed into a single circadian-phase summary $\psi$ by a moving average; the paper compares simple moving average, exponential moving average with decay rate $\alpha = 0.9$, and a general weighted moving average, and reports that they perform similarly on validation data, so the exponential version is carried forward. In the second step, a recurrent neural network whose cells are gated recurrent units (a standard type of sequence-learning cell) consumes the 24 hourly values of the current day's light exposure, skin temperature, and physical activity, and at every hourly step receives the scalar $\psi$ as an extra input, letting the network condition the day's phase estimate on prior sleep timing. Training proceeds in three stages: least squares for the moving-average parameters, RNN training with those parameters frozen, and finally joint fine-tuning of all parameters by back-propagation.
What would settle it
Run a cohort in which the past week's light exposure is varied while sleep midpoints are held fixed, for example bright evening light before a constant sleep schedule. If a model that also receives prior-week light-exposure summaries beats the two-step model on test RMSE, the scalar sleep-timing summary is not sufficient. A simpler check: add prior-day summaries of light, skin temperature, and activity to the first step and see whether test RMSE drops below the reported 1.38 hours.
Extended reading notes
Core claim
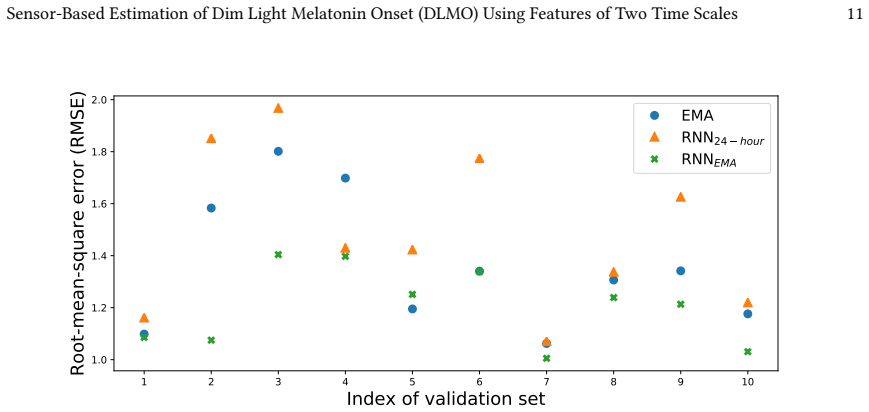
The central claim is that estimating DLMO directly from a combination of daily and frequently sampled sensor data works better than estimating it from either time scale alone, and that this can be done without ever fitting a full melatonin profile. The paper formalizes the target as $\phi = f(\psi, x)$, where $\psi$ is a summary of data from before the day of interest and $x$ is that day's 24 hours of hourly light exposure, wrist skin temperature, and physical activity. It implements $\psi$ as a moving average of the previous seven days' sleep midpoints, comparing simple, exponential, and fully weighted moving averages, and feeds $\psi$ together with $x$ into a recurrent neural network with gated recurrent unit cells. In the evaluated configuration, the model achieved a validation RMSE of 1.21 hours, a test RMSE of 1.38 hours, and 64.5% of test predictions within one hour of measured DLMO, statistically significantly better on validation sets than either the exponential moving average alone or a 24-hour RNN without the sleep-timing summary (repeated-measures ANOVA, $p=0.0022$, with paired comparisons $p=0.048$ and $p=0.013$ after multiple-comparison correction). The authors present this as a generalization of earlier one-time-scale approaches and as the first model to predict DLMO directly from frequently sampled data rather than first estimating melatonin concentrations.
Load-bearing premise
The load-bearing premise is that one scalar summary of the past week's sleep midpoints contains all the circadian-relevant information from before the current day, so anything that happens earlier (light exposure, activity, sleep irregularity) matters only through that average; if prior patterns carry independent information, the claimed improvement may not generalize beyond this student cohort.
Editorial extensions
If this is right
- A wearable-derived DLMO estimate can replace expensive overnight saliva or blood collections for many uses, since all inputs come from wrist sensors and sleep diaries.
- Because the two-scale model outperforms both single-scale baselines, circadian-phase estimators should include both a recent-history summary and same-day frequent sampling.
- The model with light exposure and skin temperature alone still reaches 61.3% within one hour on the held-out set, so a two-sensor setup could nearly match the full three-sensor version.
- Training a model that predicts DLMO directly avoids the need for full melatonin profiles, lowering the cost of building and updating such models.
- The framework is described as general to other regression or classification tasks with sensor data at different sample rates, so the same two-step structure could transfer to other wearable health targets.
Reading between the lines
- The paper's own error analysis shows that the two-step model's errors are strongly correlated with those of the sleep-midpoint summary, so the largest remaining accuracy gain likely lies in enriching the first step (for example, summaries of prior light exposure or activity timing) rather than in the network architecture.
- Because the test set is one cohort of undergraduates at one college, the absolute numbers (1.38-hour RMSE, 64.5% within one hour) should be read as an upper bound of expected field performance; shift workers, jet-lagged travelers, or clinical populations may need recalibration.
- The choice of the exponential moving average over the fully weighted moving average is pragmatic rather than strongly supported by validation RMSE; a larger test set could plausibly change that ordering, and the paper's noise analysis suggests simple averaging becomes preferable as sleep-midpoint noise grows.
- A clean test of the framework's core premise is to add previous-day light-exposure summaries to the first step: if accuracy improves, the scalar sleep-timing summary is losing information; if it does not, the compression is sufficient.
Signed reviews
Editorial analysis
A structured set of objections, weighed in public.
Referee Report
Summary. The paper proposes a two-step framework for estimating dim light melatonin onset (DLMO) from wearable sensor data. The first step summarizes daily sleep timing data from the week before the target day using a moving average (SMA, EMA, or MA), producing a scalar circadian-phase proxy; the second step feeds this summary together with the current day's frequently sampled light exposure, skin temperature, and activity data into a gated recurrent unit (GRU) network to regress DLMO directly. The framework is evaluated on data from 207 undergraduates, with a temporal split (2013–2016 for training, 2017 for testing). The paper reports that the two-step model RNNEMA outperforms an EMA-only model and an RNN model using only 24-hour frequent data on cross-validation RMSE and on the test-set metrics RMSE and percentage of predictions within one hour, and claims that these differences are statistically significant.
Significance. If the claimed improvements are real, the paper offers a practical, low-cost way to estimate circadian phase from wearables without requiring full overnight melatonin profiles, which is an important step toward clinical and self-tracking applications. The two-step framework is a natural generalization of existing single-time-scale approaches and is, to the authors' knowledge, the first to predict DLMO directly from frequently sampled data, avoiding the need to fit entire melatonin curves. The use of a temporally separated holdout set is a methodological strength, and the comparison of three moving-average summarizers plus an error analysis are useful contributions. However, the central statistical claim is not yet supported by the evidence as presented: the significance tests are performed on cross-validation folds rather than on the independent test set, and model selection is not accounted for. The practical significance of the test-set gain (about 0.04 h in RMSE over EMA) also remains unclear without inferential analysis on the 31 test subjects.
major comments (3)
- [Section 5.2, Table 2] The headline claim that the two-time-scale model is "statistically significantly better" than the EMA and RNN24-hour baselines is not supported by the reported tests. The repeated-measures ANOVA and paired t-tests cited in Section 5.2 are applied to RMSEval values from the 10 cross-validation folds, not to the 31-sample test set. The test-set metrics in Table 2 (RMSEtest: 1.38 vs. 1.42 vs. 1.55; <1h: 64.5% vs. 54.8% vs. 41.9%) are presented only descriptively, with no significance test or confidence interval. Because RNNEMA was selected after comparing it with RNNSMA and RNNMA on the same validation folds (Section 5.2 reports p=0.66 for that comparison), the subsequent paired tests of the selected model against the baselines on those same folds are conditional on the selection and are not corrected for it. The abstract's statement of statistically significantly lower RMSE is therefore not established.
- [Section 4.2, Table 2] With a test set of only 31 samples, the observed RMSEtest difference between RNNEMA and EMA (1.38 vs. 1.42 h, a 0.04 h difference) is well within plausible sampling noise, and the reported <1h difference (64.5% vs. 54.8%) is based on a handful of samples. The manuscript does not report paired significance tests (e.g., Wilcoxon signed-rank test or paired t-test on per-subject absolute errors) or bootstrap confidence intervals for the test-set differences. Without such test-set inference, the conclusion that the two-step model is superior to one-scale models is overstated. The authors should either provide this analysis or temper the claims appropriately.
- [Section 3.1, Section 5.1] The hyperparameters alpha=0.9 (EMA decay) and n=7 (window size) are selected using the same dataset on which the main comparison is made. Alpha is chosen based on 'preliminary experiments (data not shown)', and n=7 is retained even though Section 5.1 reports no significant effect of window size. This additional layer of model selection is not reflected in the significance testing of Section 5.2, further inflating the risk of a spurious finding. The authors should fix these parameters a priori, use nested cross-validation, or at least report the sensitivity of the central comparison to the choice of alpha and n.
minor comments (6)
- [Section 3.2] The theoretical comparison of SMA and EMA variances assumes i.i.d. Gaussian noise on sleep midpoints, which is a strong simplification given the autocorrelation and missingness of sleep timing data. The statement that EMA 'could be a better method when the noise is small' is framed too strongly; the simulation in Figure 4 is the more relevant evidence.
- [Section 4.1 and Section 4.2] The definition of RMSEval is inconsistent: Section 4.1 uses leave-one-participant-out cross-validation, while Section 4.2 switches to 10-fold cross-validation. Please harmonize the terminology to avoid confusion, especially because the results in Sections 5.1 and 5.2 are based on different validation protocols.
- [Figure 4] The y-axis label 'r2' should be rendered as 'R²' for readability.
- [Section 5.2 and throughout] The model name is written as 'RNNEMA' in tables and equations but sometimes as 'RNN EMA' in the text (e.g., the first sentence of Section 5.2 and Figure 5). Please use consistent notation.
- [Table 4] The comparison with prior work [4, 35] is described as using 'a subset of the data in this datasets', but the manuscript does not specify whether the same train/test split, preprocessing, and evaluation protocol were used for the cited methods. Please clarify the matching conditions for these comparisons.
- [General] The manuscript does not include a code availability statement. Given that the method is empirical and relies on several preprocessing and hyperparameter choices, providing code (or at least a detailed reproducibility checklist) would strengthen the paper.
Circularity Check
The DLMO estimator itself is not constructed from its labels, but the headline significance claim reuses the validation folds that selected RNNEMA, so the statistical superiority claim is partly circular.
-
fitted input called prediction
[Section 5.2, Question 2 (comparison of RNNEMA vs. EMA and RNN24-hour), Table 2]
"Therefore, in the next step, we used the model RNNEMA because it had the best score on two of the three metrics (i.e., RMSEval and <1h). Table 2 shows that RNNEMA showed the lowest RMSEval and RMSEtest and highest <1h. The model performance for EMA, RNN24-hour, and RNNEMA on the validation sets (RMSEval) was significantly different (p = 0.0022, repeated measures ANOVA). RNNEMA performed significantly better than the other two models ..."
The significance tests are computed on the same 10-fold validation RMSE values (RMSEval) that were used to choose RNNEMA. Because RNNEMA was selected as the best among RNNSMA, RNNEMA, and RNNMA on exactly those RMSEval and <1h metrics, the follow-up paired tests on those same folds are conditional on a selection made from the same criterion, and the p-values are not corrected for this selection. The independent test set is reported only descriptively (RMSEtest 1.38 vs. 1.42 vs. 1.55; <1h 64.5% vs. 54.8% vs. 41.9%) with no inferential test, so the paper's central claim of 'statistically significantly lower' error is an artifact of reusing the selection criterion as the evidence rather than a prediction from an independent benchmark.
full rationale
The core DLMO estimator is empirical: features (sleep midpoints and current-day light exposure, skin temperature, and activity) are mapped to DLMO labels by least-squares and RNN training, so the predicted DLMO values are not equal to the inputs by construction. The two-step decomposition in Eq. 2 is a modeling assumption rather than a definitional identity: psi is a sleep-midpoint summary, not the DLMO label. The tuning of alpha = 0.9 and window size n = 7 is a standard model-selection limitation, and the comparisons with prior work in Table 4 share the same dataset, but these are evaluation concerns rather than circular derivations. The one load-bearing circularity-adjacent step is the Section 5.2 significance claim, which reuses the validation folds used for model selection as the basis for paired significance tests, while the test-set numbers remain purely descriptive. This weakens the headline statistical claim substantially but does not make the DLMO prediction itself a restatement of its inputs; the score reflects this partial, selection-conditioned circularity rather than a by-construction derivation.
Assumptions & free parameters
free parameters (5)
- EMA decay alpha =
0.9
- Moving average window size n =
7
- SMA/EMA regression coefficients a and b =
Not reported
- MA weights w_i and bias b =
Not reported
- RNN/GRU trainable parameters =
Not reported
assumptions (6)
- domain assumption Circadian phase on day t can be represented as phi = f(psi, x), where psi summarizes prior data and x is current-day frequent sensor data.
- domain assumption The sleep midpoint over the past week is a reliable estimator of circadian phase.
- domain assumption DLMO determined by linear interpolation of the time melatonin first exceeds 5 pg/mL is a valid ground truth.
- domain assumption Linear interpolation of missing sensor data is valid for gaps shorter than 12 hours.
- domain assumption The 2017 test cohort is representative of the training population from 2013-2016.
- domain assumption Data from a single college population generalize to other populations.
Cite this review
Pith. "Pith review of Sensor-Based Estimation of Dim Light Melatonin Onset (DLMO) Using Features of Two Time Scales." pith.science (2026). https://pith.science/paper/OEWGDKO6
@misc{pith2026190807483,
  author       = {Pith},
  title        = {Pith review of: Sensor-Based Estimation of Dim Light Melatonin Onset (DLMO) Using Features of Two Time Scales},
  year         = {2026},
  howpublished = {\url{https://pith.science/paper/OEWGDKO6}},
  note         = {Machine review of arXiv:1908.07483}
}
read the original abstract
Circadian rhythms influence multiple essential biological activities including sleep, performance, and mood. The dim light melatonin onset (DLMO) is the gold standard for measuring human circadian phase (i.e., timing). The collection of DLMO is expensive and time-consuming since multiple saliva or blood samples are required overnight in special conditions, and the samples must then be assayed for melatonin. Recently, several computational approaches have been designed for estimating DLMO. These methods collect daily sampled data (e.g., sleep onset/offset times) or frequently sampled data (e.g., light exposure/skin temperature/physical activity collected every minute) to train learning models for estimating DLMO. One limitation of these studies is that they only leverage one time-scale data. We propose a two-step framework for estimating DLMO using data from both time scales. The first step summarizes data from before the current day, while the second step combines this summary with frequently sampled data of the current day. We evaluate three moving average models that input sleep timing data as the first step and use recurrent neural network models as the second step. The results using data from 207 undergraduates show that our two-step model with two time-scale features has statistically significantly lower root-mean-square errors than models that use either daily sampled data or frequently sampled data.
Figures


Figures from the paper (3 more)


Reference graph
Works this paper leans on
-
[1]
Kelly Glazer Baron and Kathryn J. Reid. 2014. Circadian misalignment and health. International Review of Psychiatry 26, 2 (2014), 139–154
work page 2014
-
[2]
Susan Benloucif, Helen J. Burgess, Elizabeth B. Klerman, Alfred J. Lewy, Benita Middleton, Patricia J. Murphy, Barbara L. Parry, and Victoria L. Revell. 2008. Measuring melatonin in humans. Journal of Clinical Sleep Medicine 4, 01 (2008), 66–69. Manuscript submitted to ACM Sensor-Based Estimation of Dim Light Melatonin Onset (DLMO) Using Features of Two T...
work page 2008
-
[3]
Bonmati-Carrion, Benita Middleton, Victoria L
Maria A. Bonmati-Carrion, Benita Middleton, Victoria L. Revell, Debra J. Skene, Angeles Rol, and Juan A. Madrid. 2014. Circadian phase asessment by ambulatory monitoring in humans: Correlation with dim light melatonin onset. Chronobiology International 31, 1 (2014), 37–51
work page 2014
-
[4]
Lindsey S. Brown, Melissa A. St. Hilaire, Andrew W. McHill, Andrew J. K. Phillips, Laura K. Barger, Akane Sano, Rosalind W. Picard, Elizabeth B. Klerman, and Francis J. Doyle III. 2018. A neural network predicts human circadian phase from non-invasive, short-timeframe actigraphy and demographic data: A step towards automated control of circadian phase. (2...
work page 2018
-
[5]
Helen J. Burgess and Charmane I. Eastman. 2005. The dim light melatonin onset following fixed and free sleep schedules. Journal of Sleep Research 14, 3 (2005), 229–237
work page 2005
-
[6]
Helen J Burgess and Louis F Fogg. 2008. Individual differences in the amount and timing of salivary melatonin secretion. PloS ONE 3, 8 (2008)
work page 2008
-
[7]
Tina M. Burke, Rachel R. Markwald, Andrew W. McHill, Evan D. Chinoy, Jesse A. Snider, Sara C. Bessman, Christopher M. Jung, John S. O’Neill, and Kenneth P. Wright. 2015. Effects of caffeine on the human circadian clock in vivo and in vitro. Science Translational Medicine 7, 305 (2015), 305ra146–305ra146
work page 2015
-
[8]
Christian Cajochen, Sylvia Frey, Doreen Anders, Jakub Späti, Matthias Bues, Achim Pross, Ralph Mager, Anna Wirz-Justice, and Oliver Stefani. 2011. Evening exposure to a light emitting diodes (LED)-backlit computer screen affects circadian physiology and cognitive performance. American Journal of Physiology-Heart and Circulatory Physiology (2011)
work page 2011
Show all 44 references
-
[9]
Anne-Marie Chang, Daniel Aeschbach, Jeanne F Duffy, and Charles A Czeisler. 2015. Evening use of light-emitting eReaders negatively affects sleep, circadian timing, and next-morning alertness. Proceedings of the National Academy of Sciences 112, 4 (2015), 1232–1237
2015
-
[10]
Junyoung Chung, Caglar Gulcehre, KyungHyun Cho, and Yoshua Bengio. 2014. Empirical evaluation of gated recurrent neural networks on sequence modeling. arXiv preprint arXiv:1412.3555 (2014)
2014 arXiv
-
[11]
Crowley, Christine Acebo, Gahan Fallone, and Mary A
Stephanie J. Crowley, Christine Acebo, Gahan Fallone, and Mary A. Carskadon. 2006. Estimating dim light melatonin onset (DLMO) phase in adolescents using summer or school-year sleep/wake schedules. Sleep 29, 12 (2006), 1632–1641
2006
-
[12]
Czeisler and Orfeu M
Charles A. Czeisler and Orfeu M. Buxton. 2017. The human circadian timing system and sleep-wake regulation. In Principles and Practice of Sleep Medicine: Sixth Edition. Elsevier Inc., 362–376
2017
-
[13]
Czeisler, Michael P
Charles A. Czeisler, Michael P. Johnson, Jeanne F. Duffy, Emery N. Brown, Joseph M. Ronda, and Richard E. Kronauer. 1990. Exposure to bright light and darkness to treat physiologic maladaptation to night work. New England Journal of Medicine 322, 18 (1990), 1253–1259
1990
-
[14]
Davies, Andrew A
Simon L. Davies, Andrew A. Neath, and Joseph E. Cavanaugh. 2005. Cross validation model selection criteria for linear regression based on the Kullback–Leibler discrepancy. Statistical Methodology 2, 4 (2005), 249–266
2005
-
[15]
Luigi Di Lorenzo, Giovanni De Pergola, Carlo Zocchetti, Nicola L’Abbate, Antonella Basso, Nicola Pannacciulli, Mauro Cignarelli, Riccardo Giorgino, and Leonardo Soleo. 2003. Effect of shift work on body mass index: results of a study performed in 319 glucose-tolerant men worki...
2003
-
[16]
Tianxiang Gao and Vladimir Jojic. 2016. Degrees of freedom in deep neural networks. arXiv preprint arXiv:1603.09260 (2016)
2016 arXiv
-
[17]
Gil, Xavier L
Enrique A. Gil, Xavier L. Aubert, Els I. S. Møst, and Domien G. M. Beersma. 2013. Human circadian phase estimation from signals collected in ambulatory conditions using an autoregressive model. Journal of Biological Rhythms 28, 2 (2013), 152–163
2013
-
[18]
Samuel B. Green. 1991. How many subjects does it take to do a regression analysis. Multivariate Behavioral Research 26, 3 (1991), 499–510
1991
-
[19]
Simon Haykin. 1994. Neural networks. Vol. 2. Prentice Hall New York
1994
-
[20]
Melissa A. St. Hilaire, Claude Gronfier, Jamie M. Zeitzer, and Elizabeth B. Klerman. 2007. A physiologically based mathematical model of melatonin including ocular light suppression and interactions with the circadian pacemaker. Journal of Pineal Research 43, 3 (2007), 294–304
2007
-
[21]
Melissa A. St. Hilaire, Elizabeth B. Klerman, Sat Bir S. Khalsa, Kenneth P. Wright Jr., Charles A. Czeisler, and Richard E. Kronauer. 2007. Addition of a non-photic component to a light-based mathematical model of the human circadian pacemaker. Journal of Theoretical Biology 2...
2007
-
[22]
Sat Bir S Khalsa, Megan E Jewett, Christian Cajochen, and Charles A Czeisler. 2003. A phase response curve to single bright light pulses in human subjects. The Journal of Physiology 549, 3 (2003), 945–952
2003
-
[23]
Klerman, Hayley B
Elizabeth B. Klerman, Hayley B. Gershengorn, Jeanne F. Duffy, and Richard E. Kronauer. 2002. Comparisons of the variability of three markers of the human circadian pacemaker. Journal of Biological Rhythms 17, 2 (2002), 181–193
2002
-
[24]
Vitaliy Kolodyazhniy, Jakub Späti, Sylvia Frey, Thomas Götz, Anna Wirz-Justice, Kurt Kräuchi, Christian Cajochen, and Frank H. Wilhelm. 2011. Estimation of human circadian phase via a multi-channel ambulatory monitoring system and a multiple regression model. Journal of Biolog...
2011
-
[25]
Vitaliy Kolodyazhniy, Jakub Späti, Sylvia Frey, Thomas Götz, Anna Wirz-Justice, Kurt Kräuchi, Christian Cajochen, and Frank H. Wilhelm. 2012. An improved method for estimating human circadian phase derived from multichannel ambulatory monitoring and artificial neural networks....
2012
-
[26]
Kronauer, Daniel B
Richard E. Kronauer, Daniel B. Forger, and Megan E. Jewett. 1999. Quantifying human circadian pacemaker response to brief, extended, and repeated light stimuli over the phototopic range. Journal of Biological Rhythms 14, 6 (1999), 501–516
1999
-
[27]
Martin and Charmane I
Stacia K. Martin and Charmane I. Eastman. 2002. Sleep logs of young adults with self-selected sleep times predict the dim light melatonin onset. Chronobiology International 19, 4 (2002), 695–707
2002
-
[28]
McHill, Andrew J
Andrew W. McHill, Andrew J. K. Phillips, Charles A. Czeisler, Leigh Keating, Karen Yee, Laura K. Barger, Marta Garaulet, Frank A. J. L. Scheer, and Elizabeth B. Klerman. 2017. Later circadian timing of food intake is associated with increased body fat. The American Journal of ...
2017
-
[29]
Tomáš Mikolov, Martin Karafiát, Lukáš Burget, Jan Černock`y, and Sanjeev Khudanpur. 2010. Recurrent neural network based language model. In Eleventh Annual Conference of the International Speech Communication Association
2010
-
[30]
Mistlberger
Ralph E. Mistlberger. 2005. Circadian regulation of sleep in mammals: role of the suprachiasmatic nucleus. Brain Research Reviews 49, 3 (2005), 429–454
2005
-
[31]
Morris, Taylor E
Christopher J. Morris, Taylor E. Purvis, Kun Hu, and Frank A. J. L. Scheer. 2016. Circadian misalignment increases cardiovascular disease risk factors in humans. Proceedings of the National Academy of Sciences 113, 10 (2016), E1402–E1411
2016
-
[32]
Noboru Murata, Shuji Yoshizawa, and Shun-ichi Amari. 1994. Network information criterion-determining the number of hidden units for an artificial neural network model. IEEE Transactions on Neural Networks 5, 6 (1994), 865–872
1994
-
[33]
Pandi-Perumal, Marcel Smits, Warren Spence, Venkataramanujan Srinivasan, Daniel P
Seithikurippu R. Pandi-Perumal, Marcel Smits, Warren Spence, Venkataramanujan Srinivasan, Daniel P. Cardinali, Alan D. Lowe, and Leonid Kayumov. 2007. Dim light melatonin onset (DLMO): a tool for the analysis of circadian phase in human sleep and chronobiological disorders. Pr...
2007
-
[34]
Adam Paszke, Sam Gross, Francisco Massa, Adam Lerer, James Bradbury, Gregory Chanan, Trevor Killeen, Zeming Lin, Natalia Gimelshein, Luca Antiga, Alban Desmaison, Andreas Kopf, Edward Yang, Zachary DeVito, Martin Raison, Alykhan Tejani, Sasank Chilamkurthy, Benoit Steiner, Lu ...
2019
-
[35]
Andrew J. K. Phillips, William M. Clerx, Conor S. O’Brien, Akane Sano, Laura K. Barger, Rosalind W. Picard, Steven W. Lockley, Elizabeth B. Klerman, and Charles A. Czeisler. 2017. Irregular sleep/wake patterns are associated with poorer academic performance and delayed circadi...
2017
-
[36]
Payam Refaeilzadeh, Lei Tang, and Huan Liu. 2007. On comparison of feature selection algorithms. In Proceedings of AAAI Workshop on Evaluation Methods for Machine Learning II , Vol. 3. 5
2007
-
[37]
Benjamin Rusak and Irving Zucker. 1979. Neural regulation of circadian rhythms. Physiological Reviews 59, 3 (1979), 449–526
1979
-
[38]
Sack, Dennis Auckley, R
Robert L. Sack, Dennis Auckley, R. Robert Auger, Mary A. Carskadon, Kenneth P. Wright Jr., Michael V. Vitiello, and Irina V. Zhdanova. 2007. Circadian rhythm sleep disorders: part I, basic principles, shift work and jet lag disorders. Sleep 30, 11 (2007), 1460–1483
2007
-
[39]
Akane Sano. 2016. Measuring college students’ sleep, stress, mental health and wellbeing with wearable sensors and mobile phones . Ph.D. Dissertation. Massachusetts Institute of Technology
2016
-
[40]
Akane Sano, Weixuan Chen, Daniel Lopez-Martinez, Sara Taylor, and Rosalind W. Picard. 2018. Multimodal Ambulatory Sleep Detection Using LSTM Recurrent Neural Networks. IEEE Journal of Biomedical and Health Informatics (2018)
2018
-
[41]
McHill, Andrew J
Akane Sano, Sara Taylor, Andrew W. McHill, Andrew J. K. Phillips, Laura K. Barger, Elizabeth B. Klerman, and Rosalind Picard. 2018. Identifying objective physiological markers and modifiable behaviors for self-reported stress and mental health status using wearable sensors and...
2018
-
[42]
Pawel Smialowski, Dmitrij Frishman, and Stefan Kramer. 2009. Pitfalls of supervised feature selection. Bioinformatics 26, 3 (2009), 440–443
2009
-
[43]
Stone, Andrew J
Julia E. Stone, Andrew J. K. Phillips, Suzanne Ftouni, Michelle Magee, Mark Howard, Steven W. Lockley, Tracey L. Sletten, Clare Anderson, Shantha M. W. Rajaratnam, and Svetlana Postnova. 2019. Generalizability of A neural network Model for circadian phase prediction in Real-Wo...
2019
-
[44]
Sara Ann Taylor, Natasha Jaques, Ehimwenma Nosakhare, Akane Sano, and Rosalind W. Picard. 2017. Personalized Multitask Learning for Predicting Tomorrow’s Mood, Stress, and Health. IEEE Transactions on Affective Computing (2017). Manuscript submitted to ACM
2017
Reviewed August 14, 2026 · model on record in the stance chip above.
Discussion (0). Continue with ORCID to comment.