From Nominal Intensity to Equivalent Rainfall: A Path-Based Credibility Evaluation Framework for Simulated Rainfall in Autonomous-Driving Perception Tests
Pith reviewed 2026-06-27 09:54 UTC · model grok-4.3
The pith
A path-based method measures simulated rainfall credibility for autonomous-driving tests using real raindrop distributions and lidar perception proxies.
A machine-rendered reading of the paper's core claim, the machinery that carries it, and where it could break.
Core claim
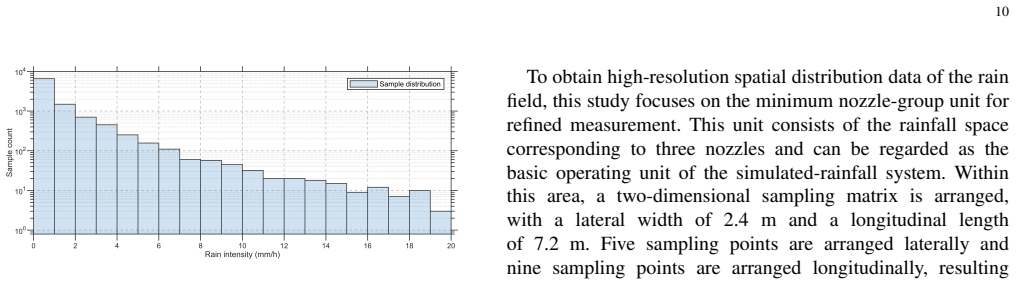
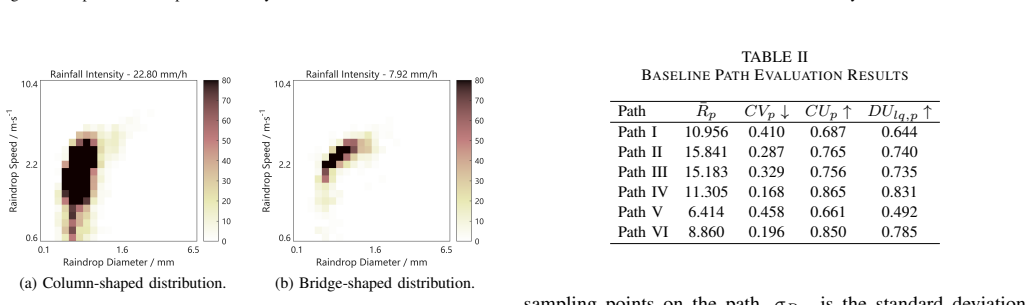
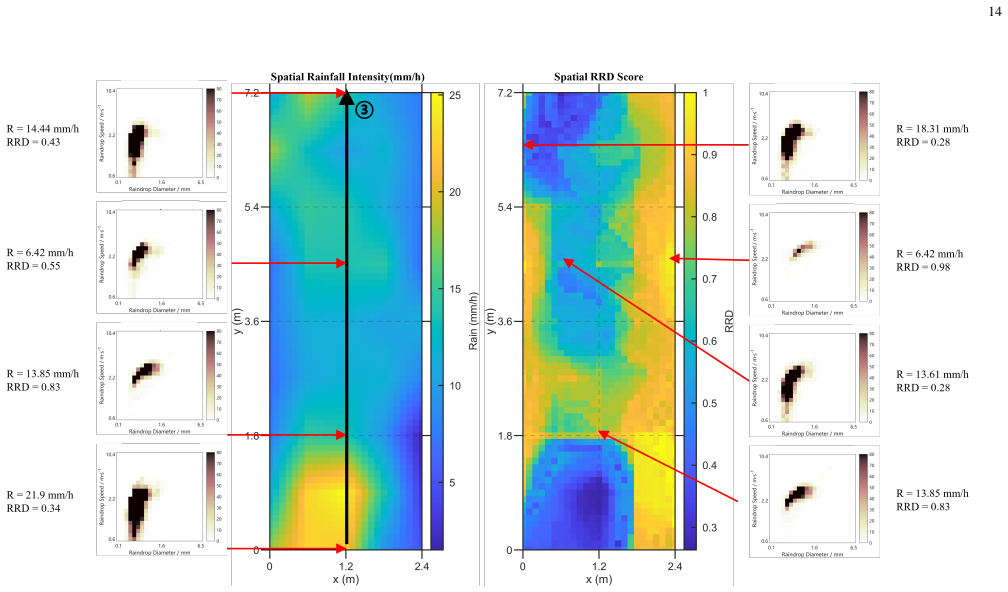
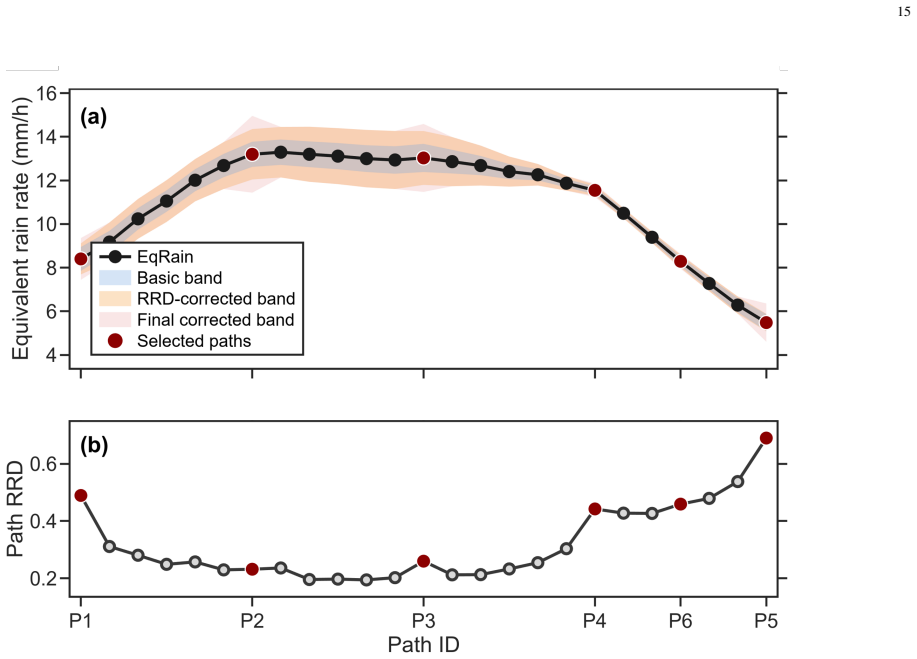
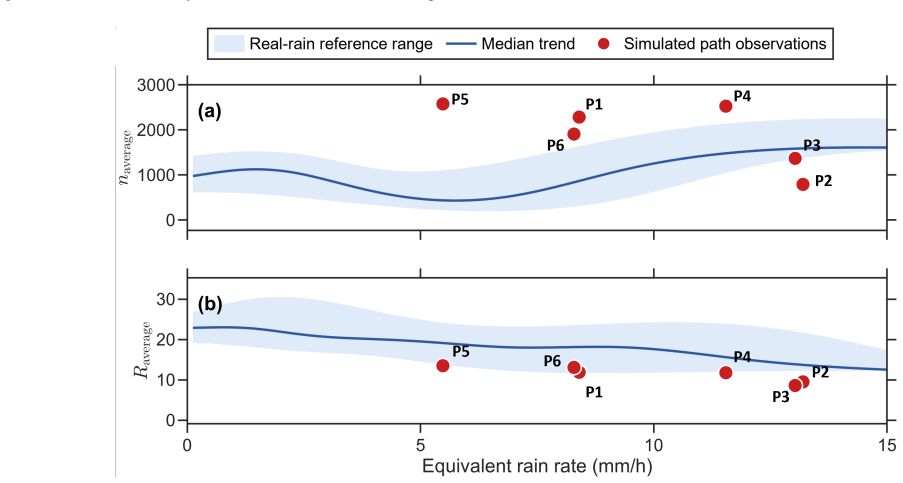
The central claim is that representing each candidate path by path-equivalent rainfall intensity, an uncertainty band, a path-averaged Realism of Raindrop Distribution score, and lidar target point-cloud count plus mean reflectivity yields a credible ranking of simulated-rainfall conditions; experiments with approximately 10,000 real-rainfall samples, 728 RainSense perception samples, and 45 spatial points confirm that Paths IV and VI achieve the most balanced results (11.54 ± 0.31 mm/h with RRD 0.43 and 8.28 ± 0.34 mm/h with RRD 0.46) while spatial non-uniformity under identical nominal intensity demonstrates the necessity of the path-based view.
What carries the argument
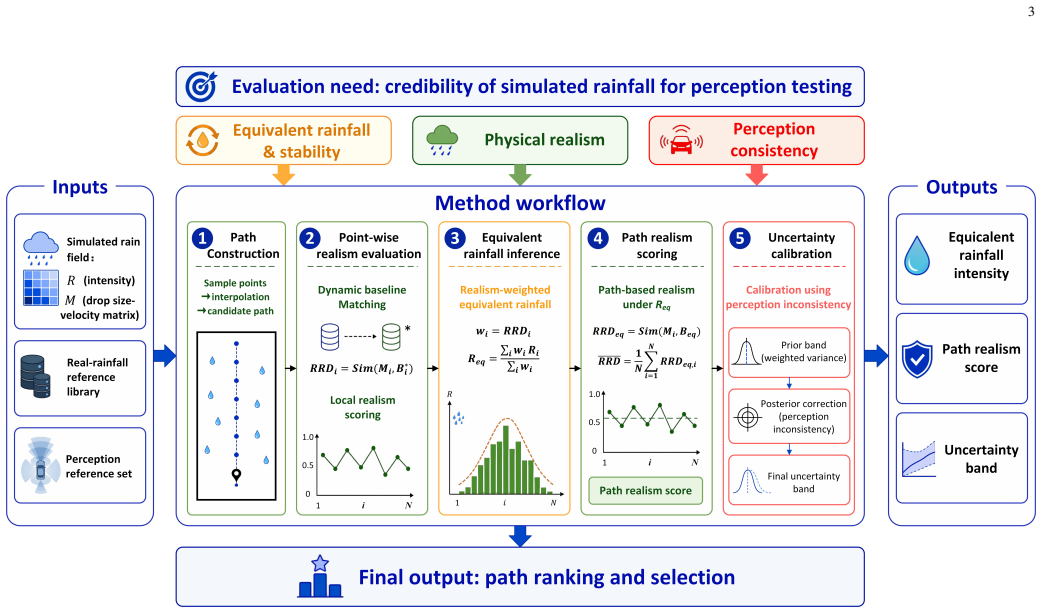
Path-based credibility evaluation that converts real-rainfall drop-size and velocity joint distributions into path-equivalent rainfall intensity, RRD score, and lidar perception-consistency correction.
If this is right
- Spatial non-uniformity under the same nominal intensity requires path-specific descriptions instead of single-point or nominal values for test reporting.
- The two selected paths provide more stable intensity, realistic spectra, and consistent lidar responses than the other four paths examined.
- The method supplies quantitative criteria for choosing which simulated-rainfall path to use when mapping test results to real-world scenarios.
- Perception-consistency correction using lidar point-cloud count and reflectivity allows the rainfall condition to be linked directly to sensor behavior.
Where Pith is reading between the lines
- The same path-ranking logic could be applied to other controlled weather conditions such as fog or snow once comparable real-world joint distributions are available.
- If the method is adopted, test protocols could require reporting both the chosen path and its RRD and uncertainty values rather than nominal intensity alone.
- Discrepancies between the selected paths' lidar effects and actual vehicle-mounted sensor responses in the field would indicate that additional correction terms are needed.
Load-bearing premise
The joint distribution of drop size and velocity collected from real rainfall samples is treated as a valid reference that can be used to judge the credibility of any simulated rainfall path.
What would settle it
If a new set of raindrop-spectrum samples collected under different real-rain conditions produces a different ranking of the same six paths when the method is reapplied, the claim that the reference distribution reliably ranks simulated paths would be falsified.
Figures
read the original abstract
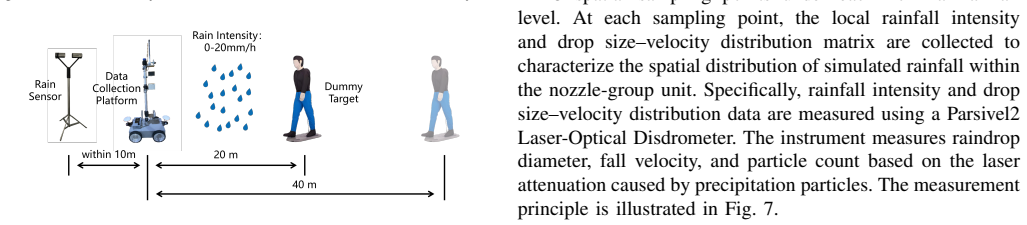
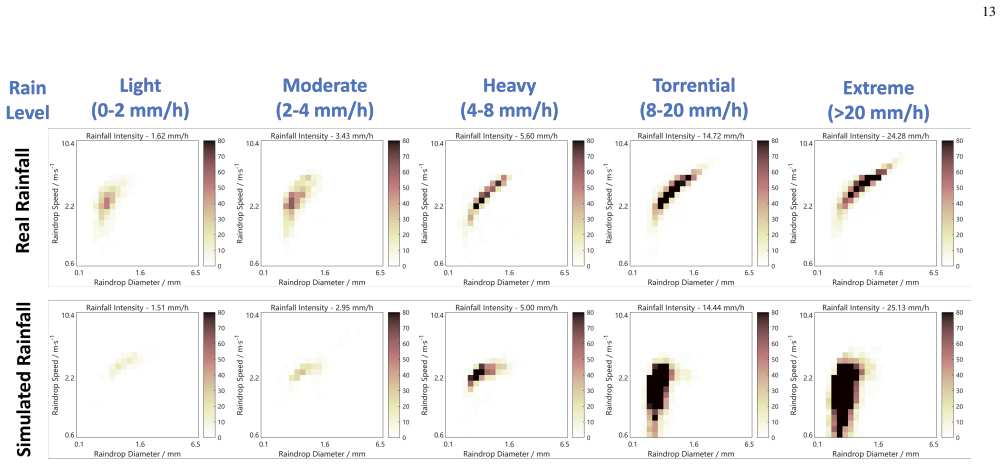
Credible simulated-rainfall conditions are essential for identifying perception-system boundaries and supporting SOTIF-oriented risk assessment in automated driving. However, closed-field tests are often described only by nominal rainfall intensity or single-point measurements, making it difficult to align simulated rain fields with real rainfall and map test results to real-world scenarios. This paper proposes a path-based credibility evaluation method for simulated rainfall in autonomous-driving perception tests. Using the drop size and velocity joint distribution of real rainfall as the reference, each candidate path is represented by path-equivalent rainfall intensity, an uncertainty band, and a path-averaged Realism of Raindrop Distribution (RRD) score. Lidar target point-cloud count and mean reflectivity are further used for perception-consistency correction, quantifying the proxy capability of each simulated-rainfall path for real-rainfall perception effects. Experiments are conducted using about 10,000 real-rainfall raindrop-spectrum samples, 728 RainSense perception samples, and 45 spatial sampling points in a 2.4 m x 7.2 m simulated-rainfall area. Results show that spatial non-uniformity remains under the same nominal condition, confirming the need for path-based evaluation. The method identifies Path IV and Path VI as preferable candidates, with results of 11.54 +/- 0.31 mm/h, RRD = 0.43, and 8.28 +/- 0.34 mm/h, RRD = 0.46, respectively. These paths show more balanced performance in rainfall-intensity stability, raindrop-spectrum realism, and perception consistency. The proposed method supports path selection, condition description, and credible interpretation of autonomous-driving perception tests under rainfall.
Editorial analysis
A structured set of objections, weighed in public.
Referee Report
Summary. The paper proposes a path-based credibility evaluation framework for simulated rainfall in autonomous-driving perception tests. Using the joint drop-size/velocity distribution from ~10,000 real-rainfall samples as reference, each candidate path is characterized by a path-equivalent rainfall intensity (with uncertainty band), a path-averaged Realism of Raindrop Distribution (RRD) score, and a perception-consistency correction derived from Lidar point-cloud count and mean reflectivity. Experiments over a 2.4 m × 7.2 m area with 45 spatial points and 728 RainSense samples identify Path IV (11.54 ± 0.31 mm/h, RRD = 0.43) and Path VI (8.28 ± 0.34 mm/h, RRD = 0.46) as preferable for balanced intensity stability, raindrop-spectrum realism, and perception consistency.
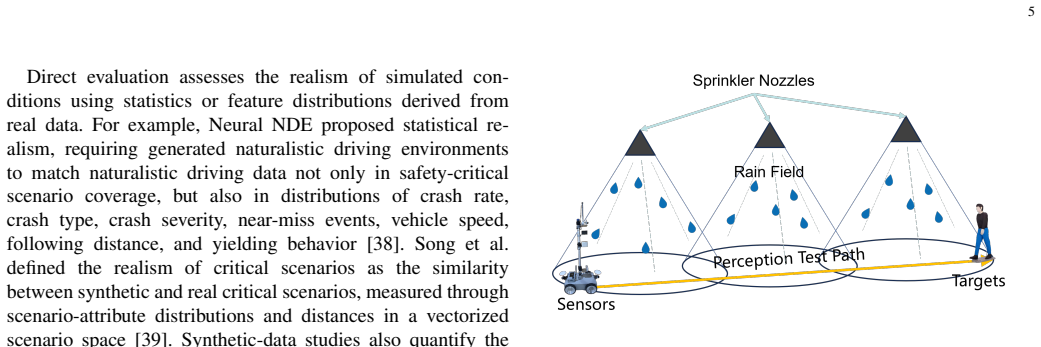
Significance. If the reference distribution proves representative, the framework supplies a concrete, data-driven alternative to nominal-intensity descriptions, enabling better alignment of closed-field tests with real-world perception effects and supporting SOTIF-oriented risk assessment. The empirical grounding via real-rainfall samples and the joint use of intensity, RRD, and Lidar proxies constitute a methodological advance over single-point characterizations.
major comments (3)
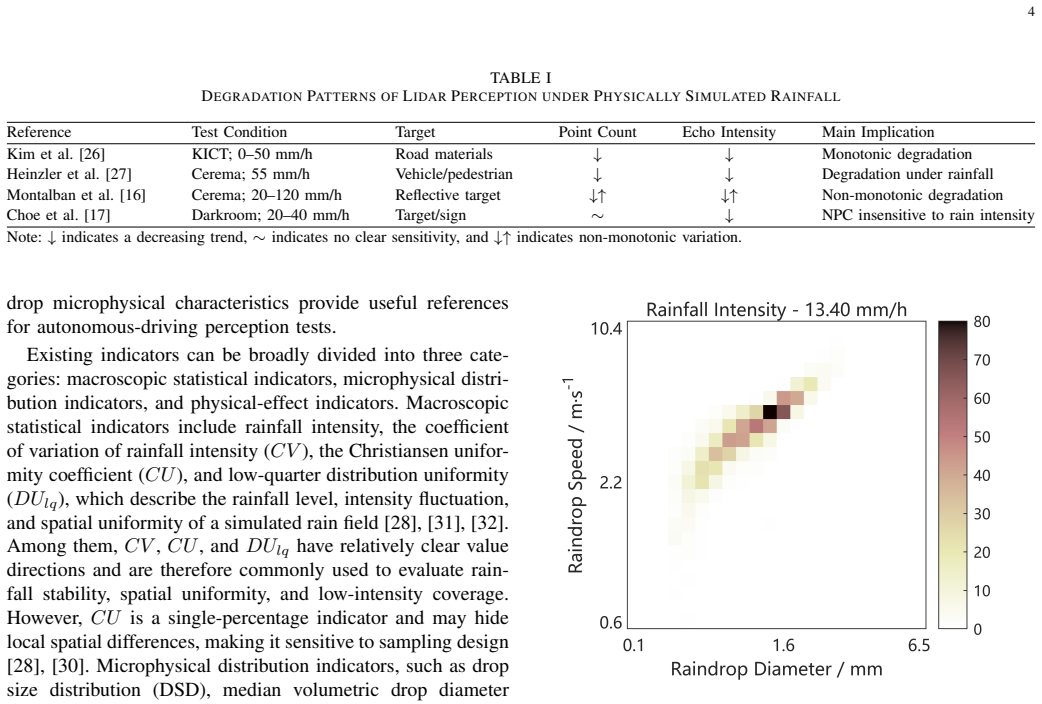
- [Abstract and Experiments section (description of real-rainfall samples)] The central claim that Paths IV and VI are preferable rests on treating the collected joint distribution as a valid, scenario-representative reference. No evidence is supplied that the ~10,000 samples span the intensity range, drop behaviors, or environmental conditions typical of autonomous-driving tests (e.g., no comparison to standard Marshall-Palmer or other empirical distributions, no stratification by rainfall rate).
- [Methods (RRD definition)] The definition and computation of the RRD score are not provided in sufficient detail to assess whether it is a parameter-free metric or reduces to a fitted quantity; the abstract introduces it as an invented entity without an explicit formula or distance measure relative to the reference distribution.
- [Perception-consistency correction and Results] Error propagation for the reported ±0.31 mm/h and ±0.34 mm/h bands is not described, nor is the validation that the Lidar-based corrections (point-cloud count and mean reflectivity) actually predict perception effects rather than merely correlating with them.
minor comments (2)
- [Experiments] Clarify the exact spatial sampling strategy for the 45 points within the 2.4 m × 7.2 m area and how path averaging is performed.
- [Methods] Add a reference or brief justification for choosing the particular Lidar metrics (point-cloud count and mean reflectivity) as proxies for perception consistency.
Simulated Author's Rebuttal
We thank the referee for the constructive comments and detailed review. We address each major comment below with point-by-point responses. We agree that the manuscript requires additional details and supporting analyses for the reference distribution, RRD definition, and error propagation, and will revise accordingly.
read point-by-point responses
-
Referee: The central claim that Paths IV and VI are preferable rests on treating the collected joint distribution as a valid, scenario-representative reference. No evidence is supplied that the ~10,000 samples span the intensity range, drop behaviors, or environmental conditions typical of autonomous-driving tests (e.g., no comparison to standard Marshall-Palmer or other empirical distributions, no stratification by rainfall rate).
Authors: We acknowledge that the current manuscript does not include direct comparisons to standard distributions such as Marshall-Palmer or stratification by rainfall rate. The ~10,000 samples were collected from real rainfall to capture empirical joint distributions, but explicit validation of coverage is absent. We will add these comparisons and a discussion of sample representativeness in the revised Experiments section. revision: yes
-
Referee: The definition and computation of the RRD score are not provided in sufficient detail to assess whether it is a parameter-free metric or reduces to a fitted quantity; the abstract introduces it as an invented entity without an explicit formula or distance measure relative to the reference distribution.
Authors: The RRD score is defined in the Methods section as a path-averaged realism metric based on the joint drop-size/velocity distribution relative to the reference. We agree the description lacks sufficient explicit detail on the formula and distance measure. We will expand the Methods with the precise definition and computation steps to clarify that it is a parameter-free metric. revision: yes
-
Referee: Error propagation for the reported ±0.31 mm/h and ±0.34 mm/h bands is not described, nor is the validation that the Lidar-based corrections (point-cloud count and mean reflectivity) actually predict perception effects rather than merely correlating with them.
Authors: The uncertainty bands are derived from variability across spatial points and samples, but the propagation method is not detailed. We will add this description in the Results. The Lidar metrics are used as proxies for perception consistency; we will clarify their correlative role, add limitations on predictive validation, and note the need for future studies. revision: partial
Circularity Check
No circularity: evaluation derives from independent real-rainfall reference samples
full rationale
The paper's method computes path-equivalent intensity, uncertainty bands, and RRD scores by direct comparison against an external joint distribution collected from ~10,000 real-rainfall samples. These quantities are not fitted parameters renamed as predictions, nor are they defined in terms of the simulated-path outputs themselves. No self-citations, uniqueness theorems, or ansatzes are invoked to justify the reference or the metrics; the derivation chain remains self-contained against the stated real-world samples and lidar measurements. The ranking of paths follows from these comparisons rather than reducing to the inputs by construction.
Axiom & Free-Parameter Ledger
axioms (1)
- domain assumption Drop size and velocity joint distribution from real rainfall samples is the appropriate reference for simulated rain credibility.
invented entities (1)
-
Realism of Raindrop Distribution (RRD) score
no independent evidence
Reference graph
Works this paper leans on
-
[1]
ISO 34502:2022 Road vehicles—Test scenarios for automated driving systems—Scenario- based safety evaluation framework
International Organization for Standardization. ISO 34502:2022 Road vehicles—Test scenarios for automated driving systems—Scenario- based safety evaluation framework. Geneva: ISO, 2022
2022
-
[2]
ISO 34503:2023 Road vehicles—Test scenarios for automated driving systems—Specification for operational design domain
International Organization for Standardization. ISO 34503:2023 Road vehicles—Test scenarios for automated driving systems—Specification for operational design domain. Geneva: ISO, 2023
2023
-
[3]
ISO 21448:2022 Road vehicles—Safety of the intended functionality
International Organization for Standardization. ISO 21448:2022 Road vehicles—Safety of the intended functionality. Geneva: ISO, 2022
2022
-
[4]
ISO/DIS 13228:2026 Road vehicles – Test method for automotive LiDAR[S]
International Organization for Standardization. ISO/DIS 13228:2026 Road vehicles – Test method for automotive LiDAR[S]. Geneva: In- ternational Organization for Standardization, 2026
2026
-
[5]
About PEGASUS
PEGASUS Project. About PEGASUS. [Online]. Available: https://www. pegasusprojekt.de/en/about-PEGASUS. Accessed: May 25, 2026. 17
2026
-
[6]
New Assessment/Test Method for Automated Driving (NATM): Master Document
United Nations Economic Commission for Europe. New Assessment/Test Method for Automated Driving (NATM): Master Document. Geneva: UNECE, 2021. [Online]. Available: https://unece.org/transport/documents/2021/04/working-documents/ grva-new-assessmenttest-method-automated-driving-natm. Accessed: May 25, 2026
2021
-
[7]
A survey on scenario-based testing for automated driving systems in high- fidelity simulation,
Z. Zhong, Y . Tang, Y . Zhou, V . de Oliveira Neves, Y . Liu, and B. Ray, “A survey on scenario-based testing for automated driving systems in high- fidelity simulation,”arXiv preprint arXiv:2112.00964, 2021. [Online]. Available: https://arxiv.org/abs/2112.00964
arXiv 2021
-
[9]
Available: https://arxiv.org/abs/2103.02760
[Online]. Available: https://arxiv.org/abs/2103.02760
-
[10]
Perception and sensing for autonomous vehicles under adverse weather conditions: A survey,
Y . Zhang, A. Carballo, H. Yang, and K. Takeda, “Perception and sensing for autonomous vehicles under adverse weather conditions: A survey,” ISPRS Journal of Photogrammetry and Remote Sensing, vol. 196, pp. 146–177, 2023. [Online]. Available: https://doi.org/10.1016/j.isprsjprs. 2022.12.021
-
[11]
Mcity Test Facility
University of Michigan. Mcity Test Facility. [Online]. Available: https: //mcity.umich.edu/what-we-do/mcity-test-facility/. Accessed: May 25, 2026
2026
-
[12]
Specific Environment Area: Jtown
Japan Automobile Research Institute. Specific Environment Area: Jtown. [Online]. Available: https://www.jari.or.jp/en/test-courses/jtown/46111/. Accessed: May 25, 2026
2026
-
[13]
Connected & Automated Vehicle Test-bed K-City
Korea Automobile Testing & Research Institute. Connected & Automated Vehicle Test-bed K-City. [Online]. Available: https://www.jasic.org/meeting docs admin/contents/uploads/doc/ meeting2/20%20K-City Korea.pdf. Accessed: May 25, 2026
2026
-
[14]
Rain System
Technische Hochschule Ingolstadt. Rain System. [Online]. Avail- able: https://www.thi.de/en/research/carissma/laboratories/rain-system/. Accessed: May 25, 2026
2026
-
[15]
Automotive LiDAR performance verification in fog and rain,
M. Kutila, P. Pyyk ¨onen, H. Holzh ¨uter, M. Colomb, and P. Duthon, “Automotive LiDAR performance verification in fog and rain,” in Proc. 21st IEEE International Conference on Intelligent Transportation Systems (ITSC), Maui, HI, USA, 2018, pp. 1695–1701
2018
-
[16]
A review of Cerema PA VIN fog & rain platform: From past and back to the future,
S. Liandrat, P. Duthon, F. Bernardin, A. Ben-Daoued, and J.-L. Bicard, “A review of Cerema PA VIN fog & rain platform: From past and back to the future,” inProc. ITS World Congress, 2022
2022
-
[17]
A quantitative analysis of point clouds from automotive lidars exposed to artificial rain and fog,
K. Montalban, C. Reymann, D. Atchuthan, et al., “A quantitative analysis of point clouds from automotive lidars exposed to artificial rain and fog,” Atmosphere, vol. 12, no. 6, Art. no. 738, 2021
2021
-
[18]
Performance verification of autonomous driving LiDAR sensors under rainfall conditions in darkroom,
J. Choe, H. Cho, and Y . Chung, “Performance verification of autonomous driving LiDAR sensors under rainfall conditions in darkroom,”Sensors, vol. 24, no. 1, Art. no. 14, 2024
2024
-
[19]
The effect of rainfall and illumination on automotive sensors detection performance,
H. Li, N. Bamminger, Z. F. Magosi, C. Feichtinger, Y . Zhao, T. Mihalj, F. Orucevic, and A. Eichberger, “The effect of rainfall and illumination on automotive sensors detection performance,”Sustainability, vol. 15, no. 9, Art. no. 7260, 2023
2023
-
[20]
Investigation of automotive LiDAR vision in rain from material and optical perspectives,
W. Y . Pao, J. Howorth, L. Li, M. Agelin-Chaab, L. Roy, J. Knutzen, A. Baltazar-y-Jimenez, and K. Muenker, “Investigation of automotive LiDAR vision in rain from material and optical perspectives,”Sensors, vol. 24, no. 10, Art. no. 2997, 2024
2024
-
[21]
Predicting the influence of adverse weather on pedestrian detection with automotive radar and lidar sensors,
D. Weihmayr, F. Sezgin, L. Tolksdorf, C. Birkner, and R. N. Jazar, “Predicting the influence of adverse weather on pedestrian detection with automotive radar and lidar sensors,” inProc. IEEE Intelligent Vehicles Symposium (IV), Jeju Island, Korea, 2024, pp. 2591–2597
2024
-
[22]
Analysis of rain clutter detections in commercial 77 GHz automotive radar,
R. Gourova, O. Krasnov, and A. Yarovoy, “Analysis of rain clutter detections in commercial 77 GHz automotive radar,” inProc. European Radar Conference (EURAD), Nuremberg, Germany, 2017, pp. 49–52
2017
-
[23]
Phenomenological modeling of millimeter- wave automotive radar,
Z. Slavik and K. V . Mishra, “Phenomenological modeling of millimeter- wave automotive radar,” inProc. URSI Asia-Pacific Radio Science Conference (AP-RASC), New Delhi, India, 2019, pp. 1–4
2019
-
[24]
D3.2 Reference Dataset of Measured Weather Characteristics
ROADVIEW Consortium. D3.2 Reference Dataset of Measured Weather Characteristics. ROADVIEW Project, 2024. [Online]. Available: https://roadview-project.eu/wp-content/uploads/sites/59/ 2024/05/ROADVIEW Deliverable 3.2 v3.pdf. Accessed: May 25, 2026
2024
-
[25]
Test method- ology for rain influence on automotive surround sensors,
S. Hasirlioglu, A. Kamann, I. Doric, and T. Brandmeier, “Test method- ology for rain influence on automotive surround sensors,” inProc. IEEE 19th International Conference on Intelligent Transportation Systems (ITSC), Rio de Janeiro, Brazil, 2016, pp. 2242–2247
2016
-
[26]
Influences of weather phenomena on automotive laser radar systems,
R. H. Rasshofer, M. Spies, and H. Spies, “Influences of weather phenomena on automotive laser radar systems,”Advances in Radio Science, vol. 9, pp. 49–60, 2011
2011
-
[27]
Performance of mobile LiDAR in real road driving conditions,
J. Kim, B. J. Park, C. G. Roh, and Y . Kim, “Performance of mobile LiDAR in real road driving conditions,”Sensors, vol. 21, no. 22, Art. no. 7461, 2021
2021
-
[28]
Weather influence and classification with automotive lidar sensors,
R. Heinzler, P. Schindler, J. Seekircher, W. Ritter, and W. Stork, “Weather influence and classification with automotive lidar sensors,” inProc. IEEE Intelligent Vehicles Symposium (IV), Paris, France, 2019, pp. 1527–1534
2019
-
[29]
Christiansen uniformity revisited: Re-thinking uniformity assessment in rainfall simulator studies,
D. Green and I. Pattison, “Christiansen uniformity revisited: Re-thinking uniformity assessment in rainfall simulator studies,”Catena, vol. 217, Art. no. 106424, 2022
2022
-
[30]
European small portable rainfall simulators: A comparison of rainfall characteristics,
T. Iserloh, J. B. Ries, J. Arn ´aez, et al., “European small portable rainfall simulators: A comparison of rainfall characteristics,”Catena, vol. 110, pp. 100–112, 2013
2013
-
[31]
Semi-variograms provide superior spatial and temporal insights into artificial rainfall compared to Christiansen uniformity,
J. F. Kub ´at, M. Neumann, and P. Kavka, “Semi-variograms provide superior spatial and temporal insights into artificial rainfall compared to Christiansen uniformity,”Journal of Hydrology, vol. 653, Art. no. 132740, 2025
2025
-
[32]
A comparison of two variable intensity rainfall simulators for runoff studies,
F. J. P ´erez-Latorre, L. de Castro, and A. Delgado, “A comparison of two variable intensity rainfall simulators for runoff studies,”Soil & Tillage Research, vol. 107, pp. 11–16, 2010
2010
-
[33]
The Wagenin- gen Rainfall Simulator: Set-up and calibration of an indoor nozzle- type rainfall simulator for soil erosion studies,
T. Lassu, M. Seeger, P. Peters, and S. D. Keesstra, “The Wagenin- gen Rainfall Simulator: Set-up and calibration of an indoor nozzle- type rainfall simulator for soil erosion studies,”Land Degradation & Development, vol. 26, pp. 604–612, 2015
2015
-
[34]
Evaluation of kinetic energy and erosivity potential of simu- lated rainfall using Laser Precipitation Monitor,
D. T. Meshesha, A. Tsunekawa, M. Tsubo, N. Haregeweyn, and F. Tegegne, “Evaluation of kinetic energy and erosivity potential of simu- lated rainfall using Laser Precipitation Monitor,”Catena, vol. 137, pp. 237–243, 2016
2016
-
[35]
A rainfall simulator for laboratory-scale assessment of rainfall-runoff-sediment transport pro- cesses over a two-dimensional flume,
H. Aksoy, N. E. Unal, S. Cokgor, et al., “A rainfall simulator for laboratory-scale assessment of rainfall-runoff-sediment transport pro- cesses over a two-dimensional flume,”Catena, vol. 98, pp. 63–72, 2012
2012
-
[36]
Design of a pressurized rainfall simulator for evaluating performance of erosion control prac- tices,
M. D. Ricks, M. A. Horne, B. Faulkner, et al., “Design of a pressurized rainfall simulator for evaluating performance of erosion control prac- tices,”Water, vol. 11, Art. no. 2386, 2019
2019
-
[37]
Setup and calibration of the rainfall simulator of the Masse experimental station for soil erosion studies,
L. Vergni, F. Todisco, and A. Vinci, “Setup and calibration of the rainfall simulator of the Masse experimental station for soil erosion studies,” Catena, vol. 167, pp. 448–455, 2018
2018
-
[38]
Sim-to-real transfer and re- ality gap modeling in model predictive control for autonomous driving,
I. G. Daza, A. Lahrech, M. Langer, et al., “Sim-to-real transfer and re- ality gap modeling in model predictive control for autonomous driving,” Applied Intelligence, vol. 53, pp. 26308–26327, 2023
2023
-
[39]
Learning naturalistic driving environment with statistical realism,
X. Yan, Z. Zou, S. Feng, H. Zhu, H. Sun, and H. X. Liu, “Learning naturalistic driving environment with statistical realism,”Nature Com- munications, vol. 14, Art. no. 2037, 2023
2037
-
[40]
Synthetic versus real: An analysis of critical scenarios for autonomous vehicle testing,
Q. Song, A. Bensoussan, and M. R. Mousavi, “Synthetic versus real: An analysis of critical scenarios for autonomous vehicle testing,”Automated Software Engineering, vol. 32, Art. no. 37, 2025
2025
-
[41]
A style-based metric for quantifying the synthetic-to-real gap in autonomous driving image datasets,
D. Yao, X. Han, R. Ming, et al., “A style-based metric for quantifying the synthetic-to-real gap in autonomous driving image datasets,”arXiv preprint arXiv:2510.10203, 2025
arXiv 2025
-
[42]
Virtual worlds as proxy for multi-object tracking analysis,
A. Gaidon, Q. Wang, Y . Cabon, and E. Vig, “Virtual worlds as proxy for multi-object tracking analysis,” inProc. IEEE Conference on Computer Vision and Pattern Recognition (CVPR), Las Vegas, NV , USA, 2016, pp. 4340–4349
2016
-
[43]
RadSimReal: Bridging the gap between synthetic and real data in radar object detection with simulation,
O. Bialer and Y . Haitman, “RadSimReal: Bridging the gap between synthetic and real data in radar object detection with simulation,” in Proc. IEEE/CVF Conference on Computer Vision and Pattern Recogni- tion (CVPR), Seattle, W A, USA, 2024, pp. 18426–18435
2024
-
[44]
S2R- Bench: A sim-to-real evaluation benchmark for autonomous driving,
L. Wang, G. Yang, L. Yang, Z. Song, X. Zhang, Y . Chen, et al., “S2R- Bench: A sim-to-real evaluation benchmark for autonomous driving,” Scientific Data, vol. 12, Art. no. 2006, 2025
2006
-
[45]
RainSense: An autonomous driving environmental perception dataset with rain intensity annotations,
T. Xia, X. Yang, T. Chen, L. Zhang, S. Ye, and J. Chen, “RainSense: An autonomous driving environmental perception dataset with rain intensity annotations,” inProc. SAE 2025 Intelligent and Connected Vehicles Symposium, Dec. 2025, Paper 380715
2025
discussion (0)
Sign in with ORCID, Apple, or X to comment. Anyone can read and Pith papers without signing in.