Deep learning-based compression of giga-resolution whole slide images
Pith reviewed 2026-05-20 13:29 UTC · model grok-4.3
The pith
Deep learning compression reduces whole slide image file sizes by 43-72 percent compared to JPEG while preserving diagnostic quality.
A machine-rendered reading of the paper's core claim, the machinery that carries it, and where it could break.
Core claim
Deep learning-based tissue segmentation followed by learned compression reduces whole slide image sizes by 43-72 percent relative to JPEG alone, and by up to 80 percent when glass is also removed, while maintaining average SSIM above 0.95 on tissue patches; the same models outperform JPEG-XL and JPEG-2000 on compression ratio but require longer decompression times.
What carries the argument
Deep learning models trained for tissue segmentation to isolate glass and for end-to-end image compression on patches extracted from whole slide images.
If this is right
- Deep learning compression yields 43-72 percent smaller files than JPEG on full-resolution pyramids.
- Replacing glass with uniform pixels or empty tiles adds 6-62 percent extra savings depending on the codec.
- On isolated tissue patches the best learned codecs save 35-40 percent over JPEG while keeping SSIM above 0.95.
- JPEG-XL and JPEG-2000 achieve only 17 percent and 14 percent savings respectively on the same patches.
- Decompression of the learned models takes longer than JPEG or JPEG-XL.
Where Pith is reading between the lines
- Pathology archives could store several times more slides in the same disk space or transmit them faster over networks.
- Real-time remote consultation becomes more practical if decompression speed can be improved without losing compression gains.
- The approach may extend to other high-resolution biomedical imaging modalities that contain large background regions.
- A production system would still need periodic retraining or domain adaptation when scanner hardware or staining changes.
Load-bearing premise
The segmentation and compression models, trained on the authors' chosen scanners and tissue types, will continue to deliver the reported size reductions and image quality on whole slide images from different laboratories or staining protocols.
What would settle it
Measure file size and SSIM on a held-out set of whole slide images scanned with a different vendor's microscope and stained with a different protocol; if average size reduction falls below 30 percent or SSIM drops below 0.90, the claimed advantage does not generalize.
Figures


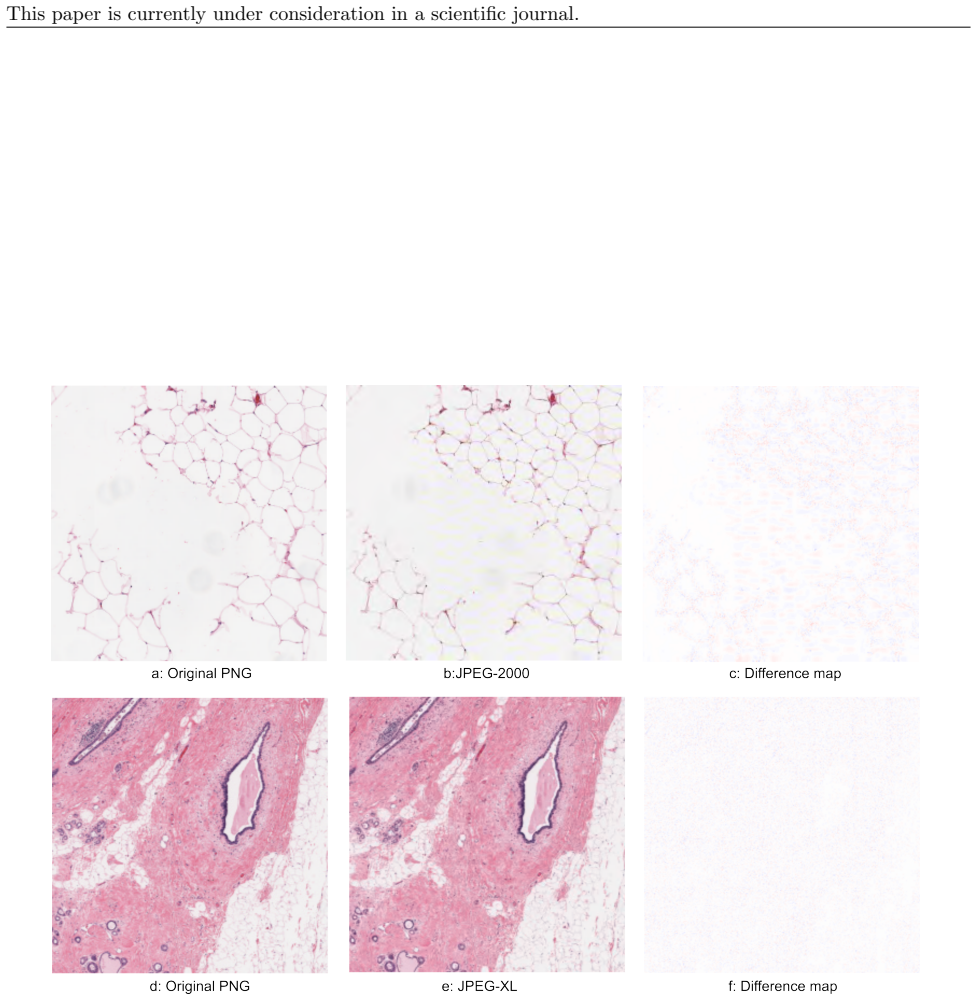


read the original abstract
Implementation of digital pathology leads to an increased number of whole slide images (WSIs). The large size of WSIs is challenging. Today, WSIs are compressed with codecs like JPEG resulting in several gigabytes per WSI, and large amounts of space are wasted storing glass. In this study, deep learning-based tissue segmentation for glass removal, and deep learning compression methods were explored and compared with JPEG, JPEG-2000 and JPEG-XL. Image pyramids (N=21) with intact glass, glass replaced by single-colored pixels, and glass replaced by zero-byte tiles were created and compressed with JPEG, JPEG-XL and a deep learning model. Additionally, several compression models were evaluated on a tissue patch dataset and compared with JPEG, JPEG-2000 and JPEG-XL. Removing glass reduced file sizes considerably for JPEG and JPEG-XL. Deep learning-based image compression reduced the WSI size by 43-72% compared to JPEG compression, whereas deep learning-based glass removal reduced the WSI size by 0.3-33%, and 6-62% using only single-colored pixels and removing all-glass tiles, respectively. Combining the two gave a small improvement to a 44-80% total size reduction which indicates that deep learning-based image compression is able to efficiently compress glass tiles, whereas JPEG is not. On the tissue patch dataset, the best deep learning-based compression models saved on average ~35-40% per patch compared to JPEG, while keeping an average SSIM above 0.95, whereas JPEG-XL and JPEG-2000 saved 17% and 14%, respectively while keeping an SSIM of 0.96. However, the deep learning models had higher decompression times than JPEG and JPEG-XL.
Editorial analysis
A structured set of objections, weighed in public.
Referee Report
Summary. The paper claims that deep learning-based tissue segmentation for glass removal and deep learning-based compression can substantially reduce WSI file sizes compared to JPEG, JPEG-2000, and JPEG-XL. On 21 image pyramids, DL compression yields 43-72% size reduction versus JPEG, glass removal yields 0.3-33% (or 6-62% with single-color/zero-byte tiles), and the combination reaches 44-80%; on a tissue patch dataset the best DL models save ~35-40% per patch at SSIM > 0.95 while JPEG-XL and JPEG-2000 save 17% and 14% at SSIM 0.96, albeit with higher decompression times.
Significance. If the reported size reductions prove robust, the work addresses a practical bottleneck in digital pathology by showing how DL methods can exploit the large glass regions and tissue statistics in WSIs to cut storage and transmission costs. The direct empirical comparisons on held-out pyramids and patches, together with concrete SSIM and file-size metrics, constitute a clear strength that could inform future codec design for giga-resolution medical images.
major comments (2)
- [Methods] The manuscript provides no details on the deep learning model architectures, training procedures, hyperparameters, or the split between training and held-out test images (N=21 pyramids and patch dataset). Without this information it is impossible to assess whether the claimed 43-72% and 35-40% savings are reproducible or overfit to the authors' scanners and staining protocols.
- [Results] No error bars, statistical significance tests, or cross-validation results are reported for the size-reduction figures in the abstract or results. This omission is load-bearing for the central quantitative claims, as the practical value of the 44-80% combined reduction cannot be judged without evidence of variability across images or scanners.
minor comments (2)
- [Abstract] The abstract states that DL models have higher decompression times than JPEG and JPEG-XL but does not report the actual times or discuss the resulting trade-off for clinical workflows.
- [Methods] Consider clarifying the exact definition of 'glass replaced by zero-byte tiles' versus 'single-colored pixels' when describing the three pyramid variants, as the 6-62% range depends on this distinction.
Simulated Author's Rebuttal
We thank the referee for the constructive feedback on reproducibility and statistical reporting. We address each major comment below and indicate the changes planned for the revised manuscript.
read point-by-point responses
-
Referee: [Methods] The manuscript provides no details on the deep learning model architectures, training procedures, hyperparameters, or the split between training and held-out test images (N=21 pyramids and patch dataset). Without this information it is impossible to assess whether the claimed 43-72% and 35-40% savings are reproducible or overfit to the authors' scanners and staining protocols.
Authors: We agree that the manuscript lacks sufficient methodological detail for reproducibility. In the revised version we will add a dedicated Methods section describing the deep learning architectures for compression and tissue segmentation (including network types, layer configurations, and any custom components), the training procedures and hyperparameters (optimizer, learning rate schedule, batch size, epochs, loss functions), the training datasets, and the explicit train/held-out splits for both the 21 pyramids and the tissue patch dataset. This will allow readers to evaluate potential scanner- or protocol-specific overfitting. revision: yes
-
Referee: [Results] No error bars, statistical significance tests, or cross-validation results are reported for the size-reduction figures in the abstract or results. This omission is load-bearing for the central quantitative claims, as the practical value of the 44-80% combined reduction cannot be judged without evidence of variability across images or scanners.
Authors: We acknowledge the absence of error bars and formal statistical tests. The reported ranges (43-72%, 44-80%) already reflect observed variation across the 21 pyramids, but we will add explicit error bars (standard deviation or interquartile range) to the size-reduction metrics in the revised results and figures. Full k-fold cross-validation on giga-resolution WSIs is computationally prohibitive; however, we will clarify the use of held-out pyramids and patches and, where feasible, report basic measures of variability or pairwise comparisons. We believe the direct empirical comparisons remain informative but will strengthen the statistical presentation as requested. revision: partial
Circularity Check
No circularity: empirical compression results on held-out data
full rationale
The paper performs standard empirical evaluation: deep learning segmentation and compression models are trained on the authors' tissue patch and WSI datasets, then tested via direct file-size and SSIM measurements against JPEG/JPEG-XL baselines on held-out pyramids and patches. No derivation chain, equations, or predictions are presented that reduce to fitted inputs by construction. Claims of 43-72% size reduction etc. are reported outcomes of these comparisons, not self-referential definitions or self-citation load-bearing steps. The work is self-contained against external benchmarks (JPEG codecs) with no evident circularity patterns.
Axiom & Free-Parameter Ledger
free parameters (1)
- Deep learning model architecture and training hyperparameters
axioms (1)
- domain assumption Deep neural networks can learn domain-specific image compression that outperforms standard codecs on pathology slides while preserving diagnostic quality as measured by SSIM.
Lean theorems connected to this paper
-
IndisputableMonolith/Cost/FunctionalEquation.leanwashburn_uniqueness_aczel unclear?
unclearRelation between the paper passage and the cited Recognition theorem.
Deep learning-based image compression reduced the WSI size by 43-72% compared to JPEG compression, whereas deep learning-based glass removal reduced the WSI size by 0.3-33%, and 6-62% using only single-colored pixels and removing all-glass tiles, respectively.
-
IndisputableMonolith/Foundation/AlphaCoordinateFixation.leanJ_uniquely_calibrated_via_higher_derivative unclear?
unclearRelation between the paper passage and the cited Recognition theorem.
The models trained on pathology data were trained from scratch over 130 epochs, with the Adam optimizer and an initial learning rate of 1e-4. The loss function was a rate distortion loss
What do these tags mean?
- matches
- The paper's claim is directly supported by a theorem in the formal canon.
- supports
- The theorem supports part of the paper's argument, but the paper may add assumptions or extra steps.
- extends
- The paper goes beyond the formal theorem; the theorem is a base layer rather than the whole result.
- uses
- The paper appears to rely on the theorem as machinery.
- contradicts
- The paper's claim conflicts with a theorem or certificate in the canon.
- unclear
- Pith found a possible connection, but the passage is too broad, indirect, or ambiguous to say the theorem truly supports the claim.
Reference graph
Works this paper leans on
-
[1]
2022.url:https://doi.org/10.7937/DJG7-GZ87
Cancer Moonshot Biobank.Cancer Moonshot Biobank – Colorectal Cancer Collection (CMB-CRC) (Ver- sion 7) [Dataset]. 2022.url:https://doi.org/10.7937/DJG7-GZ87
-
[2]
Cancer Moonshot Biobank.Cancer Moonshot Biobank – Lung Cancer Collection (CMB-LCA) (Version
-
[3]
2022.url:https://doi.org/10.7937/3CX3-S132
[Dataset]. 2022.url:https://doi.org/10.7937/3CX3-S132
-
[4]
Cancer Moonshot Biobank.Cancer Moonshot Biobank – Prostate Cancer Collection (CMB-PCA) (Version
-
[5]
2022.url:https://doi.org/10.7937/25T7-6Y12
[Dataset]. 2022.url:https://doi.org/10.7937/25T7-6Y12
-
[6]
The Cancer Imaging Archive (TCIA): maintaining and operating a public informa- tion repository
Kenneth Clark et al. “The Cancer Imaging Archive (TCIA): maintaining and operating a public informa- tion repository”. In:Journal of digital imaging26 (2013), pp. 1045–1057
work page 2013
-
[7]
Saman Farahmand et al. “HER2 and trastuzumab treatment response H&E slides with tumor ROI anno- tations (Version 3) [Data set]”. In: (2022).url:https://doi.org/10.7937/E65C-AM96
-
[8]
X. Han, J. Liu Y. abd Chen, and D Kang.Multimodal imaging of ductal carcinoma in situ with microin- vasion (HE-vs-MPM) (Version 1) [Data set]. 2023.url:https://doi.org/10.7937/3FYC-AC78
-
[9]
2020.url:https://doi.org/10.7937/TCIA.YZWQ-ZZ63
National Cancer Institute Clinical Proteomic Tumor Analysis Consortium (CPTAC).The Clinical Pro- teomic Tumor Analysis Consortium Colon Adenocarcinoma Collection (CPTAC-COAD) (Version 1) [Data set]. 2020.url:https://doi.org/10.7937/TCIA.YZWQ-ZZ63
-
[10]
2020.url:https://doi.org/10.7937/TCIA.ZS4A-JD58
National Cancer Institute Clinical Proteomic Tumor Analysis Consortium (CPTAC).The Clinical Pro- teomic Tumor Analysis Consortium Ovarian Serous Cystadenocarcinoma Collection (CPTAC-OV) (Ver- sion 3) [Data set]. 2020.url:https://doi.org/10.7937/TCIA.ZS4A-JD58
-
[11]
2018.url:https://doi.org/10.7937/K9/TCIA.2018.SC20FO18
National Cancer Institute Clinical Proteomic Tumor Analysis Consortium (CPTAC).The Clinical Pro- teomic Tumor Analysis Consortium Pancreatic Ductal Adenocarcinoma Collection (CPTAC-PDA) (Ver- sion 14) [Data set]. 2018.url:https://doi.org/10.7937/K9/TCIA.2018.SC20FO18
-
[12]
2019.url:https://doi.org/10.7937/K9/TCIA.2018.3R3JUISW
National Cancer Institute Clinical Proteomic Tumor Analysis Consortium (CPTAC).The Clinical Pro- teomic Tumor Analysis Consortium Uterine Corpus Endometrial Carcinoma Collection (CPTAC-UCEC) (Version 12) [Data set]. 2019.url:https://doi.org/10.7937/K9/TCIA.2018.3R3JUISW
discussion (0)
Sign in with ORCID, Apple, or X to comment. Anyone can read and Pith papers without signing in.