REVIEW 3 major objections 5 minor 131 references
Into the Darkness: Classical and Type II Cepheids in the Zona Galactica Incognita
T0 review · 3 major / 5 minor · reviewed 2026-08-14 · deepseek-v4-flash
Pith's one-line read This paper reports the discovery of 640 distant classical Cepheids and more than 500 type II Cepheids in the heavily obscured inner Galaxy and far side of the Milky Way disk, and uses them to measure the near-infrared extinction law and…
desk verdict A major far-side Cepheid catalog, but its distance scale rests on a single extinction-calibration assumption that deserves a stress test. read the letter →
The pith
A machine-rendered reading of the paper's core claim, the machinery that carries it, and where it could break.
The reading
What carries the argument
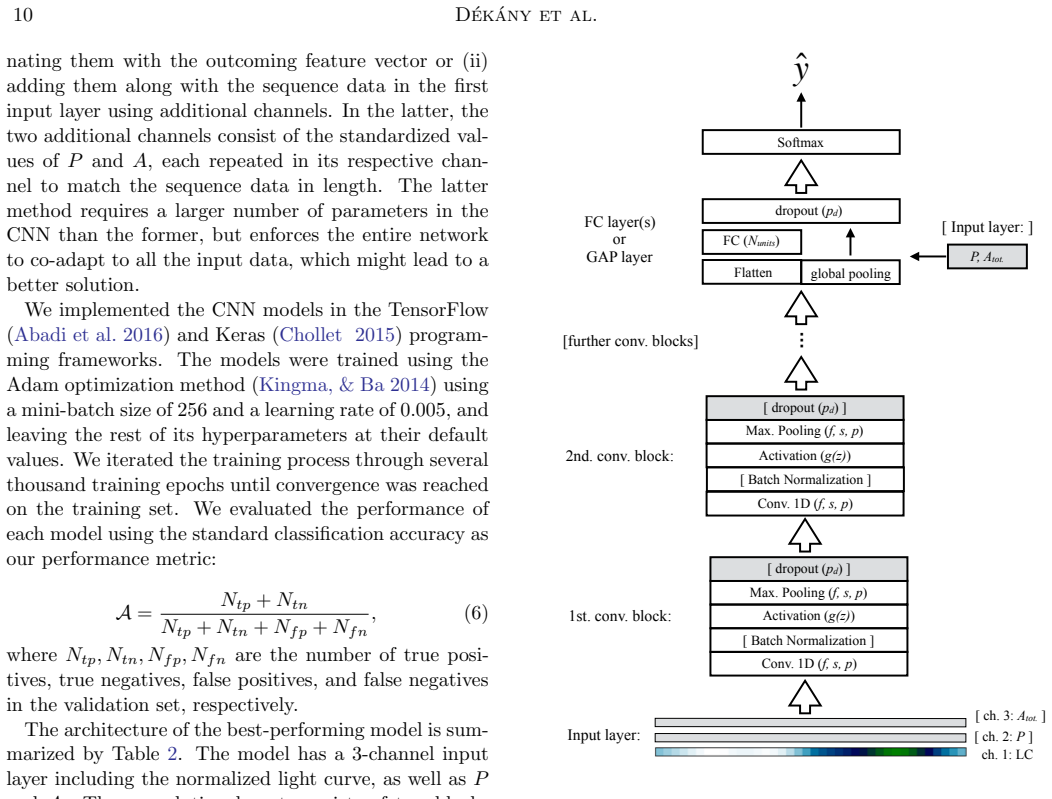
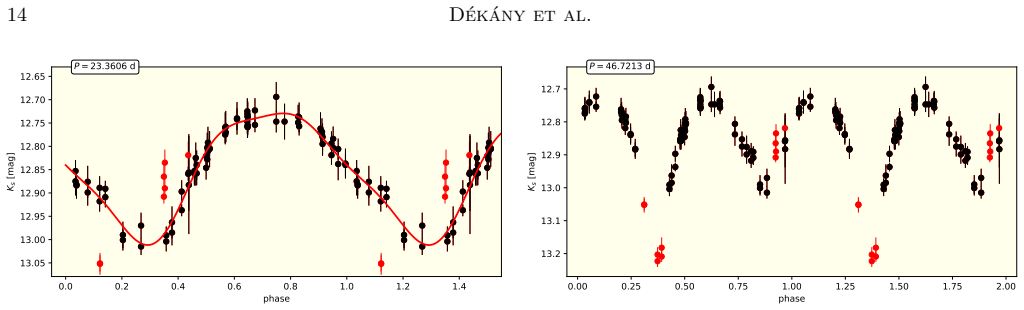
The central machinery is a convolutional neural network that treats a phase-folded, phase-aligned, standardized $K_s$-band light curve as a one-dimensional image, with the pulsation period and amplitude added as extra input channels; it classifies candidates as classical Cepheid, type II Cepheid, or non-Cepheid. A second neural network predicts the phase-dependent color corrections $\Delta(J-K_s)$ and $\Delta(H-K_s)$ from the $K_s$-band light-curve parameters, so that sparse $J$ and $H$ photometry can be converted into unbiased mean colors. What carries the distance argument is the near-infrared period-luminosity relation, the tight empirical connection between a Cepheid's pulsation period and its absolute brightness: it fixes the absolute magnitude from the period, so a measured $K_s$ magnitude and color give the extinction and the distance once the selective-to-absolute extinction ratio is known. That ratio is pinned down by assuming the bulge type II Cepheids are centrally symmetric around the Galactic center and tuning the ratio until the peak of their line-of-sight distance distribution matches the known Galactic-center distance.
What would settle it
Measure distances for the bright bulge type II Cepheids with independent geometric or trigonometric parallaxes and compare the peak of their line-of-sight distance distribution with the established Galactic-center distance of 8178 pc; a mismatch larger than the quoted uncertainties would show that the symmetry assumption used to set the extinction ratios is wrong.
Extended reading notes
Core claim
The central discovery is that stellar distance indicators can be found and used in the most obscured part of the Galaxy, the far side of the disk and the inner bulge. From five years of near-infrared time-series photometry of the southern Galactic plane, the paper reports 689 classical Cepheids (640 of them new) with extinctions reaching about 40 magnitudes in the visual, and 608 type II Cepheids, most in the bulge. A convolutional neural network separates the two classes from $K_s$-band light curves, and the authors estimate about 10% contamination in each sample. Using neural-network predictions of pulsation-phase color variation, the Cepheids become reddening tracers; the bulge type II Cepheids then yield mean extinction ratios $A(K_s)/E(J-K_s)=0.528\pm0.004$ (stat.) $\pm0.019$ (sys.) and $A(K_s)/E(H-K_s)=1.50\pm0.01$ (stat.) $\pm0.05$ (sys.), and reveal a near-infrared extinction curve that varies on roughly $5^\circ$ scales. With those distances, the classical Cepheids trace a warped, flared outer disk and a radial age gradient, while the type II Cepheids trace a centrally concentrated, slightly elongated old bulge population.
Load-bearing premise
The calibration of how much total extinction corresponds to a measured reddening assumes that the bulge type II Cepheids are spread symmetrically around the Galactic center along our line of sight; if their true distribution is lopsided or tilted with a density gradient, those extinction ratios and every distance built on them shift.
Editorial extensions
If this is right
- The far side of the Galactic disk now has stellar distance indicators out to roughly 20 kpc, so maps of the warp and flare no longer rely only on gas kinematics or near-side tracers.
- The mean near-infrared reddening ratio $E(J-K_s)/E(H-K_s)\simeq2.83$ agrees between the bulge and disk footprints, yet varies by about 2% on angular scales of about $5^\circ$ toward the bulge; distance work in the inner Galaxy therefore needs a spatially resolved extinction law.
- Bulge type II Cepheids form a centrally concentrated, slightly elongated old population whose inclination matches the inner RR Lyrae distribution, supporting a radius-dependent orientation of the old bulge.
- Cepheid ages in the far disk show a radial and vertical gradient: stars younger than about 70 Myr concentrate inside the Solar circle, while stars older than about 120 Myr are found outside it and farther from the plane.
- With the new extinction law, only 9 classical Cepheids lie within 3 kpc of the Galactic center and 3 within 2 kpc, so the earlier claim of a young disk crossing the inner Milky Way is no longer clearly supported.
Reading between the lines
- This suggests that applying the same convolutional-network classification and neural color-correction to near-infrared time-domain surveys of the northern mid-plane would turn the warp and flare measurements into a full 360-degree map of the disk, testable against gas-based spiral models.
- If the spatial variation of the near-infrared extinction law on $5^\circ$ scales is real, single-band distance estimates in the inner Galaxy carry an irreducible systematic error; this could be checked by comparing Cepheid distances with future precise parallaxes for a subsample.
- The symmetry-based extinction calibration could be stress-tested with a simulated triaxial bar: a tilted bar with a density gradient along the line of sight would bias the fitted extinction ratios, and the size of that bias could be quantified without new observations.
- The neural color-correction method should transfer to RR Lyrae stars and Miras, turning other pulsators into unbiased reddening tracers in crowded, highly extincted fields.
Signed reviews
Editorial analysis
A structured set of objections, weighed in public.
Referee Report
Summary. This paper presents a near-infrared census of classical and type II Cepheids in the VVV southern disk and inner-bulge footprint. The authors recalibrate the VVV photometry, build a convolutional-neural-network classifier on phase-folded Ks-band light curves using a training set of 188 classical and 356 type II Cepheids, apply it to about 40,000 candidates, visually inspect the outputs, and obtain a final sample of 689 classical Cepheids (640 new) and 608 type II Cepheids (over 500 in the inner bulge). They predict pulsation-phase color corrections with neural networks, derive the reddening ratio R_JKHK = 2.832 ± 0.004 and the selective-to-absolute extinction ratios R_KJK = 0.528 and R_KHK = 1.50 (Eqs. 22 and 24), compute heliocentric distances, and use the resulting three-dimensional distribution to trace the bulge population, the Galactic warp and flare, and radial and vertical age gradients in the far-side disk.
Significance. If the distances are reliable, this is a landmark data set: it populates the previously obscured far side of the Milky Way disk with standard candles, provides new constraints on the near-infrared extinction curve in the inner Galaxy, and offers the first Cepheid-based view of the warp, flare, and age structure beyond the Galactic center. The paper is unusually strong in data products and method transparency, with machine-readable light curves and catalogs, a careful discussion of VVV photometric zero-point problems, and a synthetic-noise validation of the classifier. The central scientific payoff, however, rests on the Sect. 4.3 extinction-ratio calibration, whose symmetry and completeness assumptions are not validated against plausible lopsided bulge models or the survey's own strong extinction gradient. The quoted systematic uncertainties are internal to the estimator and cannot capture a biased distance mode, so the distance scale and all downstream spatial-structure conclusions require a robustness test before the census can be taken at face value.
major comments (3)
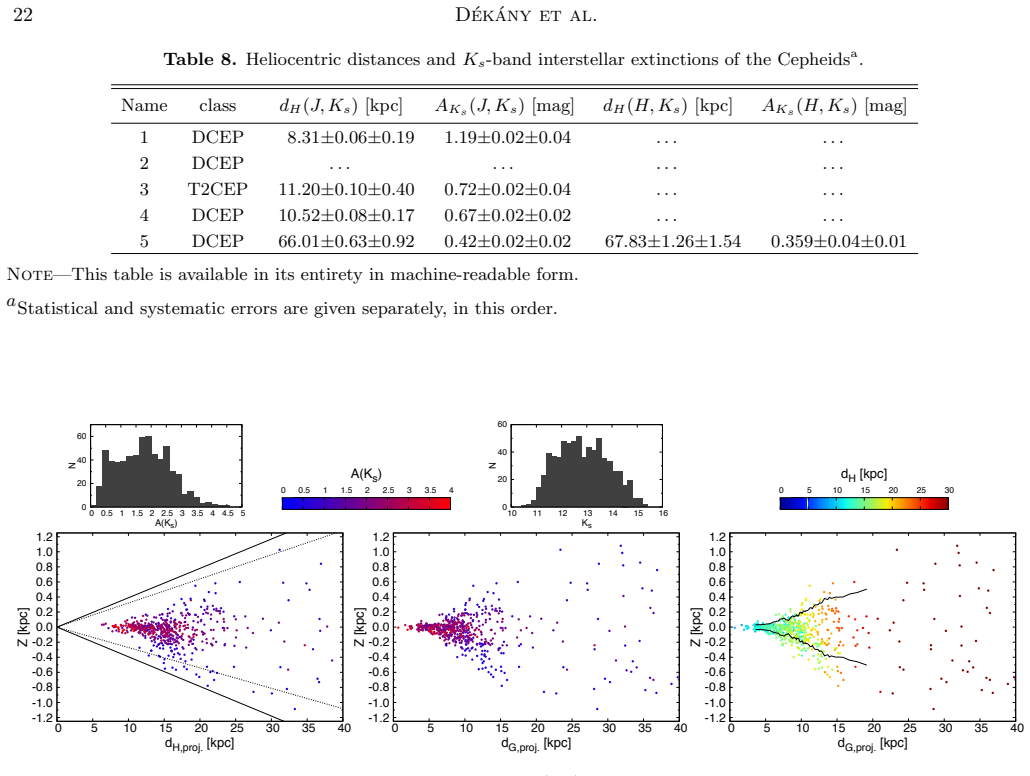
- [Sect. 4.3, Eqs. (22)-(24), Table 8] The calibration of R_KJK = A(Ks)/E(J-Ks) is obtained by forcing the KDE peak of dY = d_H cos b cos l for bulge type II Cepheids to R0 = 8178 pc. This is valid only if the underlying three-dimensional distribution is centrally symmetric about the Galactic center and if the observed sample is unbiased in distance. Both assumptions are questionable in the inner Galaxy: a lopsided or tilted bar/density asymmetry shifts the distance mode, and the survey's own extinction map implies that far-side bulge Cepheids are preferentially missed, pulling the observed dY mode to the near side. Tuning the observed mode to R0 then changes the inferred R_KJK; for the completeness effect alone, the fit would likely bias R_KJK low rather than high, because a smaller A(Ks) is needed to push near-side stars outward. Equations (22) and (24) enter every distance in Table 8 and therefore all warp, flare, and age-gradient results in Sect. 5. The ±0.019 systematic in Eq. (22) comes from Monte Carlo resampling of the same estimator and cannot capture this mode bias. I request a forward-model test: generate mock bulge type II Cepheids from a triaxial or lopsided density model, apply the magnitude- and position-dependent VVV completeness function, run the same KDE/R0 fitting procedure, and report the resulting bias in R_KJK. If this bias is comparable to or larger than 0.019, the systematic errors and the distances derived from them need to be enlarged accordingly.
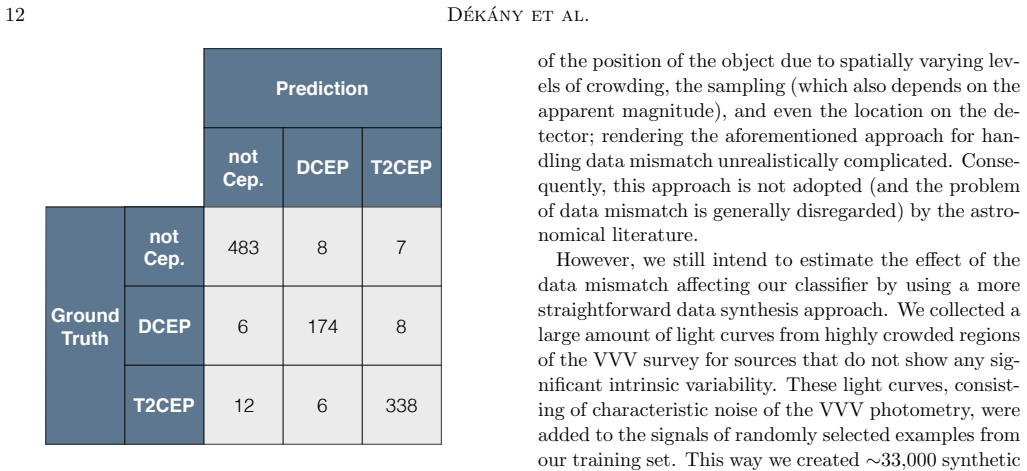
- [Sect. 3.3 and Sect. 3.8 (training set and final sample)] Forty-eight of the 188 classical Cepheid training examples were selected by the authors' tentative distance-extinction consistency method (delta >= 3, d < 7.5 kpc, Sect. 3.3 and Fig. 4), using the same PL relations, extinction-map assumptions, and reddening framework that are later used to derive distances in Sects. 4.2-4.3. Because the final DCEP/T2CEP classification of the survey data is made by a CNN trained on this set, any systematic error in that selection can imprint itself on the census of 640 new classical Cepheids in a way that cross-validation accuracy cannot detect, since the same assumptions are embedded in the labels. The authors state that the selection is insensitive to the extinction law within the range considered, but a direct test would be more convincing: retrain the CNN without the 48 internally selected objects and compare the classifications and final counts on the full candidate sample. If the census changes materially, the overlap between the training selection and the distance analysis should be disclosed and discussed as a systematic limitation.
- [Sect. 5.2, Fig. 22] The claimed significant vertical and radial age gradients rest on period-age relations from Anderson et al. (2016), evaluated at metallicities assigned from a near-side radial metallicity gradient, with no individual metallicities or rotation/instability-strip information for the far-side Cepheids. The authors acknowledge the P ~ 10 d classification confusion and the modeling assumptions, but the age gradient is presented as one of the main discoveries. I ask for a robustness test: recompute the median-age curves with a +/-0.2 dex shift in the adopted [Fe/H] and with the alternative instability-strip-crossing and rotation choices in Anderson et al. (2016), and state whether the gradient slope and significance survive.
minor comments (5)
- [Sect. 3.2 and Sect. 3.7] There are typographical errors: 'stranderdized' in Sect. 3.2 should be 'standardized', and 'in oder' in Sect. 3.7 should be 'in order'.
- [Sect. 4.2, Fig. 14] The text says the quoted errors on R_JKHK include all statistical and systematic uncertainties, but the binned spatial-variation analysis in the same section explicitly uses statistical errors only; please clarify which components are included in the quoted +/-0.004 and in the binned values shown in Fig. 15.
- [Sect. 3.5, Fig. 8] The synthetic-noise test draws noise realizations added to signals from the training set itself, so the performance curves may be slightly optimistic; this is stated in the text, but it would be useful to add the same caveat directly in the figure caption.
- [Sect. 3.7] The OGLE comparison is based on only 41 common objects and the estimated recall of 0.92 should be quoted with a binomial confidence interval rather than as a point value, given the small sample size.
- [Table 8 and Fig. 19] Objects with dH > 40-50 kpc and small A(Ks) are explicitly suspected to be misclassified; consider adding a classification-quality or distance-quality flag to the electronic catalog so that downstream users do not treat all 689 distances as being of uniform reliability.
Circularity Check
No significant circularity: the extinction scale is anchored to the external GRAVITY R0 and independent PL relations, and the central-symmetry assumption is explicit rather than concealed.
full rationale
The paper's derivation chain is: CNN classification (with literature/OGLE training plus 48 authors' candidates) -> mean colors via neural color-correction -> color excesses from PL relations -> reddening ratio R_JKHK (a slope of E(J-Ks) versus E(H-Ks), independent of the absolute extinction scale) -> selective-to-absolute ratios by forcing the bulge type II Cepheid dY peak to the GRAVITY-measured R0 = 8178 pc -> distances via Eq. 25. The calibration step in Sect. 4.3 is an explicit calibration to an external anchor, not a prediction masquerading as a test. The central-symmetry assumption is stated openly and is not derived from the data; the resulting shape and elongation of the T2C distribution retain independent content. The 48 classical Cepheids added to the CNN training set were selected by the authors' earlier distance-extinction consistency method, and the paper explicitly checks that the same selection is obtained with the later extinction ratios and validates the classifier against OGLE classifications; this is a selection detail, not a reduction of the later extinction or distance measurements to the training labels. Self-citations (Dekany et al. 2013, 2015b, 2018; Hajdu et al. 2019) are methodological or contextual and are not load-bearing circular justifications. No equation in the paper is equivalent to its input by construction, and no fitted parameter is renamed as a prediction. The main scientific claims (640 new classical Cepheids, warp/flare, age gradients) depend on the calibrated extinction law but are not identical to the calibration input. Therefore no circular step is identified.
Assumptions & free parameters
free parameters (3)
- RKJK = A(Ks)/E(J-Ks) =
0.528 +/- 0.004 (stat) +/- 0.019 (sys)
- RJKHK = E(J-Ks)/E(H-Ks) =
2.832 +/- 0.004 (bulge); 2.833 +/- 0.004 (disk)
- RKHK = A(Ks)/E(H-Ks) =
1.50 +/- 0.01 (stat) +/- 0.05 (sys)
assumptions (5)
- domain assumption Type II Cepheids in the bulge are centrally symmetric about the Galactic center (Sgr A*).
- domain assumption The adopted near-infrared period-luminosity relations (Macri et al. 2015; Bhardwaj et al. 2017, transformed to VISTA) are valid for the surveyed Cepheids.
- domain assumption The period-age relations of Anderson et al. (2016), with metallicities from the Genovali et al. (2014) and Luck (2018) radial gradients, apply to these Cepheids.
- domain assumption The recalibrated VVV photometry (Hajdu et al. 2019) is free of systematic zero-point errors at the level claimed.
- domain assumption The CNN training set, including 48 self-selected VVV classical Cepheids, is representative of the survey's target population.
Cite this review
Pith. "Pith review of Into the Darkness: Classical and Type II Cepheids in the Zona Galactica Incognita." pith.science (2026). https://pith.science/paper/OVKYWC27
@misc{pith2026190808290,
  author       = {Pith},
  title        = {Pith review of: Into the Darkness: Classical and Type II Cepheids in the Zona Galactica Incognita},
  year         = {2026},
  howpublished = {\url{https://pith.science/paper/OVKYWC27}},
  note         = {Machine review of arXiv:1908.08290}
}
read the original abstract
The far side of the Milky Way's disk is one of the most concealed parts of the known Universe due to extremely high interstellar extinction and point source density toward low Galactic latitudes. Large time-domain photometric surveys operating in the near-infrared hold great potential for the exploration of these vast uncharted areas of our Galaxy. We conducted a census of distant classical and type II Cepheids along the southern Galactic mid-plane using near-infrared photometry from the VISTA Variables in the V\'ia L\'actea survey. We performed a machine-learned classification of the Cepheids based on their infrared light curves using a convolutional neural network. We have discovered 640 distant classical Cepheids with up to ~40 magnitudes of visual extinction, and over 500 type II Cepheids, most of them located in the inner bulge. Intrinsic color indices of individual Cepheids were predicted from sparse photometric data using a neural network, allowing their use as accurate reddening tracers. They revealed a steep, spatially varying near-infrared extinction curve toward the inner bulge. Type II Cepheids in the Galactic bulge were also employed to measure robust mean selective-to-absolute extinction ratios. They trace a centrally concentrated spatial distribution of the old bulge population with a slight elongation, consistent with earlier results from RR Lyrae stars. Likewise, the classical Cepheids were utilized to trace the Galactic warp and various substructures of the Galactic disk, and to uncover significant vertical and radial age gradients of the thin disk population at the far side of the Milky Way.
Figures

Figures from the paper (21 more)







Reference graph
Works this paper leans on
-
[1]
, " * write output.state after.block = add.period write newline
ENTRY address archivePrefix author booktitle chapter doi edition editor eprint howpublished institution journal key month number organization pages publisher school series title misctitle type volume year version url label extra.label sort.label short.list INTEGERS output.state before.all mid.sentence after.sentence after.block FUNCTION init.state.consts ...
-
[2]
write newline
" write newline "" before.all 'output.state := FUNCTION format.url url empty "" new.block "" url * "" * if FUNCTION format.eprint eprint empty "" archivePrefix empty "" archivePrefix "arXiv" = new.block " " eprint * " " * new.block " " eprint * " " * if if if FUNCTION format.doi doi empty "" " " doi * " " * if FUNCTION format.pid doi empty eprint empty ""...
-
[4]
Abadi, M., Agarwal, A., Barham, P., et al.\ 2016, arXiv e-prints, arXiv:1603.04467
arXiv 2016
-
[5]
Gravity Collaboration, Abuter, R., Amorim, A., et al.\ 2019, , 625, L10
2019
-
[6]
Abuter, R., Amorim, A., Bauboeck, M., et al.\ 2019, arXiv e-prints , arXiv:1904.05721
arXiv 2019
-
[7]
Anders, F., Khalatyan, A., Chiappini, C., et al.\ 2019, arXiv e-prints, arXiv:1904.11302
arXiv 2019
-
[8]
I., Eyer, L., & Mowlavi, N.\ 2013, , 434, 2238
Anderson, R. I., Eyer, L., & Mowlavi, N.\ 2013, , 434, 2238
2013
-
[9]
I., Saio, H., Ekstr \"o m, S., et al.\ 2016, , 591, A8
Anderson, R. I., Saio, H., Ekstr \"o m, S., et al.\ 2016, , 591, A8
2016
Show all 131 references
-
[10]
Alonso-Garc \' a, J., Minniti, D., Catelan, M., et al.\ 2017, , 849, L13
2017
-
[11]
G., III, Fernley, J
Barnes, T. G., III, Fernley, J. A., Frueh, M. L., et al.\ 1997, , 109, 645
1997
-
[12]
M., Rejkuba, M., et al.\ 2017, , 153, 154
Bhardwaj, A., Macri, L. M., Rejkuba, M., et al.\ 2017, , 153, 154
2017
-
[13]
Bhardwaj, A., Rejkuba, M., Minniti, D., et al.\ 2017, , 605, A100
2017
-
[14]
Bono, G., Marconi, M., Cassisi, S., et al.\ 2005, , 621, 966
2005
-
[15]
F., Bhardwaj, A., Contreras Ramos, R., et al.\ 2018, , 619, A51
Braga, V. F., Bhardwaj, A., Contreras Ramos, R., et al.\ 2018, , 619, A51
2018
-
[16]
A., Coleman, T
Branch, M. A., Coleman, T. F., Li, Y.\ 1999, SIAM Journal on Scientific Computing, 21, 1
1999
-
[17]
Brunel, A., Pasquet, J., Pasquet, J., et al.\ 2019, arXiv e-prints , arXiv:1901.00461
2019 arXiv
-
[18]
Camargo, D., Bica, E., & Bonatto, C.\ 2013, , 432, 3349
2013
-
[19]
A.\ 2015, Pulsating Stars (Wiley-VCH)
Catelan, M., & Smith, H. A.\ 2015, Pulsating Stars (Wiley-VCH)
2015
-
[20]
Chen, X., Wang, S., Deng, L., & de Grijs, R.\ 2018, , 859, 137
2018
-
[21]
Chen, X., Wang, S., Deng, L., et al.\ 2018, , 237, 28
2018
-
[22]
Chen, X., Wang, S., Deng, L., et al.\ 2019, Nature Astronomy, 3, 320
2019
-
[23]
Chen, B.-Q., Huang, Y., Hou, L.-G., et al.\ 2019, , 487, 1400
2019
-
[24]
https://github.com/fchollet/keras
Chollet, F.\ 2015, keras, GitHub. https://github.com/fchollet/keras
2015
-
[25]
Clevert, D.-A., Unterthiner, T., & Hochreiter, S.\ 2015, arXiv e-prints , arXiv:1511.07289
2015 arXiv
-
[26]
N., Fan, A., Auli, M., et al.\ 2016, arXiv e-prints , arXiv:1612.08083
Dauphin, Y. N., Fan, A., Auli, M., et al.\ 2016, arXiv e-prints , arXiv:1612.08083
2016 arXiv
-
[27]
M., Marshall, J
Davies, T. M., Marshall, J. C., Hazelton, M. L.\ 2018, Statistics in Medicine, 37, 1191
2018
-
[28]
M., Aerts, C., et al.\ 2007, , 475, 1159
Debosscher, J., Sarro, L. M., Aerts, C., et al.\ 2007, , 475, 1159
2007
-
[29]
D \'e k \'a ny, I., Minniti, D., Catelan, M., et al.\ 2013, , 776, L19
2013
-
[30]
D \'e k \'a ny, I., Minniti, D., Hajdu, G., et al.\ 2015, , 799, L11
2015
-
[31]
D \'e k \'a ny, I., Minniti, D., Majaess, D., et al.\ 2015, , 812, L29
2015
-
[32]
K., et al.\ 2018, , 857, 54
D \'e k \'a ny, I., Hajdu, G., Grebel, E. K., et al.\ 2018, , 857, 54
2018
-
[33]
Dobbs, C., & Baba, J.\ 2014, , 31, e035
2014
-
[34]
R., Wang, Q
Dong, H., Mauerhan, J., Morris, M. R., Wang, Q. D., & Cotera, A.\ 2015, , 446, 842
2015
-
[35]
and Hart, P.\ 1973, Pattern Classification and Scene Analysis, 271 (John Wiley and Sons)
Duda, R. and Hart, P.\ 1973, Pattern Classification and Scene Analysis, 271 (John Wiley and Sons)
1973
-
[36]
Elorrieta, F., Eyheramendy, S., Jord \'a n, A., et al.\ 2016, , 595, A82
2016
-
[37]
P., Irwin, M
Emerson, J. P., Irwin, M. J., Lewis, J., et al.\ 2004, , 5493, 401
2004
-
[38]
W., Menzies, J
Feast, M. W., Menzies, J. W., Matsunaga, N., & Whitelock, P. A.\ 2014, , 509, 342
2014
-
[39]
Feldmeier-Krause, A., Neumayer, N., Sch \"o del, R., et al.\ 2015, , 584, A2
2015
-
[40]
L., & Massa, D.\ 2009, , 699, 1209
Fitzpatrick, E. L., & Massa, D.\ 2009, , 699, 1209
2009
-
[41]
B., Stead, J
Foster, J. B., Stead, J. J., Benjamin, R. A., Hoare, M. G., & Jackson, J. M.\ 2012, , 751, 157
2012
-
[42]
Genovali, K., Lemasle, B., Bono, G., et al.\ 2014, , 566, A37
2014
-
[43]
Glorot, X., Bordes, A., Bengio, Y.\ 2011, Proceedings of Machine Learning Research 15, 315
2011
-
[44]
A., Rejkuba, M., Zoccali, M., et al.\ 2012, , 543, A13
Gonzalez, O. A., Rejkuba, M., Zoccali, M., et al.\ 2012, , 543, A13
2012
-
[45]
T., Irwin, M
Gonz \'a lez-Fern \'a ndez, C., Hodgkin, S. T., Irwin, M. J., et al.\ 2018, , 474, 5459
2018
-
[46]
J.\ 1998, , 85, 161
Grevesse, N., & Sauval, A. J.\ 1998, , 85, 161
1998
-
[47]
K., & Jurcsik, J.\ 2018, , 857, 55
Hajdu, G., D \'e k \'a ny, I., Catelan, M., Grebel, E. K., & Jurcsik, J.\ 2018, , 857, 55
2018
-
[48]
K.\ 2019, arXiv:1908.06160
Hajdu, G., D \'e k \'a ny, I., Catelan, M., & Grebel, E. K.\ 2019, arXiv:1908.06160
2019 arXiv
-
[49]
J., Tibshirani, R
Hastie, T. J., Tibshirani, R. J., Friedman, J. H.\ 2009, The elements of statistical learning: data mining, inference, and prediction, Springer series in statistics (New York: Springer)
2009
-
[50]
Hertzsprung, E.\ 1926, , 3, 115
1926
-
[51]
T., Irwin, M
Hodgkin, S. T., Irwin, M. J., Hewett, P. C., & Warren, S. J.\ 2009, , 394, 675
2009
-
[52]
G., Han, J
Hou, L. G., Han, J. L., & Shi, W. B.\ 2009, , 499, 473
2009
-
[53]
G., & Han, J
Hou, L. G., & Han, J. L.\ 2014, , 569, A125
2014
-
[54]
G., & Han, J
Hou, L. G., & Han, J. L.\ 2015, , 454, 626
2015
-
[55]
J., Hindman, J
Kerr, F. J., Hindman, J. V., & Gum, C. S.\ 1959, Australian Journal of Physics, 12, 270
1959
-
[56]
J.\ 1964, Ann
Huber, P. J.\ 1964, Ann. Math. Statist. 35, 73
1964
-
[57]
S., Babler, B
Indebetouw, R., Mathis, J. S., Babler, B. L., et al.\ 2005, , 619, 931
2005
-
[58]
Inno, L., Matsunaga, N., Romaniello, M., et al.\ 2015, , 576, A30
2015
-
[59]
J., Lewis, J., Hodgkin, S., et al.\ 2004, , 5493, 411
Irwin, M. J., Lewis, J., Hodgkin, S., et al.\ 2004, , 5493, 411
2004
-
[60]
Ita, Y., Matsunaga, N., Tanab \'e , T., et al.\ 2018, , 481, 4206
2018
-
[61]
Ioffe, S., & Szegedy, C.\ 2015, arXiv e-prints , arXiv:1502.03167
2015 arXiv
-
[62]
S., Stanek, K
Jayasinghe, T., Kochanek, C. S., Stanek, K. Z., et al.\ 2018, , 477, 3145
2018
-
[63]
Jones, E., Oliphant, E., Peterson, P., et al.\ 2001, SciPy: Open Source Scientific Tools for Python, 2001-, http://www.scipy.org/
2001
-
[64]
Kalberla, P. M. W., Dedes, L., Kerp, J., & Haud, U.\ 2007, , 469, 511
2007
-
[65]
Kalberla, P. M. W., & Kerp, J.\ 2009, , 47, 27
2009
-
[66]
Kim, D.-W., & Bailer-Jones, C. A. L.\ 2016, , 587, A18
2016
-
[67]
P., & Ba, J.\ 2014, arXiv e-prints , arXiv:1412.6980
Kingma, D. P., & Ba, J.\ 2014, arXiv e-prints , arXiv:1412.6980
2014 arXiv
-
[68]
Koo, B.-C., Park, G., Kim, W.-T., et al.\ 2017, , 129, 094102
2017
-
[69]
E.\ 2012, Advances in Neural Information Processing Systems 25, 1097 (Curran Associates, Inc.)
Krizhevsky, A., Sutskever, I., Hinton, G. E.\ 2012, Advances in Neural Information Processing Systems 25, 1097 (Curran Associates, Inc.)
2012
-
[70]
Lecun, Y., Bottou, L., Bengio Y., Haffner, P.\ 1998, Proceedings of the IEEE, 86, 2278
1998
-
[71]
D., & Stobie, R
Laney, C. D., & Stobie, R. S.\ 1992, , 93, 93
1992
-
[72]
LeCun, Y., Bengio, Y.,\ 1995, The Handbook of Brain Theory and Neural Networks, 255 (MIT Press)
1995
-
[73]
S., Blitz, L., & Heiles, C.\ 2006, Science, 312, 1773
Levine, E. S., Blitz, L., & Heiles, C.\ 2006, Science, 312, 1773
2006
-
[74]
C., Yuan, C., & Shu, F
Lin, C. C., Yuan, C., & Shu, F. H.\ 1969, , 155, 721
1969
-
[75]
Lin, M., Chen, Q., & Yan, S.\ 2013, arXiv e-prints , arXiv:1312.4400
2013 arXiv
-
[76]
E.\ 2018, , 156, 171
Luck, R. E.\ 2018, , 156, 171
2018
-
[77]
M., Ngeow, C.-C., Kanbur, S
Macri, L. M., Ngeow, C.-C., Kanbur, S. M., Mahzooni, S., & Smitka, M. T.\ 2015, , 149, 117
2015
-
[78]
M., Ngeow, C.-C., Kanbur, S
Macri, L. M., Ngeow, C.-C., Kanbur, S. M., Mahzooni, S., & Smitka, M. T.\ 2016, , 151, 48
2016
-
[79]
J., Turner, D
Majaess, D. J., Turner, D. G., & Lane, D. J.\ 2009, , 398, 263
2009
-
[80]
Majaess, D., Turner, D., D \'e k \'a ny, I., Minniti, D., & Gieren, W.\ 2016, , 593, A124
2016
-
[81]
Matsunaga, N., Fukushi, H., Nakada, Y., et al.\ 2006, , 370, 1979
2006
-
[82]
Matsunaga, N., Kawadu, T., Nishiyama, S., et al.\ 2011, , 477, 188
2011
-
[83]
W., Kawadu, T., et al.\ 2013, , 429, 385
Matsunaga, N., Feast, M. W., Kawadu, T., et al.\ 2013, , 429, 385
2013
-
[84]
W., Bono, G., et al.\ 2016, , 462, 414
Matsunaga, N., Feast, M. W., Bono, G., et al.\ 2016, , 462, 414
2016
-
[85]
W., Emerson, J
Minniti, D., Lucas, P. W., Emerson, J. P., et al.\ 2010, , 15, 433
2010
-
[86]
N., Borissova, J., Catelan, M., et al.\ 2019, , 482, 5567
Molina, C. N., Borissova, J., Catelan, M., et al.\ 2019, , 482, 5567
2019
-
[87]
J., & Pierce, M
Monson, A. J., & Pierce, M. J.\ 2011, , 193, 12
2011
-
[88]
Morris, M., & Serabyn, E.\ 1996, , 34, 645
1996
-
[89]
M., Gould, A., Fouqu \'e , P., et al.\ 2013, , 769, 88
Nataf, D. M., Gould, A., Fouqu \'e , P., et al.\ 2013, , 769, 88
2013
-
[90]
Nishiyama, S., Nagata, T., Kusakabe, N., et al.\ 2006, , 638, 839
2006
-
[91]
Nishiyama, S., Tamura, M., Hatano, H., et al.\ 2009, , 696, 1407
2009
-
[92]
Oliphant, T.E., 2006, A guide to NumPy, Trelgol Publishing USA
2006
-
[93]
A., Palafox, L., & Griffith, C
Pearson, K. A., Palafox, L., & Griffith, C. A.\ 2018, , 474, 478
2018
-
[94]
E., Madore, B
Persson, S. E., Madore, B. F., Krzemi \'n ski, W., et al.\ 2004, , 128, 2239
2004
-
[95]
Pedregosa, F., Varoquaux, G., Gramfort, A., et al.\ 2011, Journal of Machine Learning Research, 12, 2825
2011
-
[96]
Pietrukowicz, P., Koz owski, S., Skowron, J., et al.\ 2015, , 811, 113
2015
-
[97]
Pietrzy \'n ski, G., Graczyk, D., Gallenne, A., et al.\ 2019, , 567, 200
2019
-
[98]
Y., Haghpanahi, M., et al.\ 2017, arXiv e-prints , arXiv:1707.01836
Rajpurkar, P., Hannun, A. Y., Haghpanahi, M., et al.\ 2017, arXiv e-prints , arXiv:1707.01836
2017 arXiv
-
[99]
J., Menten, K
Reid, M. J., Menten, K. M., Zheng, X. W., et al.\ 2009, , 700, 137-148
2009
-
[100]
W., Starr, D
Richards, J. W., Starr, D. L., Butler, N. R., et al.\ 2011, , 733, 10
2011
-
[101]
W., Starr, D
Richards, J. W., Starr, D. L., Miller, A. A., et al.\ 2012, , 203, 32
2012
-
[102]
Ripepi, V., Molinaro, R., Musella, I., et al.\ 2019, , 625, A14
2019
-
[103]
Russeil, D.\ 2003, , 397, 133
2003
-
[104]
K., Hempel, M., Minniti, D., et al.\ 2012, , 537, A107
Saito, R. K., Hempel, M., Minniti, D., et al.\ 2012, , 537, A107
2012
-
[105]
W., Fonnesbeck, C.\ 2016, PeerJ Computer Science, 2, 55
Salvatier, J., Wiecki, T. W., Fonnesbeck, C.\ 2016, PeerJ Computer Science, 2, 55
2016
-
[106]
J., Dame, T
Sanna, A., Reid, M. J., Dame, T. M., et al.\ 2017, Science, 358, 227
2017
-
[107]
F., Meisner, A
Schlafly, E. F., Meisner, A. M., Stutz, A. M., et al.\ 2016, , 821, 78
2016
-
[108]
Schmidt, M.\ 1957, , 13, 247
1957
-
[109]
K., Pasquali, A., et al.\ 2018, , 478, 3590
Shabani, F., Grebel, E. K., Pasquali, A., et al.\ 2018, , 478, 3590
2018
-
[110]
J., & Vanderburg, A.\ 2018, , 155, 94
Shallue, C. J., & Vanderburg, A.\ 2018, , 155, 94
2018
-
[111]
Simonyan, K., & Zisserman, A.\ 2014, arXiv e-prints , arXiv:1409.1556
2014 arXiv
-
[112]
M., Skowron, J., Mr \'o z, P., et al.\ 2019, Science, 365, 478
Skowron, D. M., Skowron, J., Mr \'o z, P., et al.\ 2019, Science, 365, 478
2019
-
[113]
M., Skowron, J., Mr \'o z, P., et al.\ 2018, arXiv:1806.10653
Skowron, D. M., Skowron, J., Mr \'o z, P., et al.\ 2018, arXiv:1806.10653
2018 arXiv
-
[114]
F., Cutri, R
Skrutskie, M. F., Cutri, R. M., Stiening, R., et al.\ 2006, , 131, 1163
2006
-
[115]
C., Lucas, P
Smith, L. C., Lucas, P. W., Kurtev, R., et al.\ 2018, , 474, 1826
2018
-
[116]
Srivastava, N., Hinton, G., Krizhevsky, A., Sutskever, I., Salakhutdinov, R.\ 2014, Journal of Machine Learning Research, 15, 1929
2014
-
[117]
K., et al.\ 2015, , 65, 297
Soszy \'n ski, I., Udalski, A., Szyma \'n ski, M. K., et al.\ 2015, , 65, 297
2015
-
[118]
K., et al.\ 2017, , 67, 297
Soszy \'n ski, I., Udalski, A., Szyma \'n ski, M. K., et al.\ 2017, , 67, 297
2017
-
[119]
B.\ 2006, in Astronomical Data Analysis Software and Systems XV (ed
Taylor, M. B.\ 2006, in Astronomical Data Analysis Software and Systems XV (ed. C. Gabriel et al.), ASP Conference Series, 351, p. 666
2006
-
[120]
Udalski, A., Soszy \'n ski, I., Pietrukowicz, P., et al.\ 2018, , 68, 315
2018
-
[121]
P.\ 2015, , 450, 4277
Vall \'e e, J. P.\ 2015, , 450, 4277
2015
-
[122]
P.\ 2017, The Astronomical Review, 13, 113
Vall \'e e, J. P.\ 2017, The Astronomical Review, 13, 113
2017
-
[123]
W.\ 2014, , 788, L12
Wang, S., & Jiang, B. W.\ 2014, , 788, L12
2014
-
[124]
Wang, S., & Chen, X.\ 2019, , 877, 116
2019
-
[125]
L., Wieland, F., McAlary, C
Welch, D. L., Wieland, F., McAlary, C. W., et al.\ 1984, , 54, 547
1984
-
[126]
Westerhout, G.\ 1957, , 13, 201
1957
-
[127]
J., Zheng, X
Xu, Y., Reid, M. J., Zheng, X. W., & Menten, K. M.\ 2006, Science, 311, 54
2006
-
[128]
J., Reid, M
Xu, Y., Li, J. J., Reid, M. J., et al.\ 2013, , 769, 15
2013
-
[129]
Xu, Y., Reid, M., Dame, T., et al.\ 2016, Science Advances, 2, e1600878
2016
-
[130]
B., Reid, M
Xu, Y., Bian, S. B., Reid, M. J., et al.\ 2018, , 616, L15
2018
-
[131]
R., Indebetouw, R., et al.\ 2009, , 707, 510
Zasowski, G., Majewski, S. R., Indebetouw, R., et al.\ 2009, , 707, 510
2009
-
[132]
Zechmeister, M., & K \"u rster, M.\ 2009, , 496, 577
2009
Reviewed August 14, 2026 · model on record in the stance chip above.
Discussion (0). Continue with ORCID to comment.