REVIEW 3 major objections 4 minor 65 references
Robust Ambiguity Detection (RAD) From Model- and Feature-Space Consistency
T0 review · 3 major / 4 minor · reviewed 2026-08-16 · deepseek-v4-flash
Pith's one-line read The paper claims that predictive ambiguity can be quantified before prediction by a two-dimensional score pair measuring model-space and feature-space consistency, and that predictions falling in the ambiguous quadrants of the resulting…
desk verdict Solid two-axis ambiguity diagnostic whose headline reliability claim is asserted but not demonstrated. read the letter →
The pith
A machine-rendered reading of the paper's core claim, the machinery that carries it, and where it could break.
The reading
What carries the argument
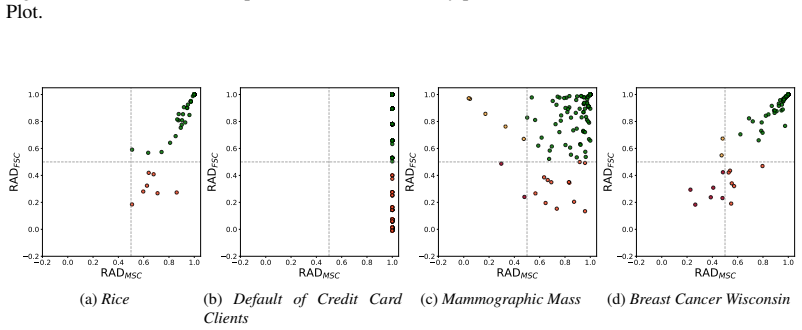
The central object is the ambiguity matrix, a p-by-n grid in which each entry is the class predicted by one of n equivalent models (here, bootstrap-trained decision trees) for one of p perturbed versions of a test point, namely the point itself plus SMOTE-style linear interpolations toward its k = 10 nearest neighbours. The key reduction is to apply Gwet's chance-corrected AC1 agreement coefficient twice to this matrix: once treating models as raters to obtain RADMSC, and once treating perturbed points as raters to obtain RADFSC. The RAD Plot then maps each point by its score pair into four quadrants with distinct diagnoses (robust, model-space ambiguous, feature-space ambiguous, fully ambiguous), and RAD Pareto-Rank orders points from most to least ambiguous for downstream abstention.
What would settle it
Take a labelled test set, compute the RAD Score-Pair for every point, split by the 0.5 threshold on both axes, and measure accuracy separately in Q1, Q2, Q3, and Q4; the central claim fails if accuracy in any of Q2, Q3, or Q4 is substantially above chance on a balanced task, or if changing the neighbourhood perturbation rule (for instance from interpolation to Gaussian noise) reverses which points land in the ambiguous quadrants.
Extended reading notes
Core claim
The paper defines robust-ambiguity as predictive inconsistency that arises when multiple equivalent models disagree on a datapoint, or on equivalent data points in its neighbourhood. It claims this joint, two-space disagreement can be captured by the RAD Score-Pair (RADMSC, RADFSC): RADMSC is the chance-corrected agreement of models treating perturbed points as questions, and RADFSC is the chance-corrected agreement of perturbed points treating models as questions. The authors report that across synthetic and real-world datasets, predictions lying in the ambiguous quadrants Q2, Q3, and Q4 are near chance-level accurate, while predictions in the robust quadrant Q1 average 0.91 accuracy. They interpret this as evidence that the framework identifies, before prediction, datapoints that the deployed model class cannot decide reliably, and they demonstrate that ranking datapoints by RAD Pareto-Rank and abstaining on the most ambiguous ones matches or exceeds standard rejection baselines.
Load-bearing premise
The load-bearing premise is that linear interpolation between a test point and its ten nearest neighbours produces permissible variations that genuinely represent the local feature-space neighbourhood; if those synthetic points fall off the data manifold, the feature-space consistency score measures artefacts of the sampling rule rather than real predictive instability, and the Q3/Q4 diagnoses no longer support the chance-level accuracy claim.
Editorial extensions
If this is right
- If predictions in Q2, Q3, and Q4 are genuinely near chance-level, then abstaining on those points before issuing a label converts a model that looks moderately accurate overall into one whose remaining predictions are trustworthy.
- RAD scores are relative to the model class: the same dataset analysed with decision trees may flag different examples than the same framework applied with neural networks, so RAD is a certification of a model-class decision, not of the data alone.
- Per-class one-vs-all score pairs reveal which classes are confusable in multi-class problems, such as the middle scores of an ordered quality scale being more ambiguous than the extremes.
- The ranking produced by RAD Pareto-Rank is competitive with established uncertainty and disagreement baselines, so the two-dimensional score adds diagnostic information without sacrificing rejection performance.
- Because Gwet's AC1 is chance-corrected, the two scores share one interpretation: values near zero mean chance-level agreement, negative values mean systematic disagreement, and values near one mean robust agreement.
Reading between the lines
- A testable extension is to use RAD Score-Pairs as a pre-prediction reliability certificate: if the near-chance accuracy finding persists across model families and domains, the quadrant labels could serve as an audit signal for regulated deployments, not just an abstention ranking.
- The framework's diagnosis hinges on the perturbation rule; replacing the interpolation-based neighbourhood with Gaussian or manifold-constrained perturbations would show whether Q3/Q4 assignments are artefacts of the sampling rule or stable properties of the decision boundary.
- The same two-axis reduction could be applied to regression by treating models' predicted scores as soft labels, which the paper leaves as future work but which the ambiguity-matrix construction would support directly.
- The aggregate RAD Plot patterns (right skew, upward skew, diagonal spread) amount to a menu of likely failure modes; using these patterns as a trigger for label auditing is an implication the authors only partially develop.
Signed reviews
Editorial analysis
A structured set of objections, weighed in public.
Referee Report
Summary. The manuscript introduces Robust Ambiguity Detection (RAD), a framework that scores a test point by two chance-corrected agreement coefficients computed over an ambiguity matrix: model-space consistency (RADMSC) and feature-space consistency (RADFSC). RADMSC is Gwet's AC1 over equivalent models as raters and neighbourhood points as questions; RADFSC is AC1 on the transposed matrix. The pair is visualised in a RAD Plot divided into four quadrants at 0.5 thresholds, interpreted as robust (Q1), model-space ambiguous (Q2), fully ambiguous (Q3), and feature-space ambiguous (Q4). The paper validates the framework on five synthetic geometries at three overlap levels and on UCI/MNIST datasets, showing expected movement out of Q1 as class overlap increases, and runs an abstention experiment using RAD-Pareto-Rank, reporting AURC comparable to or better than entropy, self-consistency, and random baselines.
Significance. If the central reliability claim were established, RAD would be a useful and interpretable tool that combines predictive multiplicity with local robustness and provides actionable quadrant diagnoses; the per-class RAD plots for the Wine Quality and handwritten-digit datasets are a genuinely informative diagnostic. Strengths of the paper include the transparent, directly computed score definitions with no fitted constants; synthetic validation using externally controlled overlap; proper statistical testing of the abstention comparisons with Wilcoxon signed-rank plus Holm correction; and a component analysis showing that RADMSC and RADFSC are essentially uncorrelated in the ambiguous quadrants. However, the paper's most important assertion—that Q2/Q3/Q4 predictions are near chance-level while Q1 predictions average 0.91—appears only in the Conclusion and is not supported by any reported table; the current AURC evidence is ranking-based and cannot carry that claim. The significance is therefore conditional on adding direct quadrant-conditioned accuracy evidence.
major comments (3)
- [Section 9 and Section 7.5] The concluding claim that 'predictions in the ambiguous quadrants Q2, Q3, and Q4 are near chance-level accurate, while Q1 predictions average 0.91' is not supported by any table or figure in the manuscript. Table 5 reports only AURC, which is an aggregated ranking metric; a dataset with 90% Q1 points at 0.99 accuracy and 10% Q3 points at 0.60 accuracy can still yield a high AURC while directly contradicting the 'near chance-level' statement for Q3. Please add, for every dataset and at the 0.5 threshold, the accuracy and support size per quadrant, and report the Q1 average; reporting accuracy across a range of thresholds would also be informative because the 0.5 quadrant split is a design choice made in Section 5.1. Without this direct evidence, the framework's central promise as a pre-prediction reliability certificate is unverified.
- [Section 6 (RAD Stage 1) and Section 9] The equivalent model set consists of 25 decision trees with identical tuned hyperparameters trained on bootstrap samples of the training set. The Conclusion generalizes from this set to 'the deployed model class', but a bootstrap sample of a single algorithm is not a sample of the full model class, and the claim that RAD identifies datapoints the model class cannot decide reliably is not established by the reported experiments. Either restrict the conclusion to the generated equivalent-model set or demonstrate that quadrant assignments are stable across model families and hyperparameter settings; as written, the scope of the central claim exceeds the evidence.
- [Section 4.2, Eq. (2)] The feature-space dimension of RAD rests on SMOTE-style linear interpolation as the generator of 'permissible variations'. For tabular data, random interpolation between a test point and its k-th nearest neighbours can leave the data manifold, in which case a low RADFSC reflects artefacts of the sampling rule rather than genuine instability in the deployed model class. The paper itself concedes in Section 9 that the perturbation strategy requires domain adaptation for structured input types. Please provide evidence that the generated neighbourhood points are plausible—for example, density or reconstruction checks, a comparison of feature-space versus latent-space sampling on the non-MNIST datasets, and sensitivity analyses for k and p—or soften the claims that link RADFSC to genuine feature-space robustness.
minor comments (4)
- [Sections 6 and 7.3] The number of real-world datasets is inconsistent: Section 6 says '16 datasets', while Section 7.3, Table 5, and Figure 7 use N=17. Please reconcile the count.
- [Throughout] Please fix typographical errors, including 'berobust' in the Abstract, 'datasests' in the Figure 7 caption, 'RADM SC' in captions, and 'a the set' in Section 4.
- [Figure 8 and Section 7.1] Figure 8's caption should specify that the y-axis is the average fraction of samples that shift quadrants and should define the relationship between K and k. Section 7.1 reports stabilisation on 21 of 32 datasets; please state whether k=10 lies on the stable plateau for the remaining 11 datasets, and consider reporting the variance of the RAD scores themselves rather than only quadrant switches, because quadrant assignment is a coarse thresholded function of the scores.
- [Table 5] In Table 5, ties are not bolded and the 'best or tied' claim is noted in the text; it would help to mark tied best values explicitly and to report the number of datasets on which RAD-Pareto is significantly better, not just numerically better, against Self-Consistency and the individual RAD components.
Circularity Check
No significant circularity: the RAD Score-Pair is computed directly from model predictions and neighbourhood perturbations, with no fitted parameter renamed as a prediction and no load-bearing self-citation.
full rationale
The RAD derivation chain is self-contained. RADMSC and RADFSC are computed by applying Gwet's AC1 to the ambiguity matrix and its transpose (Eqs. 1-3, Section 4.3.2), which are direct reductions of model predictions on SMOTE-style neighbourhood points (Eq. 2). No parameter is fitted to the target reliability claim, and the quadrant partition is a definitional consequence of thresholding AC1 at 0.5 (Section 5.1). The synthetic-data validation uses externally controlled class overlap, not values derived from the framework, and the abstention experiment compares RAD-Pareto ranks against independent baselines (Section 7.5, Table 5). No prior work by the same authors is cited as load-bearing evidence, and there is no uniqueness theorem or ansatz imported via self-citation. The conclusion's assertion that predictions in Q2/Q3/Q4 are 'near chance-level accurate' (Section 9) is not backed by a per-quadrant accuracy table, and the SMOTE-style perturbation is acknowledged to require domain adaptation for structured inputs; these are evidence gaps and limitations, not circular reductions, because accuracy is an external label not used in computing the RAD scores.
Assumptions & free parameters
free parameters (4)
- k (number of nearest neighbours for perturbation sampling) =
10
- p (number of neighbourhood points per test point) =
100
- n (number of equivalent models) =
25
- Quadrant threshold =
0.5 on each axis
assumptions (4)
- domain assumption Gwet's AC1 is a valid chance-corrected agreement measure for this setting, and the raters (models and perturbed points) are independent and fully crossed.
- domain assumption Bootstrap-trained decision trees with tuned hyperparameters form a representative sample of the Rashomon set of equivalent models.
- domain assumption SMOTE-style linear interpolation between a test point and its k nearest neighbours generates permissible variations that capture the local robustness of interest.
- ad hoc to paper Quadrant boundaries at 0.5 map onto meaningful categories of ambiguity (robust, model-space, feature-space, both).
invented entities (3)
-
RAD Score-Pair [RADMSC, RADFSC]
-
RAD Plot quadrants (Q1-Q4)
-
RAD-Pareto-Rank
Cite this review
Pith. "Pith review of Robust Ambiguity Detection (RAD) From Model- and Feature-Space Consistency." pith.science (2026). https://pith.science/paper/OYY7VLAM
@misc{pith2026260811541,
  author       = {Pith},
  title        = {Pith review of: Robust Ambiguity Detection (RAD) From Model- and Feature-Space Consistency},
  year         = {2026},
  howpublished = {\url{https://pith.science/paper/OYY7VLAM}},
  note         = {Machine review of arXiv:2608.11541}
}
read the original abstract
Machine learning models should be robust, in the sense of remaining predictively consistent under permissible variations. A model's predictions should ideally remain unchanged when it is replaced by a functionally equivalent one, or when its inputs are subject to minor, admissible perturbations. If such changes alter a prediction significantly, then the prediction is "ambiguous" with respect to the model. Models should abstain from making such ambiguous predictions and/or should flag them for human inspection, especially in high-stakes decision-making scenarios. However, in practice, such ambiguity is not easy to identify once a model is deployed. Here, the Robust Ambiguity Detection (RAD) framework is advanced for quantifying predictive ambiguity using two complementary metrics: Model-Space Consistency and Feature-Space Consistency. These two scores, the RAD Score-Pair, visualised through the RAD Plot, provide an interpretable characterisation of the sources of ambiguity and the actions a user may consider in response. RAD is evaluated on synthetic datasets with systematically controlled overlap, as well as several real-world datasets where the level of ambiguity cannot be directly inspected. Finally, we demonstrate a downstream application of RAD where samples are ranked by their RAD Pareto-Rank and the most ambiguous are abstained from prediction, achieving performance comparable to existing rejection-based approaches.
Figures


Figures from the paper (16 more)




Reference graph
Works this paper leans on
-
[1]
Joint European Conference on Machine Learning and Knowledge Discovery in Databases , pages=
An experimental study on the Rashomon effect of balancing methods in imbalanced classification , author=. Joint European Conference on Machine Learning and Knowledge Discovery in Databases , pages=. 2024 , organization=
work page 2024
-
[2]
Proceedings of the AAAI Symposium Series , volume=
One Pixel Can Change the Diagnosis: Adversarial and Non-Adversarial Robustness and Uncertainty in Breast Ultrasound Classification Model , author=. Proceedings of the AAAI Symposium Series , volume=
-
[3]
Advances in Neural Information Processing Systems , volume=
Relaxing local robustness , author=. Advances in Neural Information Processing Systems , volume=
-
[4]
Artificial intelligence review , volume=
A survey of uncertainty in deep neural networks , author=. Artificial intelligence review , volume=. 2023 , publisher=
work page 2023
-
[5]
Advances in neural information processing systems , volume=
Simple and scalable predictive uncertainty estimation using deep ensembles , author=. Advances in neural information processing systems , volume=
-
[6]
2009 , publisher=
The elements of statistical learning: data mining, inference, and prediction , author=. 2009 , publisher=
2009
-
[7]
IEEE Transactions on Biomedical Engineering , volume=
Sleep versus wake classification from heart rate variability using computational intelligence: consideration of rejection in classification models , author=. IEEE Transactions on Biomedical Engineering , volume=. 2008 , publisher=
work page 2008
-
[8]
Proceedings of the AAAI Conference on Artificial Intelligence , volume=
Arbitrariness and social prediction: The confounding role of variance in fair classification , author=. Proceedings of the AAAI Conference on Artificial Intelligence , volume=
Show all 65 references
-
[9]
Machine learning , volume=
Aleatoric and epistemic uncertainty in machine learning: An introduction to concepts and methods , author=. Machine learning , volume=. 2021 , publisher=
2021
-
[10]
2014 , publisher=
Handbook of inter-rater reliability: The definitive guide to measuring the extent of agreement among raters , author=. 2014 , publisher=
2014
-
[11]
Journal of Machine Learning Research , volume=
All models are wrong, but many are useful: Learning a variable's importance by studying an entire class of prediction models simultaneously , author=. Journal of Machine Learning Research , volume=
-
[12]
Neurocomputing , volume=
Aleatoric uncertainty estimation with test-time augmentation for medical image segmentation with convolutional neural networks , author=. Neurocomputing , volume=. 2019 , publisher=
2019
-
[13]
International Conference on Fundamental Approaches to Software Engineering , pages=
Understanding local robustness of deep neural networks under natural variations , author=. International Conference on Fundamental Approaches to Software Engineering , pages=. 2021 , organization=
2021
-
[14]
2023 10th International Conference on Electrical, Electronic and Computing Engineering (IcETRAN) , pages=
Non-adversarial robustness of deep learning methods for computer vision , author=. 2023 10th International Conference on Electrical, Electronic and Computing Engineering (IcETRAN) , pages=. 2023 , organization=
2023
-
[15]
Empirical Software Engineering , volume=
Generating and detecting true ambiguity: a forgotten danger in DNN supervision testing , author=. Empirical Software Engineering , volume=. 2023 , publisher=
2023
-
[16]
Journal of Machine Learning Research , volume=
Underspecification presents challenges for credibility in modern machine learning , author=. Journal of Machine Learning Research , volume=
-
[17]
Information Sciences , volume=
Query-by-committee improvement with diversity and density in batch active learning , author=. Information Sciences , volume=. 2018 , publisher=
2018
-
[18]
Advances in neural information processing systems , volume=
What uncertainties do we need in bayesian deep learning for computer vision? , author=. Advances in neural information processing systems , volume=
-
[19]
Statistical science , volume=
Statistical modeling: The two cultures (with comments and a rejoinder by the author) , author=. Statistical science , volume=. 2001 , publisher=
2001
-
[20]
2017 , publisher=
Classification and regression trees , author=. 2017 , publisher=
2017
-
[21]
Proceedings of the fifth annual workshop on Computational learning theory , pages=
Query by committee , author=. Proceedings of the fifth annual workshop on Computational learning theory , pages=
-
[22]
EC3 Conference 2023 , volume=
Using machine learning for automated detection of ambiguity in building requirements , author=. EC3 Conference 2023 , volume=. 2023 , organization=
2023
-
[23]
Production and Operations Management , volume=
A machine learning approach to deal with ambiguity in the humanitarian decision-making , author=. Production and Operations Management , volume=. 2023 , publisher=
2023
-
[24]
IEEE Transactions on Fuzzy Systems , volume=
Ambiguity-based multiclass active learning , author=. IEEE Transactions on Fuzzy Systems , volume=. 2015 , publisher=
2015
-
[25]
Advances in Neural Information Processing Systems , volume=
Implications of model indeterminacy for explanations of automated decisions , author=. Advances in Neural Information Processing Systems , volume=
-
[26]
International Conference on Machine Learning , pages=
Nondeterminism and instability in neural network optimization , author=. International Conference on Machine Learning , pages=. 2021 , organization=
2021
-
[27]
Nature medicine , volume=
AI in health and medicine , author=. Nature medicine , volume=. 2022 , publisher=
2022
-
[28]
Machine Learning , volume=
Machine learning with a reject option: A survey , author=. Machine Learning , volume=. 2024 , publisher=
2024
-
[29]
arXiv preprint arXiv:2506.15850 , year=
Uncertainty Estimation by Human Perception versus Neural Models , author=. arXiv preprint arXiv:2506.15850 , year=
-
[30]
Educational and psychological measurement , volume=
A coefficient of agreement for nominal scales , author=. Educational and psychological measurement , volume=. 1960 , publisher=
1960
-
[31]
, author=
Measuring nominal scale agreement among many raters. , author=. Psychological bulletin , volume=. 1971 , publisher=
1971
-
[32]
international conference on machine learning , pages=
Dropout as a bayesian approximation: Representing model uncertainty in deep learning , author=. international conference on machine learning , pages=. 2016 , organization=
2016
-
[33]
arXiv preprint arXiv:2302.03015 , year=
Exploring and exploiting decision boundary dynamics for adversarial robustness , author=. arXiv preprint arXiv:2302.03015 , year=
-
[34]
Journal of artificial intelligence research , volume=
SMOTE: synthetic minority over-sampling technique , author=. Journal of artificial intelligence research , volume=
-
[35]
2007 , publisher=
Numerical recipes 3rd edition: The art of scientific computing , author=. 2007 , publisher=
2007
-
[36]
Journal of the American Statistical Association , volume=
Improvements on cross-validation: The .632+ bootstrap method , author=. Journal of the American Statistical Association , volume=
-
[37]
arXiv preprint arXiv:2202.07244 , year=
Explaining reject options of learning vector quantization classifiers , author=. arXiv preprint arXiv:2202.07244 , year=
-
[38]
Bell System technical journal , volume=
Transmission of information 1 , author=. Bell System technical journal , volume=. 1928 , publisher=
1928
-
[39]
IEEE Transactions on Knowledge and Data Engineering , volume=
Maximum ambiguity-based sample selection in fuzzy decision tree induction , author=. IEEE Transactions on Knowledge and Data Engineering , volume=. 2011 , publisher=
2011
-
[40]
International conference on machine learning , pages=
Predictive multiplicity in classification , author=. International conference on machine learning , pages=. 2020 , organization=
2020
-
[41]
Advances in Neural Information Processing Systems , volume=
Rashomon capacity: A metric for predictive multiplicity in classification , author=. Advances in Neural Information Processing Systems , volume=
-
[42]
arXiv preprint arXiv:2402.07745 , year=
Predictive churn with the set of good models , author=. arXiv preprint arXiv:2402.07745 , year=
-
[43]
2007 , publisher=
UCI machine learning repository , author=. 2007 , publisher=
2007
-
[44]
IEEE signal processing magazine , volume=
The mnist database of handwritten digit images for machine learning research [best of the web] , author=. IEEE signal processing magazine , volume=. 2012 , publisher=
2012
-
[45]
Proceedings of the AAAI/ACM Conference on AI, Ethics, and Society , volume=
Systemizing multiplicity: The curious case of arbitrariness in machine learning , author=. Proceedings of the AAAI/ACM Conference on AI, Ethics, and Society , volume=
-
[46]
Journal of Behavioral Decision Making , volume=
Ambiguity and rationality , author=. Journal of Behavioral Decision Making , volume=. 1988 , publisher=
1988
-
[47]
Proceedings of the AAAI Conference on Artificial Intelligence , volume=
Predictive multiplicity in probabilistic classification , author=. Proceedings of the AAAI Conference on Artificial Intelligence , volume=
-
[48]
Proceedings of the 2022 ACM conference on fairness, accountability, and transparency , pages=
Model multiplicity: Opportunities, concerns, and solutions , author=. Proceedings of the 2022 ACM conference on fairness, accountability, and transparency , pages=
2022
-
[49]
arXiv preprint arXiv:2111.08230 , year=
Selective ensembles for consistent predictions , author=. arXiv preprint arXiv:2111.08230 , year=
-
[50]
arXiv preprint arXiv:2407.04846 , year=
Amazing things come from having many good models , author=. arXiv preprint arXiv:2407.04846 , year=
-
[51]
arXiv preprint arXiv:2306.09425 , year=
Arbitrariness lies beyond the fairness-accuracy frontier , author=. arXiv preprint arXiv:2306.09425 , year=
-
[52]
Proceedings of the 2025 CHI Conference on Human Factors in Computing Systems , pages=
Perceptions of the Fairness Impacts of Multiplicity in Machine Learning , author=. Proceedings of the 2025 CHI Conference on Human Factors in Computing Systems , pages=
2025
-
[53]
Behavioral Science , volume=
On the notions of ambiguity and information loss , author=. Behavioral Science , volume=. 1977 , publisher=
1977
-
[54]
Fuzzy sets and systems , volume=
Where do we stand on measures of uncertainty, ambiguity, fuzziness, and the like? , author=. Fuzzy sets and systems , volume=. 1987 , publisher=
1987
-
[55]
Advances in neural information processing systems , volume=
Neural network ensembles, cross validation, and active learning , author=. Advances in neural information processing systems , volume=
-
[56]
International Joint Conference on Rough Sets , pages=
Three--way classification: Ambiguity and abstention in machine learning , author=. International Joint Conference on Rough Sets , pages=. 2019 , organization=
2019
-
[57]
BMC Emergency Medicine , volume=
Improving triage performance in emergency departments using machine learning and natural language processing: a systematic review , author=. BMC Emergency Medicine , volume=. 2024 , publisher=
2024
-
[58]
Fairness and machine learning , author=
-
[59]
ACM Transactions on Interactive Intelligent Systems (TiiS) , volume=
Using machine learning to support qualitative coding in social science: Shifting the focus to ambiguity , author=. ACM Transactions on Interactive Intelligent Systems (TiiS) , volume=. 2018 , publisher=
2018
-
[60]
arXiv preprint arXiv:2312.06077 , year=
An Ambiguity Measure for Recognizing the Unknowns in Deep Learning , author=. arXiv preprint arXiv:2312.06077 , year=
-
[61]
Multi-objective evolutionary optimisation for product design and manufacturing , pages=
Multi-objective optimisation using evolutionary algorithms: an introduction , author=. Multi-objective evolutionary optimisation for product design and manufacturing , pages=. 2011 , publisher=
2011
-
[62]
Learning internal representations by error propagation , author=
-
[63]
Proceedings of the IEEE , volume=
A survey on learning to reject , author=. Proceedings of the IEEE , volume=. 2023 , publisher=
2023
-
[64]
Journal of Machine learning research , volume=
Statistical comparisons of classifiers over multiple data sets , author=. Journal of Machine learning research , volume=
-
[65]
ACM computing surveys (CSUR) , volume=
A survey on concept drift adaptation , author=. ACM computing surveys (CSUR) , volume=. 2014 , publisher=
2014
Reviewed August 16, 2026 · model on record in the stance chip above.
Discussion (0). Continue with ORCID to comment.