REVIEW 3 major objections 5 minor 34 references
Simulating realistic radio continuum survey maps with diffusion models
T0 review · 3 major / 5 minor · reviewed 2026-08-07 · deepseek-v4-flash
Pith's one-line read A diffusion model trained on real LoTSS images can generate synthetic LOFAR survey maps whose source fluxes, sizes, and noise levels match actual observations.
desk verdict A transparent, well-scoped simulation pipeline that produces plausible LOFAR-like maps at the marginal-statistics level; the untested morphology-flux independence is a real gap but not a fatal one. read the letter →
The pith
A machine-rendered reading of the paper's core claim, the machinery that carries it, and where it could break.
The reading
What carries the argument
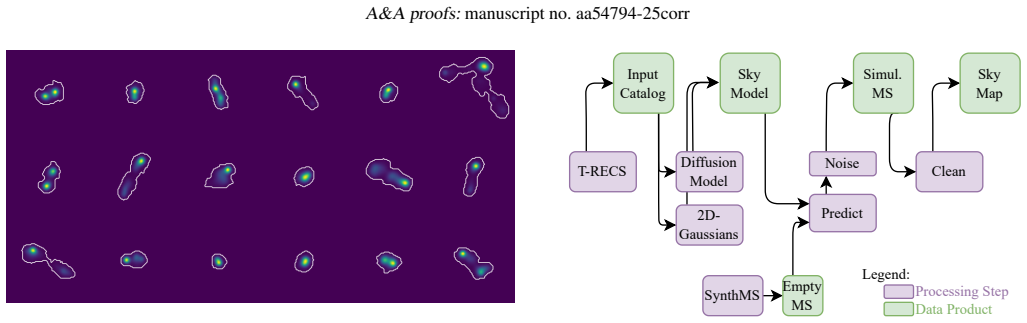
The central object is a size-conditioned diffusion model: a U-Net denoiser trained with continuous-time denoising on 23,246 masked, background-free LoTSS-DR2 cutouts, conditioned on the source size defined as the maximum distance between two pixels of the source mask (Box-Cox transformed), with arbitrary-angle rotation augmentation. This network is what turns a catalog entry into a realistic extended radio galaxy image, giving the simulator explicit control over angular size. The rest of the pipeline, catalog positions and fluxes from T-RECS, 2D Gaussian models for compact sources, DDFacet visibility prediction, LoSiTo noise, and Högbom cleanup, carries those images through a realistic LOFAR observation. The effective resolution is set by the identity $\sigma_{\mathrm{Lim}}=\sqrt{\sigma_{\mathrm{Min}}^2+\sigma_{\mathrm{Beam}}^2}=\sqrt{2}\,\sigma_{\mathrm{Beam}}\approx 8.5^{\prime\prime}$, because the sky model already has the $6^{\prime\prime}$ LoTSS resolution imprinted on it and the simulated telescope response convolves with the $6^{\prime\prime}$ beam once more.
What would settle it
Run PyBDSF on the simulated map and on LoTSS-DR2 with identical settings, then compare the joint distribution of integrated flux and morphological indicators such as major-axis size, compactness, or Fanaroff-Riley class. A statistically significant flux-dependent morphology trend in the real data that is absent in the simulation would falsify the realism claim even if the marginal flux and size histograms agree, and the 20 to 70 arcsecond deficit in the simulated size distribution is a direct place to test the discrepancy.
Extended reading notes
Core claim
On the paper's own terms, the discovery is that a size-conditioned diffusion model can serve as the morphology engine of a full radio-survey simulator. Trained on 23,246 masked, background-free cutouts drawn from LoTSS-DR2, the model synthesizes resolved AGN images whose pixel statistics, mask areas, sizes, and compactness closely reproduce the training data, with a size-conditioning error of about one pixel (mean offset 0.89 pixels, standard deviation 0.97 pixels). Assembling those images with catalog fluxes and positions from T-RECS, adding Gaussian models for compact and star-forming sources, predicting visibilities with DDFacet, adding LoSiTo noise, and cleaning with Högbom's algorithm yields a 5-by-5-degree map whose integrated and peak flux histograms and major-axis size distribution match real LoTSS-DR2 data, and whose residual RMS of 76.3 microjansky per beam is compatible with the 83 microjansky per beam median sensitivity of the real survey. The paper also reports the main deviations: an excess of 1 to 10 mJy sources from incomplete cleaning, a deficit of 20 to 70 arcsecond extended sources, and a hard cutoff in the integrated flux distribution around 1 Jy, attributed to the exclusion of bright sources.
Load-bearing premise
The load-bearing premise is that a radio source's shape and internal structure are independent of its integrated brightness, so the simulator can draw morphology from the diffusion model and flux from the catalog separately; if real sources obey a morphology-flux relation, the joint statistics of the simulated maps will be wrong even when the marginal flux and size histograms match.
Editorial extensions
If this is right
- Calibration, source-finding, and source-characterization pipelines can be tested end to end on synthetic visibilities and maps whose input sky is exactly known.
- Statistical cosmology studies, such as angular clustering measurements, can draw many independent realizations of the same sky with realistic selection and noise instead of purely random source positions.
- Because positions, fluxes, sizes, and morphologies are controlled independently, the framework can isolate how each property affects survey completeness and measured source statistics.
- The same pipeline transfers to other radio instruments by exchanging the measurement-set template, station beam model, and training images.
- The size-conditioned diffusion model provides a controllable generator of radio galaxy images for training or augmenting machine-learning detection and classification algorithms.
Reading between the lines
- Beyond the paper, the joint distribution of morphology and flux is the untested quantity that matters most; a class- or flux-conditioned diffusion model could repair the assumed independence, and the needed correction is measurable from current LoTSS-DR2 catalogs.
- The 8.5-arcsecond effective resolution means the current simulator cannot validate next-generation, higher-resolution instruments; retraining the diffusion model on higher-resolution or hydrodynamically simulated images is the natural next step, which the paper identifies but does not implement.
- One testable extension not pursued here: replace the training-histogram resampling of sizes with catalog-based angular sizes corrected for the mask-selection bias, then check whether the 20 to 70 arcsecond deficit in the simulated size distribution disappears.
- Because positions can be randomized while fluxes and morphologies are held fixed, the pipeline could generate matched map pairs to calibrate systematic errors in two-point statistics, a use the paper mentions qualitatively but does not quantify.
Editorial analysis
A structured set of objections, weighed in public.
Referee Report
Summary. The paper presents MASSIMO, an end-to-end software pipeline that simulates LoTSS-like LOFAR continuum maps. A t-recs catalog supplies source positions, fluxes, and sizes; extended AGN images are synthesized with a diffusion model trained on masked LoTSS-DR2 cutouts and conditioned on source size, while unresolved AGN and star-forming galaxies are modeled as 2D Gaussians. These components are assembled into a 5x5 degree sky model, converted to visibilities with DDFacet in predict mode, given realistic noise with LoSiTo, and cleaned with DDFacet's Högbom algorithm. The authors evaluate the diffusion model by comparing pixel statistics, mask properties, and size conditioning against the training data, and evaluate the final maps by comparing PyBDSF catalogs of the simulated map against LoTSS-DR2 catalogs in integrated flux, peak flux, major axis, and residual RMS. The paper claims that the simulated maps are realistic LOFAR observations with source flux and size distributions matching real data and with sensitivities compatible with LoTSS.
Significance. If the realism claims are supported, this is a useful contribution for the radio-astronomy simulation toolkit: it provides an end-to-end path from a cosmological source catalog to visibilities and cleaned maps, with a diffusion model that generates diverse radio galaxy morphologies with controllable sizes. The strengths of the paper include the transparent data-curation statistics in Fig. 1 and Table 1, the quantitative evaluation of generated images in Fig. 5, the end-to-end validation against LoTSS-DR2 catalogs in Fig. 9, the RMS comparison in Section 5.3, and the unusually candid discussion of limitations in Section 6. However, the central evidence for realism is based on marginal histograms, and at least two of the agreements are either partly imposed by construction (extended-source sizes are resampled from the training distribution) or rest on an untested independence assumption (morphology and brightness are generated independently). The significance of the paper therefore depends on either additional joint-distribution validation or a more carefully scoped statement of what the simulator can and cannot reproduce.
major comments (3)
- [§3.2, §6] The pipeline generates morphology and integrated flux independently, as stated in §3.2: 'the approach taken in this work inherently assumes that morphology and brightness of the sources are intrinsically unrelated.' The validation in §4.2 and §5.2 compares only the marginal histograms of integrated flux, peak flux, and major axis in Fig. 9. Marginal agreement does not constrain the joint distribution of morphology and flux, which is exactly what is needed for completeness corrections, source-count cosmology, and morphology-dependent analyses. Since the abstract claims the simulated maps are 'realistic LOFAR observations', this is a load-bearing gap. I recommend either adding a joint test (for example, the fraction of resolved or extended sources as a function of flux, or FR class fraction versus flux, in the simulated map versus LoTSS-DR2) or explicitly restricting the realism claim to marginal statistics. The discussion in §6 cites Saripalli et al. (2012) as evidence that the assumption may fail, but a citation is not a substitute for quantifying the resulting bias.
- [§3.2, §5.2] Extended AGN sizes are not taken from the t-recs catalog; they are resampled from a 100-bin histogram of the training data sizes, as described in §3.2. Consequently, the close match of the major-axis distribution in Fig. 9 (bottom) is to a large extent imposed by construction rather than independently predicted. The paper acknowledges this in §6, but the abstract and §5.2 present the size agreement as evidence of realism. I recommend validating the size distribution against an independent source of sizes (for example, t-recs angular sizes after a defined conversion to a LoTSS restoring-beam convention, or a held-out LoTSS sample) and stating separately which part of the size agreement tests the pipeline and which part is inherited from the training data.
- [§3.3, Eq. (2), Fig. 9] The simulated maps have an effective resolution of 8.5 arcsec by construction, as derived in Eq. (2), which is 2.5 arcsec worse than the native 6 arcsec LoTSS resolution used for comparison. The shift of the size distribution peak from roughly 6 arcsec to roughly 8.5 arcsec in Fig. 9 is therefore expected, as are reduced peak fluxes. The paper notes this, but it does not quantify how much of the peak-flux and size differences in Fig. 9 is attributable to this resolution mismatch rather than to cleaning artifacts or source modeling. I suggest comparing the simulated map against a LoTSS map convolved to 8.5 arcsec, or at least overlaying the expected shift from Eq. (2) on the histograms, so that the residual differences measure the quality of the simulation rather than a known resolution difference.
minor comments (5)
- [§1] The introduction says 'In Section 5.1 we describe our implementation of the generative model', but Section 5.1 is in the results; the generative model is described in Section 2.
- [§2.1] There is a grammatical typo in the sentence 'We computes this value for every cutout individually'; it should be 'We compute'.
- [§3.1] The text contains a duplicated word: 'which differ in their evolutionary model and and dust emission properties' should read 'and dust emission properties'.
- [Appendix B] The text describing Fig. B.2 is confusing: it says cutouts with high noise are excluded in the S/Nσ step but refers to Fig. B.2, whose caption describes cutouts 'after applying the S/Nσ cut'. Please clarify which figure shows the excluded cutouts and which shows the surviving ones.
- [§7] The data-availability statement says the code 'will be made available' at a GitHub URL. Since reproducibility is a strength of this work, please ensure the repository is publicly accessible at the time of publication.
Circularity Check
No significant circularity: the pipeline is a forward-model simulation whose realism checks rely on external inputs (t-recs, LoSiTo instrument noise) plus disclosed consistency checks of the generative model.
full rationale
The paper's central claim is that the MASSIMO pipeline produces realistic LOFAR-like maps, not that it derives the observed flux or size distributions from first principles. Fluxes come from the independent t-recs simulation, noise from the LoSiTo instrument simulator, and source morphologies from a diffusion model trained on LoTSS-DR2 cutouts; the final maps are then compared with LoTSS-DR2 catalogs. This is a forward-model validation, so the marginal agreement in fluxes, sizes, and RMS is not a circular prediction. The one by-construction element is explicitly disclosed: in Sec. 5.1 the paper notes that 'the histogram over the training data is the same one that was used to draw sizes as conditioning input for the DM. Hence, we expect those distributions to match if the conditioning mechanism is learned well.' That statement is a calibration check of the conditioning mechanism, not a claimed independent prediction, and the final map size comparison still exercises the full telescope simulation (beam convolution, cleaning, PyBDSF). The acknowledged morphology-flux independence assumption (Sec. 3.2, further discussed in Sec. 6 with Saripalli et al. 2012) is a realism limitation concerning joint statistics, not a circularity in the derivation chain. Self-citations to Vičánek Martínez et al. (2024) for architecture and conditioning methodology are not load-bearing: the model is implemented, retrained, and evaluated in the present work, so the cited prior work does not substitute for evidence here. No uniqueness theorem, fitted-parameter-as-prediction, or renaming of known results is present. Overall, the derivation chain is self-contained and the disclosed limitations do not amount to circular reasoning.
Assumptions & free parameters
free parameters (7)
- S/N sigma threshold =
5.0
- Mask edge max criterion =
0.05 (fraction of max pixel)
- Bright source flux cutoff =
2 Jy in sky model, effectively 1 Jy in final map
- Training size histogram for extended AGN =
100-bin histogram of mask sizes
- Gaussian blur kernel for Gaussian sources =
FWHM = 4 px (6 arcsec)
- Cleaning mask threshold =
5e-5 Jy/beam
- DDFacet cleaning parameters =
MaxMajorIter=20, MaxMinorIter=2e7, RMSFactor=0.5, PeakFactor=0.2
assumptions (5)
- domain assumption Morphology and integrated flux of radio sources are independent.
- domain assumption The t-recs simulation produces a realistic catalog of radio source positions, fluxes, and sizes.
- domain assumption The curated LoTSS training set is representative of real resolved radio galaxy morphologies.
- domain assumption DDFacet predict mode and LoSiTo noise accurately emulate a real LoTSS observation.
- domain assumption Source sizes in the t-recs catalog are uncorrelated with flux and position.
Cite this review
Pith. "Pith review of Simulating realistic radio continuum survey maps with diffusion models." pith.science (2026). https://pith.science/paper/OZ2SW7WS
@misc{pith2026250611715,
  author       = {Pith},
  title        = {Pith review of: Simulating realistic radio continuum survey maps with diffusion models},
  year         = {2026},
  howpublished = {\url{https://pith.science/paper/OZ2SW7WS}},
  note         = {Machine review of arXiv:2506.11715}
}
read the original abstract
The next generation of radio surveys is going to be transformative for cosmology and other aspects of our understanding of astrophysics. Realistic simulations of radio observations are essential for the design and planning of radio surveys. They are employed in the development of methods for tasks, such as data calibration and reduction, automated analysis and statistical studies in cosmology. We implemented a software for machine learning-assisted simulations of realistic surveys with the LOFAR telescope, resulting in a synthetic radio sky model and a corresponding artificial telescope observation. We employed a diffusion model trained on LoTSS observations to generate individual radio galaxy images with control over the angular size. Single sources are assembled into a radio sky model, using an input catalog from cosmological simulations. We then transformed this sky model into visibilities corresponding to a typical LoTSS pointing. We added realistic noise to this synthetic measurement and obtained our final simulated sky maps through deconvolution. We explored different ways to evaluate our resulting sky model. We were able to simulate realistic LOFAR observations, covering a sky patch of 5x5 degrees at an effective resolution of 8.5 arcseconds. The simulated sources have flux and size distributions that match real observations, and the resulting maps have sensitivities compatible with LoTSS observations. Our diffusion model is able to synthesize high-quality realistic radio galaxy images with precise control over the source sizes. This software can readily be applied to other instruments.
Figures


Figures from the paper (6 more)


Reference graph
Works this paper leans on
-
[1]
M., Lim , P
Astropy Collaboration , Price-Whelan , A. M., Lim , P. L., et al. 2022, , 935, 167
2022
-
[2]
2025, arXiv e-prints, arXiv:2503.19111
Baron Perez , N., Br ''uggen , M., Kasieczka , G., & Lucie-Smith , L. 2025, arXiv e-prints, arXiv:2503.19111
arXiv 2025
-
[3]
Bastien , D. J., Scaife , A. M. M., Tang , H., Bowles , M., & Porter , F. 2021, , 503, 3351
work page 2021
- [4]
-
[5]
2018, Monthly Notices of the Royal Astronomical Society, 482, 2–19
Bonaldi, A., Bonato, M., Galluzzi, V., et al. 2018, Monthly Notices of the Royal Astronomical Society, 482, 2–19
work page 2018
-
[6]
Box, G. E. P. & Cox, D. R. 1964, Journal of the Royal Statistical Society. Series B (Methodological), 26, 211
work page 1964
- [7]
-
[8]
Drake, A. B., Smith, D. J. B., Hardcastle, M. J., et al. 2024, Monthly Notices of the Royal Astronomical Society, 534, 1107–1126
work page 2024
Show all 34 references
-
[9]
W., de Gasperin , F., & Rafferty , D
Edler , H. W., de Gasperin , F., & Rafferty , D. 2021, , 652, A37
2021
-
[10]
Fanaroff , B. L. & Riley , J. M. 1974, , 167, 31P
1974
-
[11]
L., Schwarz, D
Hale, C. L., Schwarz, D. J., Best, P. N., et al. 2023, Cosmology from LOFAR Two-metre Sky Survey Data Release 2: Angular Clustering of Radio Sources
2023
-
[12]
J., Horton, M
Hardcastle, M. J., Horton, M. A., Williams, W. L., et al. 2023, , 678, A151
2023
-
[13]
2023, Monthly Notices of the Royal Astronomical Society, 523, 1967–1993
Hartley, P., Bonaldi, A., Braun, R., et al. 2023, Monthly Notices of the Royal Astronomical Society, 523, 1967–1993
2023
-
[14]
H \"o gbom , J. A. 1974, , 15, 417
1974
-
[15]
Landy, S. D. & Szalay, A. S. 1993, The Astrophysical Journal, 412, 64
1993
-
[16]
K., Tolley , E., Parth Krishna , S., & Kneib , J.-P
Mishra , A. K., Tolley , E., Parth Krishna , S., & Kneib , J.-P. 2024, arXiv e-prints, arXiv:2411.15559
2024 arXiv
-
[17]
& Rafferty , D
Mohan , N. & Rafferty , D. 2015, PyBDSF: Python Blob Detection and Source Finder , Astrophysics Source Code Library, record ascl:1502.007
2015
-
[18]
M., et al
Pashapour-Ahmadabadi , M., B \"o hme , L., Siewert , T. M., et al. 2025, arXiv e-prints, arXiv:2504.20723
2025 arXiv
-
[19]
Ronneberger, O., Fischer, P., & Brox, T. 2015, in Medical image computing and computer-assisted intervention--MICCAI 2015: 18th international conference, Munich, Germany, October 5-9, 2015, proceedings, part III 18, Springer, 234--241
2015
-
[20]
2023, RAS Techniques and Instruments, 2, 264
Rustige , L., Kummer , J., Griese , F., et al. 2023, RAS Techniques and Instruments, 2, 264
2023
-
[21]
2012, The Astrophysical Journal Supplement Series, 199, 27
Saripalli, L., Subrahmanyan, R., Thorat, K., et al. 2012, The Astrophysical Journal Supplement Series, 199, 27
2012
-
[22]
W., Hardcastle , M
Shimwell , T. W., Hardcastle , M. J., Tasse , C., et al. 2022 a , , 659, A1
2022
-
[23]
W., Hardcastle , M
Shimwell , T. W., Hardcastle , M. J., Tasse , C., et al. 2022 b , The LOFAR Two-metre Sky Survey (LoTSS) V. Second data release (P181+40), https://hdl.handle.net/11112/ECE9E7E0-F1DD-433C-A87B-4A1170A3AC42
2022
-
[24]
W., Hardcastle , M
Shimwell , T. W., Hardcastle , M. J., Tasse , C., et al. 2022 c , The LOFAR Two-metre Sky Survey (LoTSS) V. Second data release (P000+23), https://hdl.handle.net/11112/3A724AB9-B43D-4805-BF40-B669935691B2
2022
-
[25]
W., R \"o ttgering , H
Shimwell , T. W., R \"o ttgering , H. J. A., Best , P. N., et al. 2017, , 598, A104
2017
-
[26]
W., Tasse, C., Hardcastle, M
Shimwell, T. W., Tasse, C., Hardcastle, M. J., et al. 2019, , 622, A1
2019
-
[27]
2018, , 611, A87
Tasse, C., Hugo, B., Mirmont, M., et al. 2018, , 611, A87
2018
-
[28]
L., Nunez-Iglesias, J., et al
van der Walt, S., Sch\" o nberger, J. L., Nunez-Iglesias, J., et al. 2014, PeerJ, 2, e453
2014
-
[29]
P., Wise, M
van Haarlem, M. P., Wise, M. W., Gunst, A. W., et al. 2013, , 556, A2
2013
-
[30]
2024, Comparative Analysis of Generative Models: Enhancing Image Synthesis with VAEs, GANs, and Stable Diffusion
Vivekananthan, S. 2024, Comparative Analysis of Generative Models: Enhancing Image Synthesis with VAEs, GANs, and Stable Diffusion
2024
-
[31]
2024, , 691, A360
Vičánek Martínez, T., Baron Perez, N., & Br\" u ggen, M. 2024, , 691, A360
2024
-
[32]
M., Shabala, S
Yates-Jones, P. M., Shabala, S. S., Power, C., et al. 2023, Publications of the Astronomical Society of Australia, 40
2023
-
[33]
, " * write output.state after.block = add.period write newline
ENTRY address archiveprefix author booktitle chapter edition editor howpublished institution eprint journal key month note number organization pages publisher school series title type volume year label extra.label sort.label short.list INTEGERS output.state before.all mid.sent...
-
[34]
write newline
" write newline "" before.all 'output.state := FUNCTION n.dashify 't := "" t empty not t #1 #1 substring "-" = t #1 #2 substring "--" = not "--" * t #2 global.max substring 't := t #1 #1 substring "-" = "-" * t #2 global.max substring 't := while if t #1 #1 substring * t #2 gl...
Reviewed August 7, 2026 · model on record in the stance chip above.
Discussion (0). Continue with ORCID to comment.