REVIEW 3 major objections 4 minor 88 references
The bright shock front 3E in the B335 protostellar jet was launched around 2014, when the protostar's still-ongoing accretion outburst began, making jet shock strings readable as an eruption timeline.
Reviewed by Pith at T0; open to challenge. T0 means a machine referee read the full paper against a public rubric. the ladder, T0–T4 →
T0 review · deepseek-v4-flash
2026-08-02 23:54 UTC pith:P3LB6TT2
load-bearing objection A careful two-epoch JWST study that gives B335's jet a credible eruption timeline; the 3E launch date is the main claim, and it rests on an assumption the authors state clearly. the 3 major comments →
The Outflow of the B335 Protostar II: After the Outburst
The pith
A machine-rendered reading of the paper's core claim, the machinery that carries it, and where it could break.
Core claim
Using two epochs of JWST/NIRCam F444W images bracketing the protostar B335, the authors measure the proper motions of a string of shock fronts in the protostar's jet. The brightest and most compact shock, 3E, moves at 208 km/s; dividing its distance from the protostar by this speed gives a kinematic age of about 8.6 years at the epoch of the 2023 image, placing its ejection around 2014. The NEOWISE light curve shows B335 rising into a major outburst near that time, so the authors conclude that 3E is the working surface where the fast, hot wind from the current accretion event is slamming into slower material ejected earlier. Spectra from NIRSpec IFU show that 3E is uniquely rich in CO emissi
What carries the argument
The load-bearing tool is the two-epoch proper-motion measurement: NIRCam F444W images from April 2023 and April 2024 were aligned using background stars and compact extragalactic sources, corrected for the protostar's own 16.7 km/s proper motion measured from archival ALMA and VLA data, and the shift of each shock front between epochs yields a transverse velocity. Dividing each shock's projected distance from the protostar by this velocity gives a kinematic age — the inferred time since ejection — which is then matched against the NEOWISE infrared light curve. The ice and extinction maps rest on NIRCam photometry of background stars in four filters, using the F300M filter's position inside t
Load-bearing premise
The ejection date of shock 3E assumes each shock front has moved at constant speed in a straight line from the protostar since launch, and that B335 is at 165 pc; if the jet has decelerated, precessed, or the distance is wrong, the launch epoch shifts.
What would settle it
Obtain a third epoch of NIRCam imaging of B335 in 2025 or later and re-measure the position of shock 3E: if its speed has decreased since 2023–2024, the constant-velocity back-projection is invalid and the claimed 2014 launch coincident with the outburst is not established. Alternatively, the ALMA 'molecular bullet' seen in 2017 with a kinematic age of 1.7 yr (launch ~2016) provides a direct cross-check; if it traces the same ejection as 3E, the two ages must agree.
If this is right
- The chain of shock fronts in a protostellar jet becomes a readable timeline of accretion eruptions, with the spacing and brightness of knots encoding when the star gulped material.
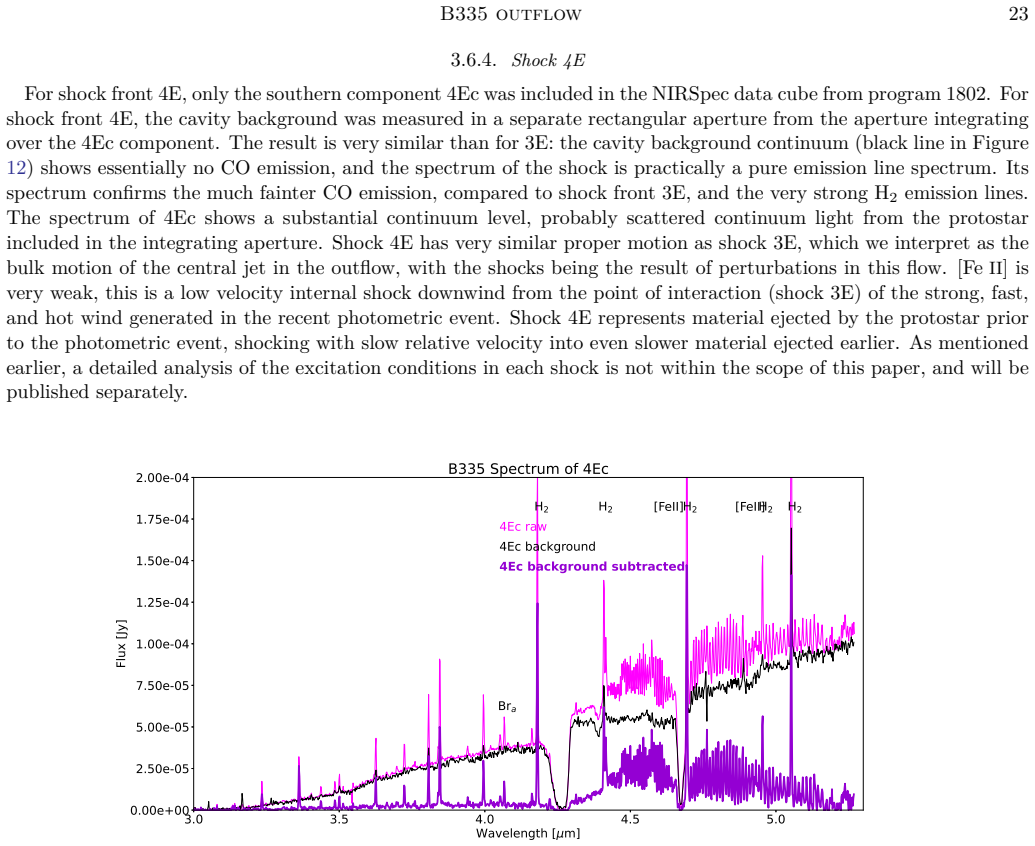
- The excitation sequence along the jet — CO-dominated at 3E, H2-dominated at 4E and beyond — charts the evolution of the eruption's wind from hot and fast to cooler and slower.
- The outflow cavity is confirmed as a dust-and-ice-poor channel; sight lines through it will show lower extinction and weaker ice features, a geometric effect that must be included when deriving protostellar ice abundances.
- The inferred 1999–2001 ejection of shock 4E, together with the 2004 Spitzer brightness, suggests B335's eruptions are recurrent on roughly decadal timescales.
Where Pith is reading between the lines
- If shock strings really are eruption chronometers, then applying the same two-epoch technique to a sample of embedded protostars could map the frequency and amplitude of FUor/EXor outbursts across the low-mass population, a measurement that is currently almost impossible by monitoring alone.
- The authors' own association of the ALMA 'molecular bullet' (launch ~2016) with shock 3E (back-projected launch ~2014) is an untested joint story; a dedicated model of that connection — or a third imaging epoch — could discriminate between constant-velocity propagation and deceleration.
- The fast-moving shadow features in the reflection nebula, interpreted as absorbing clumps at a few AU, could be tracked in future epochs to measure their Keplerian orbits, offering a kinematic probe of disk-wind launch radii.
Editorial analysis
A structured set of objections, weighed in public.
Referee Report
Summary. This paper presents JWST/NIRCam two-epoch (2023 and 2024) imaging and NIRSpec IFU spectroscopy of the embedded protostar B335 and its outflow. The authors measure proper motions of a chain of near-infrared shock fronts, derive kinematic ages from angular separation divided by proper motion, and argue that the brightest inner shock, 3E, was launched during the early phase of the ongoing accretion outburst (Table 1, §3.5). They also construct maps of continuum extinction and H2O ice column density from background-star photometry, and extract scattered-light spectra of the outflow cavity, concluding that the outflow has carved a cavity with reduced dust and ice. A secondary result is a very large extinction increase toward the protostar (~200 mag A_V in the inner 4"). The paper frames the shock string as a timeline of episodic accretion events.
Significance. If the kinematic-age interpretation is correct, this is one of the first direct connections between a protostellar accretion outburst and individual jet shock fronts, made possible by ~2 mas astrometry from a one-year JWST baseline. The cavity-carving conclusion is carefully supported by three largely independent tracers: background-star photometry, coreshine imaging, and scattered-light spectroscopy. The authors are appropriately cautious about many calibration issues (absolute extinction, photometric ice calibration, background reference frame), and the proper-motion measurements themselves are a valuable addition. The paper also demonstrates the utility of public JWST data and includes a thoughtful analysis of variable shadow effects in the reflection nebula.
major comments (3)
- [§3.5, Table 1] The kinematic ages are computed as θ/μ, which assumes constant-velocity straight-line motion from the protostar. For an internal shock such as 3E — explicitly identified as a working surface between fast newly ejected wind and slower older jet gas (§3.6.3) — the measured proper motion is a pattern speed, not necessarily the launch speed of the ejecta. If the shock has decelerated, t_kin = θ/μ is an upper limit on the true age, and the ejection date could be later than 2014. The one-year NIRCam baseline cannot detect acceleration. The paper should either justify constant-velocity propagation (e.g., with a simple two-flow model of internal shocks in a pulsed jet) or explicitly present the ages as upper/lower limits. This is load-bearing because the central claim — that 3E was launched in the early outburst phase — depends on the precise ejection date.
- [§3.5, §3.6.3, ALMA bullet] The paper states that the ALMA 'molecular bullet' with a 2017 kinematic age of 1.7 yr (launch ~2015.3) is 'almost certainly related to shock front 3E'. However, Table 1 gives a 2014 ejection for 3E, a ~1.3 yr offset. If both tracers refer to the same event, this discrepancy may indicate that the simple θ/μ age is biased. The authors should discuss this comparison quantitatively and assess whether the offset is consistent with the quoted uncertainties and with the deceleration concern raised above.
- [§3.7.1, Summary] The absolute A_V values toward the protostar are derived assuming a flat intrinsic protostar spectrum, as the paper acknowledges ('nominal extinction values that incorrectly assume a flat spectrum'). The relative increase between apertures is more robust because the illuminating spectrum is assumed common. However, the Summary states that the ~200 mag increase 'establishes a lower limit for the total extinction towards the protostar.' This is not strictly supported: if the intrinsic spectrum were redder than assumed, the derived extinction could be lower. Please rephrase to avoid an unwarranted lower-limit claim, or state the explicit assumption under which it holds.
minor comments (4)
- [Table 1] The 7E row lists Kin. Age = 130 yr and Eject Year = 1983. Relative to the 2023 epoch, 130 yr implies 1893, not 1983. Other rows are consistent with Eject Year = 2023 − Kin. Age. Please check and correct this apparent typo.
- [Figure 5] The vertical line for the 'Shock 3E Ejection' relies on the kinematic age from Table 1. Given the major-comment concern about the constant-velocity assumption, the figure caption should note that this is a model-dependent estimate, not a direct measurement.
- [§3.2, Appendix B] The photometric H2O ice column density map uses a single calibration star (NIRS38) to convert photometric τ to spectroscopic τ. The paper appropriately states this map is used only qualitatively, but the factor 1.44 is presented as 'our best estimate.' Please state the systematic uncertainty associated with this single-star calibration.
- [§3.7.1, Figure 19] The baseline level of A_V = 130 at 3.5'' is mentioned only in the figure caption. The text would be clearer if the baseline and the resulting total extinction toward the protostar were stated explicitly in the body of the paper.
Circularity Check
No significant circularity: kinematic ages are measured from independent two-epoch astrometry and compared with an external light curve, not fitted to it.
full rationale
The paper's central claim—that shock 3E was launched in the early phase of the current outburst—is derived from an independent chain: two-epoch JWST/NIRCam astrometry gives proper motions, the ALMA-registered protostar position gives separations, and the kinematic age is computed as angular separation divided by proper motion. The resulting date is then overlaid on the published WISE/NEOWISE light curve (Evans et al. 2023). No parameter is fitted to the light curve, the ejection date is not defined in terms of the outburst, and the comparison is therefore not self-definitional. The extinction and ice maps are also independent observables: background-star photometry and NIRSpec spectra of scattered light both show reduced column density in the outflow cavity, and the 1.44 photometric calibration factor in Appendix B is taken from an external spectrum (McClure et al. 2023), not from B335's own target result. Self-citations to Paper I (Hodapp et al. 2024) are used for shock identification and nomenclature, but the new proper-motion measurements do not depend on Paper I's values; the central claim does not reduce to a self-citation. The skeptical concern about deceleration of the shock working surface is a physical assumption that could weaken the interpretation, but it is not a circularity: the paper does not assume the conclusion when deriving the kinematic age. Overall, the derivation is self-contained and externally anchored; no circular step was identified.
Axiom & Free-Parameter Ledger
free parameters (1)
- Photometric-to-spectroscopic H2O ice tau calibration factor =
1.44
axioms (5)
- domain assumption Distance to B335 is 165 pc
- domain assumption Shock fronts propagate at constant velocity in a straight line from the protostar since ejection
- domain assumption Background stars and extragalactic sources define an inertial reference frame, with protostar proper motion applied from ALMA
- domain assumption Intrinsic near-IR colors of background stars are approximately constant
- domain assumption All cavity positions are illuminated by the same protostar spectrum
read the original abstract
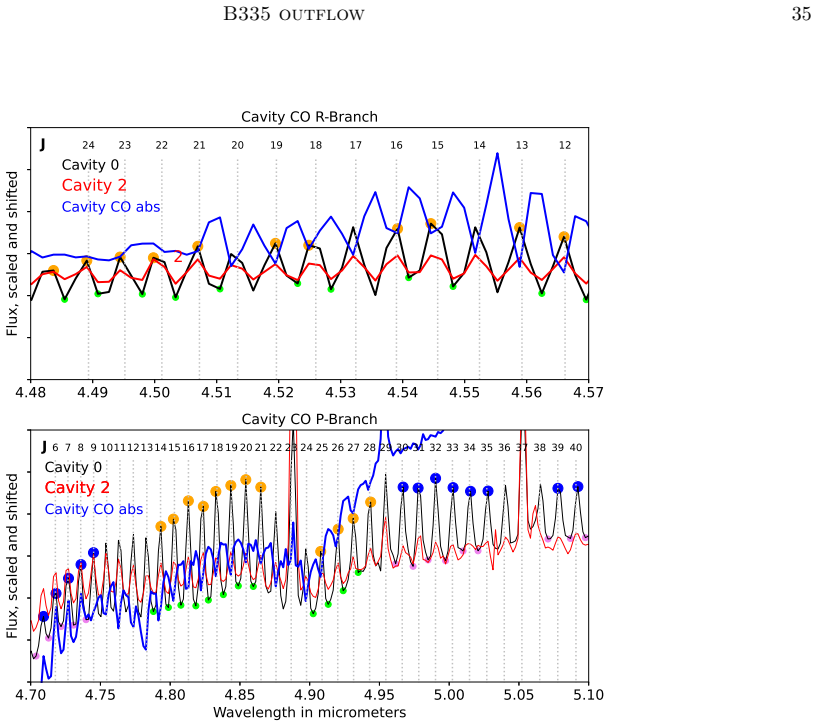
The B335 protostar has recently undergone a major, still ongoing, outburst detected in scattered light from its outflow cavity, offering a rare opportunity to study its impact on a protostellar jet. We use JWST/NIRCam photometry of background stars behind B335 from 2.7 to 4.4 $\mu$m to map extinction and H$_2$O ice absorption, showing that the outflow has carved a cavity in the molecular core. We measure proper motions of shock fronts emerging from the protostar of 131--227 km s$^{-1}$. The kinematic age of the most prominent shock front, 3E, corresponds to the early phase of the current outburst. JWST/NIRSpec IFU data show that the youngest shock, 2E, exhibits ionic lines but no molecular emission. Shock 3E shows strong CO emission together with H$_2$ and [\ion{Fe}{2}], whereas older shocks show weaker CO and are dominated by H$_2$ and [\ion{Fe}{2}]. The feature 0E, closest to the protostar, appears to be a stationary shock. CO-line-removed spectra near the protostar show that the unsaturated absorption features of $^{13}$CO$_2$, OCN$^-$, and OCS increase strongly toward the source. The ice properties are otherwise similar to those along lower-extinction sight lines. In the central bipolar reflection nebula, CO gas is seen in scattered emission from the immediate protostellar surroundings, but a few arcsec farther out, absorption by cooler CO gas in the outflow cavity is detected.
Figures






Reference graph
Works this paper leans on
-
[1]
doi:10.1051/0004-6361/201015999
Aikawa, Y., Kamuro, D., Sakon, I., et al.\ 2012, , 538, A57. doi:10.1051/0004-6361/201015999
-
[2]
L., et al.\ 2009, , 692, 2, L67
Aspin, C., Reipurth, B., Beck, T. L., et al.\ 2009, , 692, 2, L67. doi:10.1088/0004-637X/692/2/L67
-
[3]
F., & Curiel, S.\ 2001, , 37, 201
Avila, R., Rodr \' guez, L. F., & Curiel, S.\ 2001, , 37, 201
2001
-
[4]
E., Frost, E
Barnard, E. E., Frost, E. B., & Calvert, M. R.\ 1927, [Washington] Carnegie institution of Washington, 1927
1927
-
[5]
Bertrang, G., Wolf, S., & Das, H. S.\ 2014, , 565, A94. doi:10.1051/0004-6361/201323091
-
[6]
P., Harsono, D., et al.\ 2019, , 631, A64
Bjerkeli, P., Ramsey, J. P., Harsono, D., et al.\ 2019, , 631, A64. doi:10.1051/0004-6361/201935948
-
[7]
P., Harsono, D., et al.\ 2023, , 677, A62
Bjerkeli, P., Ramsey, J. P., Harsono, D., et al.\ 2023, , 677, A62. doi:10.1051/0004-6361/202245195
-
[8]
Boogert, A. C. A., Brewer, K., Brittain, A., et al.\ 2022, , 941, 1, 32. doi:10.3847/1538-4357/ac9b4a
-
[9]
Bouilloud, M., Fray, N., B \'e nilan, Y., et al.\ 2015, , 451, 2145. doi:10.1093/mnras/stv1021
-
[10]
Brunken, N. G. C., Rocha, W. R. M., van Dishoeck, E. F., et al.\ 2024, , 685, A27. doi:10.1051/0004-6361/202348718
-
[11]
J., Gear, W
Chandler, C. J., Gear, W. K., Sandell, G., et al.\ 1990, , 243, 330
1990
-
[12]
Cabedo, V., Maury, A., Girart, J. M., et al.\ 2021, , 653, A166. doi:10.1051/0004-6361/202140754
-
[13]
Chu, L. E. U. & Hodapp, K. W.\ 2021, , 918, 2. doi:10.3847/1538-4357/ac0ae8
-
[14]
Connelley, M. S., Hodapp, K. W., & Fuller, G. A.\ 2009, , 137, 3494. doi:10.1088/0004-6256/137/3/3494
-
[15]
doi:10.5303/JKAS.2025.58.2.209
Contreras Pe \ n a, C., Lee, J.-E., Herczeg, G., et al.\ 2025, Journal of Korean Astronomical Society, 58, 209. doi:10.5303/JKAS.2025.58.2.209
-
[16]
A., Ysard, N., et al.\ 2022, , 666, A153
Dartois, E., Noble, J. A., Ysard, N., et al.\ 2022, , 666, A153. doi:10.1051/0004-6361/202243929
-
[17]
A., Caselli, P., et al.\ 2024, Nature Astronomy, 8, 359
Dartois, E., Noble, J. A., Caselli, P., et al.\ 2024, Nature Astronomy, 8, 359. doi:10.1038/s41550-023-02155-x
-
[18]
Dawes, A., Mason, N. J., & Fraser, H. J.\ 2016, Physical Chemistry Chemical Physics (Incorporating Faraday Transactions), 18, 2, 1245. doi:10.1039/C5CP05299H
-
[19]
Evans, N. J., Yang, Y.-L., Green, J. D., et al.\ 2023, , 943, 90. doi:10.3847/1538-4357/acaa38
-
[20]
Federman, S. A., Megeath, S. T., Rubinstein, A. E., et al.\ 2024, , 966, 41. doi:10.3847/1538-4357/ad2fa0
-
[21]
Federman, S. A., Megeath, S. T., Caratti o Garatti, A., Narang, M., Tyagi, H., Evans, N. J.\,II, Kimmig, C. N., Tychoniec, L., Beuther, H., Stutz, A., Manoj, P., Gutermuth, R., Bourke, T. L., Green, J., Hartmann, L., Klaassen, P., Kuiper, R., Looney, L. W., Nazari, P., Stanke, T., Watson, D. M., Yang, Y.-L., & Zakri, W. 2026, arXiv:2601.09587
arXiv 2026
-
[22]
Frerking, M. A. & Langer, W. D.\ 1982, , 256, 523. doi:10.1086/159928
-
[23]
Frerking, M. A., Langer, W. D., & Wilson, R. W.\ 1987, , 313, 320. doi:10.1086/164970
-
[24]
& Olofsson, G.\ 2007, , 475, 281
G \^a lfalk, M. & Olofsson, G.\ 2007, , 475, 281. doi:10.1051/0004-6361:20077889
-
[25]
Gardner, J. P., Mather, J. C., Abbott, R., et al.\ 2023, , 135, 068001. doi:10.1088/1538-3873/acd1b5
-
[26]
Gerakines, P. A., Materese, C. K., & Hudson, R. L.\ 2025, , 537, 3, 2918. doi:10.1093/mnras/staf192
-
[27]
9, 2022)
Goudfrooij, P, 2022, Doc: JWST-STScI-008116, SM-12, (Feb. 9, 2022)
2022
-
[28]
Goldsmith, P. F., Snell, R. L., Hemeon-Heyer, M., et al.\ 1984, , 286, 599. doi:10.1086/162635
-
[29]
M., Cernicharo, J., et al.\ 2002, , 386, 1074
Gonz \'a lez-Alfonso, E., Wright, C. M., Cernicharo, J., et al.\ 2002, , 386, 1074. doi:10.1051/0004-6361:20020362
- [30]
-
[31]
Le Gouellec, V. J. M., Lew, B. W. P., Greene, T. P., et al.\ 2024, arXiv:2410.11095o
Pith/arXiv arXiv 2024
-
[32]
Green, J. D., Evans, N. J., J rgensen, J. K., et al.\ 2013, , 770, 2, 123. doi:10.1088/0004-637X/770/2/123
-
[33]
P., Kelly, D
Greene, T. P., Kelly, D. M., Stansberry, J., et al.\
-
[34]
Hillenbrand, L. A. & Rodriguez, A. C.\ 2022, Research Notes of the American Astronomical Society, 6, 1, 6. doi:10.3847/2515-5172/ac4807
-
[35]
Hirano, N., Kameya, O., Nakayama, M., et al.\ 1988, , 327, L69. doi:10.1086/185142
-
[36]
Hodapp, K.-W.\ 1984, , 141, 255
1984
-
[37]
Hodapp, K.-W.\ 1987, , 319, 842. doi:10.1086/165502
-
[38]
Hodapp, K.-W., Hora, J. L., Rayner, J. T., et al.\ 1996, , 468, 861. doi:10.1086/177742
-
[39]
Hodapp, K.-W.\ 1998, , 500, L183. doi:10.1086/311412
-
[40]
Hodapp, K. W. & Bressert, E.\ 2009, , 137, 3501. doi:10.1088/0004-6256/137/3/3501
-
[41]
W., Chini, R., Watermann, R., et al.\ 2012, , 744, 1, 56
Hodapp, K. W., Chini, R., Watermann, R., et al.\ 2012, , 744, 1, 56. doi:10.1088/0004-637X/744/1/56
-
[42]
Hodapp, K. W. & Chini, R.\ 2014, , 794, 169. doi:10.1088/0004-637X/794/2/169
-
[43]
Hodapp, K. W. & Chini, R.\ 2018, , 864, 172. doi:10.3847/1538-4357/aad636
-
[44]
Hodapp, K. W., Chu, L. L., Greene, T., et al.\ 2024, , 167, 102. doi:10.3847/1538-3881/ad1b55
-
[45]
Hollenbach, D. & McKee, C. F.\ 1979, , 41, 555. doi:10.1086/190631
doi:10.1086/190631 1979
-
[46]
Hollenbach, D. & McKee, C. F.\ 1980, , 241, L47. doi:10.1086/183358
-
[47]
Hollenbach, D. & McKee, C. F.\ 1989, , 342, 306. doi:10.1086/167595
doi:10.1086/167595 1989
-
[48]
Hubble, E. P.\ 1916, , 44, 190. doi:10.1086/142284
-
[49]
Imai, M., Oya, Y., Sakai, N., et al.\ 2019, , 873, L21. doi:10.3847/2041-8213/ab0c20
-
[50]
J rgensen, J. K., Bourke, T. L., Myers, P. C., et al.\ 2007, , 659, 479. doi:10.1086/512230
doi:10.1086/512230 2007
-
[51]
Kandori, R., Saito, M., Tamura, M., et al.\ 2020, , 891, 55. doi:10.3847/1538-4357/ab6f07
-
[52]
Keene, J., Davidson, J. A., Harper, D. A., et al.\ 1983, , 274, L43. doi:10.1086/184147
-
[53]
C., et al.\ 2024, , 961, 1, 108
Kim, C.-H., Lee, J.-E., Pe \ n a, C. C., et al.\ 2024, , 961, 1, 108. doi:10.3847/1538-4357/ad1400
-
[54]
Lada, C. J., Lada, E. A., Clemens, D. P., et al.\ 1994, , 429, 694. doi:10.1086/174354
doi:10.1086/174354 1994
-
[55]
& Scholz, A.\ 2025, , 540, 1, 52
Lightfoot, J. & Scholz, A.\ 2025, , 540, 1, 52. doi:10.1093/mnras/staf708
-
[56]
Lightfoot, J. F.\ 1989, , 239, 665. doi:10.1093/mnras/239.2.665
-
[57]
Le Gouellec, V. J. M., Maury, A. J., & Hull, C. L. H.\ 2023, , 671, A167. doi:10.1051/0004-6361/202244865
-
[58]
Le Gouellec, V. J. M., Lew, B. W. P., Greene, T. P., et al.\ 2025, , 985, 2, 225. doi:10.3847/1538-4357/adcac4
-
[59]
Maury, A. J., Girart, J. M., Zhang, Q., et al.\ 2018, , 477, 2760. doi:10.1093/mnras/sty574
-
[60]
McClure, M. K., Rocha, W. R. M., Pontoppidan, K. M., et al.\ 2023, Nature Astronomy, 7, 431. doi:10.1038/s41550-022-01875-w
-
[61]
1956, MNRAS, 116, 503
Mestel, L., & Spitzer, L. 1956, MNRAS, 116, 503
1956
-
[62]
Okoda, Y., Oya, Y., Imai, M., et al.\ 2022, , 935, 136. doi:10.3847/1538-4357/ac7ff4
-
[63]
\"O berg, K. I., Boogert, A. C. A., Pontoppidan, K. M., et al.\ 2011, , 740, 2, 109. doi:10.1088/0004-637X/740/2/109
-
[64]
& Olofsson, G.\ 2009, , 498, 455
Olofsson, S. & Olofsson, G.\ 2009, , 498, 455. doi:10.1051/0004-6361/200811574
-
[65]
Pontoppidan, K. M., Sch \"o ier, F. L., van Dishoeck, E. F., et al.\ 2002, , 393, 585. doi:10.1051/0004-6361:20021056
-
[66]
Pontoppidan, K. M., Fraser, H. J., Dartois, E., et al.\ 2003, , 408, 981. doi:10.1051/0004-6361:20031030
-
[67]
Ray, T. P. & Ferreira, J.\ 2021, , 93, 101615. doi:10.1016/j.newar.2021.101615
arXiv 2021
-
[68]
Reipurth, B., Heathcote, S., & Vrba, F.\ 1992, , 256, 225
1992
-
[69]
F., Anglada, G., et al.\ 2002, , 124, 1045
Reipurth, B., Rodr \' guez, L. F., Anglada, G., et al.\ 2002, , 124, 1045. doi:10.1086/341172
-
[70]
2008, in Handbook of Star Forming Regions, Volume II, ed
Reipurth, B. 2008, in Handbook of Star Forming Regions, Volume II, ed. B. Reipurth (San Francisco, CA: ASP), 847
2008
-
[71]
Rieke, M. J., Kelly, D. M., Misselt, K., et al.\ 2023, , 135, 028001. doi:10.1088/1538-3873/acac53
-
[72]
Rocha, W. R. M., Perotti, G., Kristensen, L. E., et al.\ 2021, , 654, A158. doi:10.1051/0004-6361/202039360
-
[73]
Rubinstein, A. E., Evans, N. J., Tyagi, H., et al.\ 2024, , 974, 112. doi:10.3847/1538-4357/ad6b92
-
[74]
Safron, E. J., Fischer, W. J., Megeath, S. T., et al.\ 2015, , 800, 1, L5. doi:10.1088/2041-8205/800/1/L5
-
[75]
Shu, F. H., Adams, F. C., & Lizano, S.\ 1987, , 25, 23. doi:10.1146/annurev.aa.25.090187.000323
arXiv 1987
-
[76]
F., Tychoniec, ., et al.\ 2024, , 688, A29
Slavicinska, K., van Dishoeck, E. F., Tychoniec, ., et al.\ 2024, , 688, A29. doi:10.1051/0004-6361/202449785
-
[77]
Slavi c insk\' a , K., Coone, C., Benz, B., Linnartz, H., Boogert, A. C. A., & Chuang, K.-J. 2025, ACS Earth Space Chem., 9, 2148, doi:10.1021/acsearthspacechem.5c00134
-
[78]
F., Cutri, R
Skrutskie, M. F., Cutri, R. M., Stiening, et al. 2006, , 131, 1163
2006
-
[79]
Stutz, A. M., Rubin, M., Werner, M. W., et al.\ 2008, , 687, 389. doi:10.1086/591789
-
[80]
Tyagi, H., Manoj, P., Narang,
discussion (0)
Sign in with ORCID, Apple, or X to comment. Anyone can read and Pith papers without signing in.