REVIEW 3 major objections 6 minor 103 references
A jet-aware spectral fitting pipeline corrects SDSS's systematic misclassification of blazars and recovers the known BL Lac–FSRQ population split.
Reviewed by Pith at T0; open to challenge. T0 means a machine referee read the full paper against a public rubric. the ladder, T0–T4 →
T0 review · deepseek-v4-flash
2026-08-01 00:34 UTC pith:PC2FJ4FF
load-bearing objection Useful pipeline and catalogue, but the headline redshift improvement is softer than it looks—check the 16 3FHL-disagreeing STAR cases before trusting the η claim. the 3 major comments →
Spectroscopic Analysis of Fermi-detected Blazars using SDSS-V
The pith
A machine-rendered reading of the paper's core claim, the machinery that carries it, and where it could break.
Core claim
The paper's central claim is that a physically motivated, multi-component spectral fitting approach—explicitly including a non-thermal power-law jet component alongside host galaxy and QSO/emission-line templates—can reliably classify and estimate redshifts for Fermi-detected blazars that the standard SDSS pipeline misidentifies as stars, galaxies, or ordinary quasars. Applied to 746 optical counterparts of 4FGL-DR4 gamma-ray sources with SDSS-V spectra, the pipeline yields 707 well-fitted blazar candidates. The model selection recovers the established cosmological separation: BL Lac candidates have median redshift z=0.360 and median gamma-ray luminosity 1.39e45 erg/s, while FSRQ candidates
What carries the argument
The central mechanism is a six-family model selection framework where each observed spectrum is fit with single-component models (Galaxy, QSO, Power-law) and multi-component models (Power-law+Galaxy, Power-law+QSO, Power-law+Line-only). The power-law component represents non-thermal synchrotron jet emission with a curvature parameter, and the multi-component fits are evaluated on a logarithmic redshift grid with a chi-squared likelihood, marginalized over templates, refined locally, and selected via the corrected Akaike Information Criterion (AICc). The fractional contribution of the power-law component to the total optical flux (jet fraction) provides a continuous measure of jet dominance.
Load-bearing premise
The redshift validation assumes that the 3FHL spectroscopic redshifts are reliable reference values for the 111-source subset, and specifically that when the new pipeline disagrees with 3FHL for the 16 SDSS-STAR sources, the 3FHL value is the unreliable one.
What would settle it
A targeted spectroscopic follow-up of the 16 SDSS-STAR sources where the new pipeline disagrees with 3FHL would settle the redshift accuracy question. If the 3FHL redshifts are confirmed for a majority of these, the claimed 10.4% reduction in catastrophic failures would be an overstatement. Alternatively, if the new redshifts are confirmed, the 3FHL compilation for this subset is demonstrably unreliable.
If this is right
- If the pipeline is right, SDSS-V spectra can be used to classify and redshift blazars even when jet emission overwhelms thermal features, enabling population studies without requiring new observations.
- The recovered BL Lac/FSRQ separation in redshift and gamma-ray luminosity confirms the model-based classification is physically meaningful and can be used to update Fermi source classifications, reducing the fraction of uncertain-type blazars.
- The finding that many BL Lac candidates show emission lines with |EW|>5 Angstroms suggests the traditional BL Lac/FSRQ dichotomy is oversimplified; a continuous jet-fraction and equivalent-width description may better represent the blazar population.
- The 10.4% reduction in catastrophic redshift failures over the SDSS pipeline, if general, implies that archival SDSS spectra of gamma-ray sources can yield improved redshifts for a significant fraction of objects.
- The pipeline is directly scalable to the full SDSS-V footprint and future large spectroscopic surveys, offering a foundation for blazar population studies in larger samples.
Where Pith is reading between the lines
- A direct consequence the paper leaves implicit: the misclassification rate among SDSS 'STAR' labels in gamma-ray samples implies that other archival samples selected by optical classification alone may have substantial blazar contamination, and cross-matching with WISE colours could rescue them.
- The continuous jet-fraction description suggests a testable extension: multi-epoch spectroscopy of the hybrid sources (with both emission and absorption) could reveal whether their classification shifts with jet activity, as expected if some are masquerading BL Lacs or transitional objects.
- The paper's redshift validation depends on the 3FHL reference being trustworthy for the 111-source subset; an independent redshift campaign targeting the 16 SDSS-STAR sources where the new pipeline disagrees with 3FHL would directly settle the reliability question.
- The fact that PL+Lines sources have jet fractions interpreted as upper limits suggests that a more complete model including a separate accretion-disk continuum component could break the degeneracy and refine the jet/disk decomposition.
Editorial analysis
A structured set of objections, weighed in public.
Referee Report
Summary. The paper presents a new multi-component spectral fitting pipeline for blazar classification and redshift estimation, applied to 746 optical counterparts of Fermi/4FGL-DR4 sources with SDSS-V spectroscopy. The pipeline fits power-law jet continuum with galaxy, QSO, or emission-line templates, selects among six model families via AICc, and classifies 707 well-fitted sources into BL Lac candidates (PL+Galaxy, 59.4%) and FSRQ candidates (PL+QSO/Lines, 37.6%). The authors report that WISE colours confirm 96.6% of the 88 SDSS stellar misclassifications as extragalactic blazars, that the new redshift estimates reduce catastrophic failures by 10.4% relative to the SDSS pipeline on a 111-source 3FHL validation sample (η=0.387 vs 0.432), and that the traditional |EW|=5 Å boundary is reproduced only at the population level, with a large hybrid population. The paper also derives median redshifts and gamma-ray luminosities for the two classes (z=0.360 vs 1.026; L_gamma=1.39e45 vs 4.23e46 erg/s).
Significance. If the quantitative claims hold, the paper delivers a valuable, publicly applicable tool for blazar spectroscopy in SDSS-V and a large classified sample with independent WISE and 3FHL cross-checks. The pipeline explicitly addresses a real, documented failure mode of SDSS automated classification, and the AICc model-selection framework with externally validated WISE colours is a solid foundation. The population-level EW analysis and the identification of a substantial hybrid population are interesting and could inform future blazar taxonomy. However, the paper's headline redshift-improvement claim rests on an asymmetric catastrophic-failure metric and on dismissing 16 of the 21 SDSS-STAR validation sources as unreliable 3FHL redshifts without independent verification; this is the load-bearing element that needs strengthening.
major comments (3)
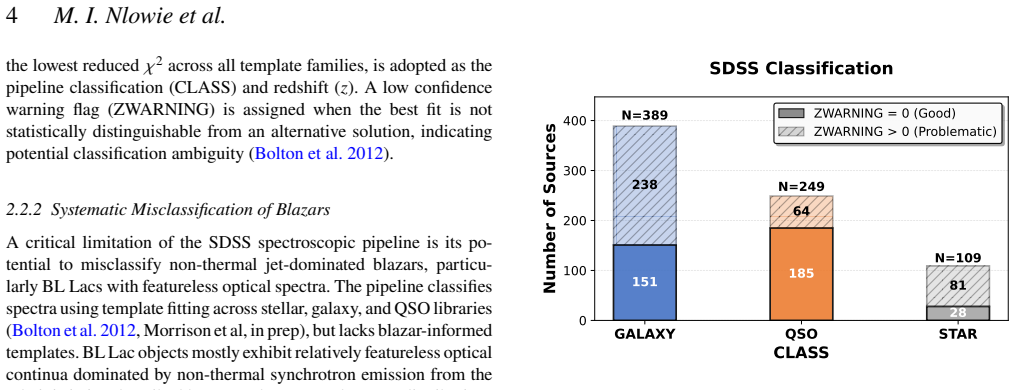
- [§5.2, Eq. (18)–(19)] The claimed 10.4% reduction in catastrophic failures depends on an asymmetric definition. Eq. (19) counts every SDSS CLASS=STAR as a failure regardless of the actual redshift, which is reasonable for an extragalactic sample. However, for the 21 SDSS-STAR sources in the 3FHL validation set, the paper counts only 5 as recovered and assumes the 16 remaining disagreements are due to unreliable 3FHL redshifts. If those 16 are instead counted as catastrophic failures of the new pipeline (as they would be under the paper's own |Δz|/(1+z)>0.15 criterion), η_fit becomes (43+16)/111 ≈ 0.53, which is worse than the SDSS η=0.432. The statement that 'the reliability of the 3FHL reference redshifts for this specific subset cannot be taken for granted' is not a substitute for a provenance check. The abstract and conclusions advertise the improvement; this needs to be re-evaluated with a symmetric metri
- [§5.3 and §3.5] The equivalent-width validation of the |EW|=5 Å boundary is not fully independent of the model selection. The classification into PL+Galaxy (BL Lac candidate) versus PL+QSO/PL+Lines (FSRQ candidate) is made by AICc, which explicitly rewards line-template fits when emission lines improve the fit. It is therefore not surprising that FSRQ candidates show stronger emission lines. The paper acknowledges this circularity only implicitly. The population-level conclusion (BL Lac mean EW 4.47 Å vs FSRQ 22.86 Å) would be more convincing if the EW analysis were performed on an independently defined sample, e.g., sources classified by WISE colours or by 4FGL class, or if the authors demonstrated that the AICc selection does not simply track EW. As written, the EW statistics partly reflect the construction of the classifier.
- [Table A1, Appendix A] The redshift uncertainties reported as ±0.0000 (e.g., z_fit=0.6739±0.0002, or ±0.0000 for some sources) are formal fitting uncertainties from local χ² refinement and do not reflect systematic uncertainty in featureless or weakly featured spectra. For sources where the redshift is anchored only by a diluted host-galaxy template (Section 4.4), the true uncertainty can be much larger. The paper should provide a more robust uncertainty estimate, for example bootstrap or template-variation errors, at least for the PL+Galaxy and PL+Lines families. The current presentation understates the uncertainty and could mislead users of the catalogue.
minor comments (6)
- [§4.2, §6, Table A2] There is an inconsistency in the number of sources failing the χ²_r quality cut: §4.2 says 'the remaining 13 sources' and 'these 14 sources' in consecutive sentences, and Table A2 lists 14. The text should be corrected to 14 consistently.
- [§3.2, Eq. (1)] Typo: 'we adopt a a flexible dual-form power-law' — extra 'a'. Also, the sign convention in Eq. (1) is not clearly explained; please add a sentence defining what positive/negative δ does to the spectral shape in the observer frame.
- [Figure 12 caption] The caption says 'BL Lac candidates (PLonly and PL+Galaxy)' but the text and Figure 7 indicate that only PL+Galaxy and the five pure-PL sources are classified as BL Lac candidates. Clarify whether the five pure-PL sources are included in the WISE plot and in the 405 count.
- [§5.1] The claim that 'none of the 6 SDSS STAR-classified sources where we retain the original classification fall within any of the canonical blazar selection regions' should be verified against the actual WISE errors; a source can lie near the boundary. Please add quantitative confirmation (e.g., distance from the wedge) or soften the statement.
- [§5.2, Fig. 13] The discussion of '12 sources' where z_fit disagrees with z_3FHL but z_SDSS agrees is a bit confusing after the 16 STAR sources are removed. Please clarify the exact counts and provide a table of these 12 sources, especially the 2/12 'genuine catastrophic failures'.
- [Abstract, §5.3] The abstract states '49.5% of individual BL Lac candidates exceed this threshold' — this refers to at least one detected emission line with |EW|>5 Å, but the sentence could be misread as the fraction of all measured lines. Rephrase to '49.5% of BL Lac candidates have at least one detected emission line with |EW|>5 Å'.
Circularity Check
EW 'validation' partly circular; core pipeline and external WISE/3FHL checks remain independent.
specific steps
-
self definitional
[Section 3.5 vs Section 5.3 / Abstract]
"When a combined model is selected, the best-fit label directly informs the physical classification: PL+Galaxy indicates a BL Lac candidate with a detectable host galaxy contribution, while PL+QSO or PL+Line-only indicates an FSRQ candidate with thermal disk or BLR emission coexisting with the jet. ... The equivalent width analysis validates the traditional |EW|=5Å classification boundary at the population level: BL Lac candidates show a mean EW of 4.47±0.15Å ... compared to 22.86±0.86Å for FSRQ candidates."
The classes compared in the EW analysis are defined by AICc selection among model families that differ precisely in whether emission-line templates are included: PL+Galaxy has no emission-line template, while PL+QSO and PL+Line-only include QSO/line templates. A source with strong emission lines will preferentially select PL+Lines or PL+QSO and be labelled an FSRQ candidate; a source without such lines selects PL+Galaxy and is labelled a BL Lac candidate. The claimed EW validation therefore compares two sets constructed using line-strength information, so the population-level mean EW separation (4.47 vs 22.86 Å) is largely a restatement of the template-selection criterion rather than an independent confirmation of the 5 Å boundary. The paper's own overlap statistics (49.5% of BL Lac candid
full rationale
The central derivation is largely self-contained and not circular. The multi-component fitting pipeline is defined externally (SWIRE galaxy templates, QSOGEN line/QSO templates, a dual-form power law, AICc selection) and the resulting classifications are checked against independent data: WISE colours for the 88 SDSS-STAR sources (96.6% fall in the blazar strip) and 3FHL spectroscopic redshifts for 111 sources. These external benchmarks give the redshift and classification claims genuine content. The 10.4% redshift-improvement comparison uses a deliberately asymmetric definition of catastrophic failure (SDSS CLASS=STAR automatically counts as a failure, while the 16 SDSS-STAR sources where z_fit disagrees with 3FHL are argued to have unreliable 3FHL references); this is a statistical fairness concern, not a circular derivation, because the pipeline's redshifts are not fitted to 3FHL values. The one genuinely circular element is the equivalent-width 'validation' of the |EW|=5 Å boundary: the BL Lac/FSRQ candidate labels are assigned by whether an emission-line template wins the AICc selection, so measuring stronger emission lines in the FSRQ candidate set and calling it an independent validation of the EW boundary is partly restating the classification input. The overlap statistics and the presence of PL+Galaxy sources with strong emission lines show this circularity is partial, not complete. No load-bearing self-citation chain or imported uniqueness theorem is present. Overall score 4 reflects one partially circular supporting claim while the core pipeline and external validations remain independent.
Axiom & Free-Parameter Ledger
free parameters (5)
- per-source power-law normalisation A =
varies per source; not tabulated
- per-source power-law slope alpha =
e.g. alpha ~ 0.52, -1.30 in Table A1
- per-source curvature delta =
e.g. delta ~ 1.20, -1.20 in Table A1
- per-source template scalings s_gal/s_QSO/s_line =
varies per source
- equal inter-family priors W_f=1/6 =
1/6 each
axioms (10)
- domain assumption The SDSS idlspec2d pipeline has no non-thermal jet template and therefore misclassifies featureless blazar continua as stars, galaxies, or quasars.
- domain assumption The WISE blazar wedge (Massaro 2011; D'Abrusco 2012) and Salvato 2018 region identify blazar/AGN infrared colours.
- domain assumption QSOGEN synthetic spectra adequately represent FSRQ/QSO continuum, line, and reddening properties.
- domain assumption SWIRE elliptical templates Ell2/Ell5/Ell13 represent host galaxy light in blazars.
- domain assumption 3FHL spectroscopic redshifts are a valid external reference for the 111-source validation subset.
- ad hoc to paper Equal prior over the six model families is appropriate.
- standard math IGM transmission follows Madau 1995 with the stated optical depth prescription.
- standard math Flat Lambda-CDM cosmology with H0=70 km/s/Mpc and Omega_m=0.3 is used for luminosity distances.
- domain assumption The traditional |EW|=5 Angstrom boundary is the classification criterion to validate.
- domain assumption In PL+Lines fits the power-law absorbs smooth accretion-disk continuum, making f_jet an upper limit.
read the original abstract
The automated spectroscopic pipeline of the Sloan Digital Sky Survey (SDSS) systematically assigns Galactic star, galaxy, or typical quasar classifications to jet-dominated blazars, owing to the absence of a non-thermal jet continuum component in its template library. In this study, we present a new, physically motivated, multi-component spectral fitting pipeline that we apply to 746 optical counterparts of Fermi/4FGL-DR4 $\gamma$-ray sources in the SDSS-V Data Release 20 spectroscopic database, yielding 707 well-fitted blazar candidates dominated by Power-law+Galaxy (59.4%), Power-law+Lines (22.6%), and Power-law+QSO (15.0%) model families. Independent WISE infrared (IR) photometry confirms that 96.6% of the 88 sources originally misclassified as Galactic stars by SDSS fall within the canonical blazar region, with 90.9% reclassified as BL Lacertae object (BL Lac) candidates, demonstrating the success of our new pipeline. The new classification scheme naturally recovers the known cosmological separation between BL Lac and Flat Spectrum Radio Quasar (FSRQ) candidates and a separation of approximately one order of magnitude in median $\gamma$-ray luminosity. We compare our redshift estimates to a validation sample of 111 sources in the Third Fermi-LAT Catalogue of High-Energy Sources (3FHL), finding a 10.4% reduction in catastrophic failures ($\eta = 0.387$ vs 0.432) over the SDSS pipeline. The equivalent width analysis validates the traditional |EW| = 5 Ang classification boundary at the population level (BL Lac: 4.47 $\pm$ 0.15 Ang; FSRQ: 22.86 $\pm$ 0.86 Ang), although 49.5% of individual BL Lac candidates exceed this threshold and 51.4% show simultaneous emission and absorption features. This hybrid population challenges the traditional binary blazar classification and points towards a more physically continuous description of blazar properties.
Figures


Reference graph
Works this paper leans on
-
[1]
Abazajian K. N., et al., 2009, @doi [ ] 10.1088/0067-0049/182/2/543 , https://ui.adsabs.harvard.edu/abs/2009ApJS..182..543A 182, 543
-
[2]
Abdo A., et al., 2010, The Astrophysical Journal, 716, 30
2010
-
[3]
Abdollahi S., et al., 2020, The Astrophysical Journal Supplement Series, 247, 33
2020
-
[4]
Abdollahi S., et al., 2022, The Astrophysical Journal Supplement Series, 260, 53
2022
-
[5]
Abdurro'uf et al., 2022, @doi [ ] 10.3847/1538-4365/ac4414 , https://ui.adsabs.harvard.edu/abs/2022ApJS..259...35A 259, 35
-
[6]
Ackermann M., et al., 2015, The Astrophysical Journal, 810, 14
2015
-
[7]
Adamane Pallathadka G., et al., 2025, preprint, pp arXiv--2507
2025
-
[8]
Aghanim N., et al., 2020, Astronomy & Astrophysics, 641, A6
2020
-
[9]
Ahumada R., et al., 2020, The Astrophysical Journal Supplement Series, 249, 3
2020
-
[10]
Ajello M., et al., 2012, The Astrophysical Journal, 751, 108
2012
-
[11]
Ajello M., et al., 2014, The Astrophysical Journal, 780, 73
2014
-
[12]
Ajello M., et al., 2017, The Astrophysical Journal Supplement Series, 232, 18
2017
-
[13]
Ajello M., et al., 2020, The Astrophysical Journal, 892, 105
2020
-
[14]
Ajello M., et al., 2022, The Astrophysical Journal Supplement Series, 263, 24
2022
-
[15]
Akiyama M., Ueda Y., Ohta K., Takahashi T., Yamada T., 2003, @doi [ ] 10.1086/376441 , https://ui.adsabs.harvard.edu/abs/2003ApJS..148..275A 148, 275
-
[16]
Alam S., et al., 2015, @doi [ ] 10.1088/0067-0049/219/1/12 , https://ui.adsabs.harvard.edu/abs/2015ApJS..219...12A 219, 12
-
[17]
Almeida A., et al., 2023, The Astrophysical Journal Supplement Series, 267, 44
2023
-
[18]
\'A lvarez Crespo N., et al., 2016, Astrophysics and Space Science, 361, 316
2016
-
[19]
B., et al., 2009, The Astrophysical Journal, 697, 1071
Atwood W. B., et al., 2009, The Astrophysical Journal, 697, 1071
2009
-
[20]
Atwood W., et al., 2013, @doi [arXiv e-prints] 10.48550/arXiv.1303.3514 , https://ui.adsabs.harvard.edu/abs/2013arXiv1303.3514A p. arXiv:1303.3514
-
[21]
Ballet J., Burnett T., Digel S., Lott B., 2020, arXiv preprint arXiv:2005.11208
Pith/arXiv arXiv 2020
-
[22]
Ballet J., Bruel P., Burnett T., Lott B., Collaboration F.-L., et al., 2023, arXiv preprint arXiv:2307.12546
Pith/arXiv arXiv 2023
-
[23]
Beckmann V., Engels D., Bade N., Wucknitz O., 2003, @doi [ ] 10.1051/0004-6361:20030184 , https://ui.adsabs.harvard.edu/abs/2003A&A...401..927B 401, 927
-
[24]
Blandford R., Meier D., Readhead A., 2019, Annual Review of Astronomy and Astrophysics, 57, 467
2019
-
[25]
S., et al., 2012, The Astronomical Journal, 144, 144
Bolton A. S., et al., 2012, The Astronomical Journal, 144, 144
2012
-
[26]
Bowen I., Vaughan Jr A., 1973, Applied Optics, 12, 1430
1973
-
[27]
287, Dec
Burstein D., Faber S., Gaskell C., Krumm N., 1984, Astrophysical Journal, Part 1 (ISSN 0004-637X), vol. 287, Dec. 15, 1984, p. 586-609. Research supported by the University of California., 287, 586
1984
-
[28]
Caccianiga A., et al., 2015, Monthly Notices of the Royal Astronomical Society, 451, 1795
2015
-
[29]
Carnall A. C., 2017, SpectRes: A Fast Spectral Resampling Tool in Python ( @eprint arXiv 1705.05165 ), https://arxiv.org/abs/1705.05165
Pith/arXiv arXiv 2017
-
[30]
Cerruti M., 2025, @doi [ ] 10.1051/0004-6361/202452289 , https://ui.adsabs.harvard.edu/abs/2025A&A...698A.101C 698, A101
-
[31]
E., et al., 2014, The Astrophysical Journal, 782, 90
Cluver M. E., et al., 2014, The Astrophysical Journal, 782, 90
2014
-
[32]
J., Cotton W., Greisen E., Yin Q., Perley R
Condon J. J., Cotton W., Greisen E., Yin Q., Perley R. A., Taylor G., Broderick J., 1998, The Astronomical Journal, 115, 1693
1998
-
[33]
A., Tosti G., 2012, The Astrophysical Journal, 748, 68
D'Abrusco R., Massaro F., Ajello M., Grindlay J., Smith H. A., Tosti G., 2012, The Astrophysical Journal, 748, 68
2012
-
[34]
Dey A., et al., 2019, The Astronomical Journal, 157, 168
2019
-
[35]
Feller W., 1948, The annals of mathematical statistics, 19, 177
1948
-
[36]
Flesch E. W., 2015, @doi [ ] 10.1017/pasa.2015.10 , https://ui.adsabs.harvard.edu/abs/2015PASA...32...10F 32, e010
-
[37]
a., Maraschi L., Celotti A., Comastri A., Ghisellini G., 1998, Monthly Notices of the Royal Astronomical Society, 299, 433
Fossati G. a., Maraschi L., Celotti A., Comastri A., Ghisellini G., 1998, Monthly Notices of the Royal Astronomical Society, 299, 433
1998
-
[38]
Gardner E., Done C., 2018, Monthly Notices of the Royal Astronomical Society, 473, 2639
2018
-
[39]
M., Benker A., 2007, arXiv preprint arXiv:0711.1013
Gaskell C. M., Benker A., 2007, arXiv preprint arXiv:0711.1013
Pith/arXiv arXiv 2007
-
[40]
M., Goosmann R
Gaskell C. M., Goosmann R. W., Antonucci R. R., Whysong D. H., 2004, The Astrophysical Journal, 616, 147
2004
-
[41]
Ghisellini G., Tavecchio F., 2009, Monthly Notices of the Royal Astronomical Society, 397, 985
2009
-
[42]
Ghisellini G., Nardini M., Ghirlanda G., Celotti A., 2009, Monthly Notices of the Royal Astronomical Society, 393, 253
2009
-
[43]
Ghisellini G., Tavecchio F., Foschini L., Ghirlanda G., 2011, Monthly Notices of the Royal Astronomical Society, 414, 2674
2011
-
[44]
Ghisellini G., Righi C., Costamante L., Tavecchio F., 2017, Monthly Notices of the Royal Astronomical Society, 469, 255
2017
-
[45]
Goldoni P., et al., 2021, Astronomy & Astrophysics, 650, A106
2021
-
[46]
E., et al., 2006, The Astronomical Journal, 131, 2332
Gunn J. E., et al., 2006, The Astronomical Journal, 131, 2332
2006
-
[47]
E., et al., 2008, The Astrophysical Journal Supplement Series, 175, 97
Healey S. E., et al., 2008, The Astrophysical Journal Supplement Series, 175, 97
2008
-
[48]
M., Best P
Heckman T. M., Best P. N., 2014, Annual Review of Astronomy and Astrophysics, 52, 589
2014
-
[49]
M., Tsai C.-L., 1989, Biometrika, 76, 297
Hurvich C. M., Tsai C.-L., 1989, Biometrika, 76, 297
1989
-
[50]
Ilbert O., et al., 2006, Astronomy & Astrophysics, 457, 841
2006
-
[51]
Kang S.-J., Li E., Ou W., Zhu K., Fan J.-H., Wu Q., Yin Y., 2019, The Astrophysical Journal, 887, 134
2019
-
[52]
Kasai E., et al., 2023, Monthly Notices of the Royal Astronomical Society, 518, 2675
2023
-
[53]
Kellermann K., Sramek R., Schmidt M., Shaffer D., Green R., 1989, Astronomical Journal (ISSN 0004-6256), vol. 98, Oct. 1989, p. 1195-1207., 98, 1195
1989
-
[54]
A., et al., 2026, The Astronomical Journal, 171, 52
Kollmeier J. A., et al., 2026, The Astronomical Journal, 171, 52
2026
-
[55]
Madau P., 1995, Astrophysical Journal, Part 1 (ISSN 0004-637X), vol. 441, no. 1, p. 18-27, 441, 18
1995
-
[56]
Maraschi L., Ghisellini G., Celotti A., 1992, Astrophysical Journal, Part 2-Letters (ISSN 0004-637X), vol. 397, no. 1, p. L5-L9., 397, L5
1992
-
[57]
Marcha M., Browne I., Impey C., Smith P., 1996, Monthly Notices of the Royal Astronomical Society, 281, 425
1996
-
[58]
Massaro E., Giommi P., Leto C., Marchegiani P., Maselli A., Perri M., Piranomonte S., Sclavi S., 2009, Astronomy & Astrophysics, 495, 691
2009
-
[59]
A., 2011, The Astrophysical Journal Letters, 740, L48
Massaro F., D'Abrusco R., Ajello M., Grindlay J., Smith H. A., 2011, The Astrophysical Journal Letters, 740, L48
2011
-
[60]
Massaro F., Masetti N., D'Abrusco R., Paggi A., Funk S., 2014, The Astronomical Journal, 148, 66
2014
-
[61]
Massaro F., et al., 2015a, The Astrophysical Journal Supplement Series, 217, 2
-
[62]
Massaro E., Maselli A., Leto C., Marchegiani P., Perri M., Giommi P., Piranomonte S., 2015b, @doi [ ] 10.1007/s10509-015-2254-2 , https://ui.adsabs.harvard.edu/abs/2015Ap&SS.357...75M 357, 75
-
[63]
Mauch T., Murphy T., Buttery H., Curran J., Hunstead R., Piestrzynski B., Robertson J., Sadler E., 2003, Monthly Notices of the Royal Astronomical Society, 342, 1117
2003
-
[64]
T., Fossati G., Georganopoulos M., Lister M
Meyer E. T., Fossati G., Georganopoulos M., Lister M. L., 2011, @doi [ ] 10.1088/0004-637X/740/2/98 , https://ui.adsabs.harvard.edu/abs/2011ApJ...740...98M 740, 98
-
[65]
Narayan R., Yi I., 1994, arXiv preprint astro-ph/9411059
Pith/arXiv arXiv 1994
-
[66]
Neumann K. D., Falcone A. D., DiKerby S., Deppe S., Ferrara E. C., Kennea J. A., Cenko B., Grove E., 2025, arXiv preprint arXiv:2512.10023
arXiv 2025
-
[67]
B., Rawlik M., Ingargiola A., Nelson A., 2016, Astrophysics Source Code Library, pp ascl--1606
Newville M., Stensitzki T., Allen D. B., Rawlik M., Ingargiola A., Nelson A., 2016, Astrophysics Source Code Library, pp ascl--1606
2016
-
[68]
L., et al., 2012, The Astrophysical Journal Supplement Series, 199, 31
Nolan P. L., et al., 2012, The Astrophysical Journal Supplement Series, 199, 31
2012
-
[69]
Oke J., Gunn J., 1974, Astrophysical Journal, vol. 189, p. L5, 189, L5
1974
-
[70]
Padovani P., et al., 2017, The Astronomy and Astrophysics Review, 25, 1
2017
-
[71]
Padovani P., Oikonomou F., Petropoulou M., Giommi P., Resconi E., 2019, Monthly Notices of the Royal Astronomical Society: Letters, 484, L104
2019
-
[72]
Pe \ n a-Herazo H. A., et al., 2021, @doi [ ] 10.3847/1538-3881/abe41d , https://ui.adsabs.harvard.edu/abs/2021AJ....161..196P 161, 196
-
[73]
Pita S., et al., 2014, Astronomy & Astrophysics, 565, A12
2014
-
[74]
M., Anderson S
Plotkin R. M., Anderson S. F., Hall P. B., Margon B., Voges W., Schneider D. P., Stinson G., York D. G., 2008, The Astronomical Journal, 135, 2453
2008
-
[75]
M., et al., 2010, The Astronomical Journal, 139, 390
Plotkin R. M., et al., 2010, The Astronomical Journal, 139, 390
2010
-
[76]
M., Anderson S
Plotkin R. M., Anderson S. F., Brandt W., Markoff S., Shemmer O., Wu J., 2012, The Astrophysical Journal Letters, 745, L27
2012
-
[77]
Polletta M., et al., 2007, The Astrophysical Journal, 663, 81
2007
-
[78]
Prugniel P., Soubiran C., 2001, Astronomy & Astrophysics, 369, 1048
2001
-
[79]
M., 2025, The Astronomy and Astrophysics Review, 33, 8
Raiteri C. M., 2025, The Astronomy and Astrophysics Review, 33, 8
2025
-
[80]
Ruiz A., Corral A., Mountrichas G., Georgantopoulos I., 2018, Astronomy & Astrophysics, 618, A52
2018
discussion (0)
Sign in with ORCID, Apple, or X to comment. Anyone can read and Pith papers without signing in.