REVIEW 4 major objections 7 minor 1 cited by
Analysis of Plant Nutrient Deficiencies Using Multi-Spectral Imaging and Optimized Segmentation Model
T0 review · 4 major / 7 minor · reviewed 2026-08-06 · deepseek-v4-flash
Pith's one-line read A YOLOv5 segmentation model modified for nine-channel multispectral input and a transformer-based attention head outperforms the RGB-only baseline on controlled nutrient-deficiency symptoms in Marchantia polymorpha, raising mean Dice from…
desk verdict The dataset is the real contribution; the 12% gain is plausible but the evaluation confounds multispectral input with a transformer head and a single 16-image validation split. read the letter →
The pith
A machine-rendered reading of the paper's core claim, the machinery that carries it, and where it could break.
The reading
What carries the argument
The load-bearing mechanism is the modified input stage plus the transformer head. The first convolutional layer of YOLOv5's Focus module is widened from 3 to 9 channels, with pretrained RGB weights replicated or averaged to initialize the extra bands, and a custom dataloader keeps the spectral band order fixed. The head is a vision-transformer encoder with positional embedding, multi-head self-attention of the form $\mathrm{Attention}(Q,K,V)=\mathrm{softmax}(QK^\top/\sqrt{d_k})V$, layer normalization, residual connections, and a two-layer MLP with GELU activation; it replaces the convolutional prediction head to capture global spatial-spectral dependencies for small, low-contrast symptoms.
What would settle it
Run the same training pipeline with four variants: RGB plus the original convolutional head, RGB plus the transformer head, nine-channel plus the convolutional head, and nine-channel plus the transformer head, over several random splits. If the nine-channel variants do not consistently beat their RGB counterparts at a fixed head architecture, the paper's central claim that multispectral input drives the improvement would be refuted.
Extended reading notes
Core claim
The paper's central discovery is that replacing the RGB input and convolutional head of a standard YOLOv5 segmentation model with nine-band multispectral input and a transformer encoder head using multi-head self-attention yields consistent segmentation gains across all four leaf symptom classes. The quantitative claim is a mean IoU increase from 0.50 to 0.61 and a mean Dice increase from 0.55 to 0.67 against the RGB-only baseline, with chlorosis IoU rising from 0.25 to 0.35 and pigment accumulation IoU rising from 0.51 to 0.61. The authors attribute these gains to richer spectral information in near-infrared bands and to the transformer head's global context modeling for small, scattered lesions.
Load-bearing premise
The evaluation rests on a single random 90/10 split of 160 images with no repeated runs or error bars, and the proposed model changes both the input channels and the head relative to the baseline, so the reported improvement cannot be cleanly attributed to multispectral imaging alone.
Editorial extensions
If this is right
- Nutrient-deficiency screening can move from RGB to affordable multispectral sensors without sacrificing the speed of a YOLO-style pipeline.
- The per-class results suggest that chlorosis and pigment accumulation, the hardest classes in this dataset, are where multispectral input adds the most value.
- A fixed spectral band order in the dataloader becomes a required preprocessing step; inconsistent band ordering would degrade the learned spectral-spatial representations.
- The time-series data already collected across eight imaging days could support early-detection models, since visible symptoms appear as early as Day 5 for iron deficiency.
Reading between the lines
- Because the paper compares a two-change model against an RGB baseline, the reported gains are not yet decomposed: a four-way ablation varying input channels and head type would reveal how much of the 0.12 Dice gain comes from spectral input alone.
- The strong per-class numbers on pigment accumulation hint that specific bands related to anthocyanin absorption carry most of the signal, so an automatic band-selection module could shrink the input without losing accuracy.
- The same nine-channel imaging protocol could transfer to other plant species with similar flat-thallus morphology, but thicker or hairy leaves would likely require retraining and possibly additional bands.
- Since images were collected over 17 days, a temporal model could predict nutrient deficiency before visible symptoms by exploiting early reflectance changes; the current work does not use this temporal axis.
Editorial analysis
A structured set of objections, weighed in public.
Referee Report
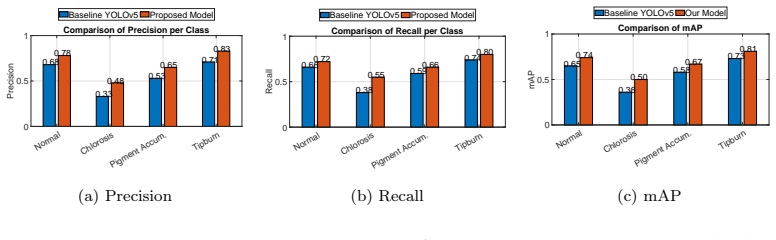
Summary. The manuscript presents a deep learning framework for segmenting nutrient-deficiency symptoms in Marchantia polymorpha from nine-channel multispectral images. The proposed model extends YOLOv5 with a transformer-based attention head and a customized dataloader for 9-channel input. Experiments on a newly constructed dataset of 160 annotated images under five nutrient conditions report consistent improvements over a YOLOv5 baseline trained on three narrow bands (470, 530, 620 nm): mean IoU rises from 0.50 to 0.61 and mean Dice from 0.55 to 0.67 (Table 3), with additional gains in precision, recall, and mAP (Fig. 6). The authors attribute these gains to the combination of multispectral input and attention-based head, and conclude that this approach improves detection of subtle symptoms such as chlorosis and pigment accumulation.
Significance. The paper's main contributions are the construction of a controlled multispectral plant-stress dataset with pixel-level annotations for four symptom classes, and a practical adaptation of YOLOv5 for multispectral instance segmentation. If the reported gains are reproducible and properly attributed, the work would provide a useful benchmark and a biologically grounded annotation protocol for phenotyping applications. The strengths include the systematic nutrient-deficiency experiment across five treatments, the careful annotation procedure, and the transparent reporting of training hyperparameters. However, the central attribution claim is currently under-supported: the comparison changes both input channels and head architecture simultaneously, and the evaluation rests on a single small split without statistical validation. These issues are addressable within the manuscript's scope, so the paper may become acceptable after a major revision.
major comments (4)
- [§4.1, Table 3] The comparison between baseline YOLOv5 and the proposed model changes two factors at once: the input channels (3 vs 9) and the detection/segmentation head (convolutional vs transformer). The reported gains therefore cannot be attributed to multispectral information per se, as stated in the abstract and conclusion. To support the central claim, the authors should add ablations that isolate each modification, e.g., the proposed model with 9 channels and the original convolutional head, and the baseline with a transformer head and 3 channels, so that the contributions of spectral input and architectural change are separated.
- [§4.1, dataset split] The evaluation rests on a single random 90/10 split of 160 images, leaving only 16 validation images. No error bars, repeated seeds, or cross-validation are reported, and no statistical test supports the word 'significantly' used in the abstract and Section 4.2. Moreover, because the dataset comprises image series from the same plates at eight time points (Days 0–17), a random image-level split may place near-duplicate images from the same treatment and time point in both training and validation, artificially inflating apparent performance. The authors should perform multiple splits, ideally stratified by biological replicate or time point, and report means with standard deviations across seeds along with a significance test (e.g., paired t-test or Wilcoxon signed-rank).
- [§4.1, RGB baseline] The baseline input is described as 'RGB images (3 channels): extracted from three selected bands (i.e., 470 nm, 530 nm, 620 nm)'. These narrow bands are not equivalent to standard RGB camera output, which uses broadband sensors with different spectral sensitivities and color rendering. Since the abstract and introduction frame the contribution as multispectral versus conventional RGB, the authors should either use actual RGB images from the camera mentioned in Section 4.1 or explicitly discuss how the narrow-band baseline may disadvantage the comparison, particularly for chlorosis detection, where the yellow-green transition is spectrally subtle.
- [§4.1, Fig. 4] The dataset is heavily class-imbalanced: Fig. 4 shows that Normal tissue dominates both the instance count and the aggregate pixel area, while Tipburn and Pigment Accumulation are sparse. The paper acknowledges this imbalance but does not address how it affects the reliability of the per-class metrics on a validation set of only 16 images, where the class distribution may vary substantially between random splits. The authors should report per-class metrics with confidence intervals and consider class-balanced sampling or stratified splits to ensure stable evaluation.
minor comments (7)
- [§1] There is a typo in the first paragraph of the introduction: 'Normalized Difference Vegetation Iindex' should be 'Normalized Difference Vegetation Index'.
- [§4.1, Eq. (3)] In the sentence introducing Eq. (3), there is a typo: 'The second one is thew Dice score' should read 'The second one is the Dice score'.
- [Abstract, §1, Table 3] The claimed improvements are numerically inconsistent across sections: the abstract states 'about 12%' for both Dice and IoU, the introduction claims 'up to 17% higher mAP and 12% higher average Dice', while Table 3 shows a mean IoU increase from 0.50 to 0.61 (11 percentage points) and mean Dice from 0.55 to 0.67 (12 percentage points). Please clarify whether these are absolute percentage-point changes or relative changes, and use consistent wording.
- [Fig. 7] The caption of Fig. 7 says 'Training profile of the proposed model on the multi-spectral test dataset', but the text describes training curves; 'test dataset' should probably be 'validation dataset' or 'training set'.
- [Fig. 7f] In the paragraph after Fig. 7, the text states 'The mAP curve stabilizes above 0.70', but the y-axis of Fig. 7f has a maximum of 0.6, which appears inconsistent. Please check the axis scaling or the statement.
- [§1, Contributions] The first contribution states that the dataset 'spans five nutrient regimes (control, -Fe, -N, -P, -Ca) and includes visual and spectral symptoms across three plant species'. Later, the experiments describe only Marchantia polymorpha. Please correct the species count or provide details on the other species.
- [§1, Novelty claim] The paper claims 'to the best of our knowledge, this is the first work on multi-spectral image analysis using deep learning detection model for plant healthy diagnosis'. Given existing deep-learning studies on hyperspectral and multispectral plant disease detection (e.g., Nagasubramanian et al. 2019, and many of the papers cited in §2.3), this claim is likely too strong; please temper it.
Circularity Check
No circularity: the reported improvements are empirical measurements on a held-out validation split, with no fitted parameter renamed as a prediction and no load-bearing self-citation.
full rationale
The paper's central claim is an empirical performance comparison between a baseline YOLOv5 model and a proposed YOLOv5 variant with a transformer head and nine-channel multispectral input. All supporting evidence consists of validation-set metrics (IoU, Dice, precision, recall, mAP) reported in Table 3 and Figure 6. These numbers are direct measurements on a held-out 10% split, not the output of an analytic derivation, a fitted constant, or a self-citation chain. There is no equation in which the predicted quantity is defined in terms of the fitted input, no parameter fitted to a subset and then reported as a prediction on a closely related quantity, and no 'uniqueness theorem' imported from prior work by the same authors. The manuscript does cite prior work for YOLOv5 and transformer architectures, but those citations are standard external technical references, not load-bearing self-justifications. The main weakness is experimental: the baseline differs from the proposed model in both input channels and head architecture, and the single 90/10 split of 160 images provides no error bars or repeated-seed ablations. This makes the attribution of the gain to multispectral input unsupported, but that is a threat to internal validity, not circular reasoning. No passage in the manuscript asserts a circular step or an omitted proof; the only limitation statements appear in the Future Work section and concern dataset expansion and domain adaptation, which do not affect the circularity analysis. Therefore the appropriate circularity score is 0.
Assumptions & free parameters
free parameters (3)
- Random 90/10 data split =
seed not specified
- Training hyperparameters =
lr=1e-4, momentum=0.99, batch size=4, epochs=500, input=640x640
- Transformer head architecture details =
not specified
assumptions (4)
- domain assumption Manual polygon annotations are accurate and consistent across the four classes.
- domain assumption The nine multispectral bands are spatially aligned and spectrally consistent across all images.
- domain assumption The controlled nutrient treatments produce the expected visual symptom classes used as ground truth.
- domain assumption RGB-only YOLOv5 is a sufficient baseline for the stated comparison.
Cite this review
Pith. "Pith review of Analysis of Plant Nutrient Deficiencies Using Multi-Spectral Imaging and Optimized Segmentation Model." pith.science (2026). https://pith.science/paper/PDYMNSE4
@misc{pith2026250714013,
  author       = {Pith},
  title        = {Pith review of: Analysis of Plant Nutrient Deficiencies Using Multi-Spectral Imaging and Optimized Segmentation Model},
  year         = {2026},
  howpublished = {\url{https://pith.science/paper/PDYMNSE4}},
  note         = {Machine review of arXiv:2507.14013}
}
read the original abstract
Accurate detection of nutrient deficiency in plant leaves is essential for precision agriculture, enabling early intervention in fertilization, disease, and stress management. This study presents a deep learning framework for leaf anomaly segmentation using multispectral imaging and an enhanced YOLOv5 model with a transformer-based attention head. The model is tailored for processing nine-channel multispectral input and uses self-attention mechanisms to better capture subtle, spatially-distributed symptoms. The plants in the experiments were grown under controlled nutrient stress conditions for evaluation. We carry out extensive experiments to benchmark the proposed model against the baseline YOLOv5. Extensive experiments show that the proposed model significantly outperforms the baseline YOLOv5, with an average Dice score and IoU (Intersection over Union) improvement of about 12%. In particular, this model is effective in detecting challenging symptoms like chlorosis and pigment accumulation. These results highlight the promise of combining multi-spectral imaging with spectral-spatial feature learning for advancing plant phenotyping and precision agriculture.
Figures


Figures from the paper (5 more)




Forward citations
Cited by 1 Pith paper
-
Hallucination Behavior in Multimodal LLMs Across Agricultural Image Interpretation and Generation Tasks
Multimodal LLMs show 25-37% error in zero-shot agricultural image interpretation and up to 91% biologically inconsistent outputs in text-to-image generation tasks.
Reference graph
Works this paper leans on
-
[1]
T. Talaviya, A. Kumar, T. Patel, A. Tiwari, G. Pandya, Implementa- tion of artificial intelligence in agriculture for optimization of irrigation and application of pesticides and herbicides, Artificial Intelligence in Agriculture 16 (2024). doi:10.1016/j.aiia.2024.100212
arXiv 2024
-
[2]
M. Z. Allah, O. Vergara, J. Araus, A. Tarekegne, C. Magorokosho, P. Z. Tejada, A. Hornero, A. H. Albà, B. Das, P. Craufurd, M. Olsen, B. M. Prasanna, J. Cairns, Unmanned aerial platform based multi spectral imaging for field phenotyping of maize, Plant Methods (2015)
work page 2015
-
[3]
A. Papachristoforou, M. Prodomou, D. Hadjimitsis, M. Christoforou, Detecting and distinguishing between apicultural plants using uav mul- tispectral imaging, PeerJ (2023)
work page 2023
-
[4]
C. I. Fernández, L. Brigitte, W. Jinfei, H. Ata, W. Keri, Detecting infected cucumber plants with close-range multispectral imagery, MDPI (2021)
work page 2021
-
[5]
V. Charles, F. Chatziavgerinos, A. Al Suwaidi, H. M. Hibbert, James, B. Gytis, M. Smith, H. Yin, S. Rolfe, B. Grieve, Multispectral imaging for presymptomatic analysis of light leaf spot in oilseed rape, BMC (2019)
work page 2019
-
[6]
R. Xu, C. Li, A. H. Paterson, Multispectral imaging and unmanned aerial systems for cotton plant phenotyping, PLoS ONE (2019)
work page 2019
-
[7]
L. Boris, C.-S. Klaudija, Z. Marek, V. Dominik, J. Tomislav, S. Toni, Classification of high-throughput phenotyping data for differentiation 32 among nutrient deficiency in commonbean, Frontiers in Plant Science (2022)
work page 2022
-
[8]
P. Yao, M. D. Mary, T. José, H. J.Steen, L. James, H. Linda, G. Bruce, Y. Hujun, Early detection of plant virus infection using multispectral imaging and spatial–spectral machine learning, Nature (2022)
work page 2022
Show all 33 references
-
[9]
X. Wei, B. Li, Y. Zhang, H. Liu, Machine learning-based spectral and spatial analysis of hyper- and multi-spectral leaf imaging for forest dis- ease detection, Artificial Intelligence in Agriculture 7 (2023) 45–56. doi:10.1016/j.aiia.2023.100185
2023
-
[10]
doi:10.1016/j.aiia.2024.100197
L.Zhang, Y.Chen, R.Wang, W.Li, Artificialintelligenceinplantbreed- ing: Advances in deep learning-based crop phenotyping, Artificial Intel- ligence in Agriculture 8 (2024) 110–123. doi:10.1016/j.aiia.2024.100197
2024
-
[11]
Jocher, A
G. Jocher, A. Stoken, J. Borovec, A. Chaurasia, L. Changyu, A. Hogan, J. Hajek, L. Diaconu, Y. Kwon, Y. Defretin, et al., ultralytics/yolov5: v5. 0-yolov5-p6 1280 models, aws, supervise. ly and youtube integra- tions, Zenodo (2021)
2021
-
[12]
Vaswani, N
A. Vaswani, N. Shazeer, N. Parmar, J. Uszkoreit, L. Jones, A. N. Gomez, Ł. Kaiser, I. Polosukhin, Attention is all you need, Advances in neural information processing systems 30 (2017)
2017
-
[13]
C. Li, D. He, X. Li, Advances in hyperspectral imaging for plant pheno- typing: A review, Frontiers in Plant Science 13 (2022) 820628. 33
2022
-
[14]
Wolff, T
F. Wolff, T. H.M. Kolari, M. Villoslada, P. Tahvanainen, P. A.P. Zam- boni, T. Kumpula, Rgb vs. multispectral imagery: Mapping aapa mire plant communities with uavs, Ecological Indicators (2023)
2023
-
[15]
Nguyen, J
H. Nguyen, J. Zhang, Y. Lyu, Z. Sun, Q. Zhou, Monitoring maize nitro- genstatususinguav-basedmultispectralimageryandvegetationindices, Remote Sensing 14 (1) (2022) 105
2022
-
[16]
S. Ren, K. He, R. Girshick, J. Sun, Faster r-cnn: Towards real-time object detection with region proposal networks, IEEE Transactions on Pattern Analysis and Machine Intelligence 39 (6) (2017) 1137–1149
2017
-
[17]
Redmon, A
J. Redmon, A. Farhadi, Yolov3: An incremental improvement, arXiv preprint arXiv:1804.02767 (2018)
2018 arXiv
-
[18]
W. Liu, D. Anguelov, D. Erhan, C. Szegedy, S. Reed, C.-Y. Fu, A. C. Berg, Ssd: Single shot multibox detector, in: European Conference on Computer Vision (ECCV), Springer, 2016, pp. 21–37
2016
-
[19]
Bochkovskiy, C.-Y
A. Bochkovskiy, C.-Y. Wang, H.-Y. M. Liao, Yolov4: Optimal speed and accuracy of object detection, arXiv preprint arXiv:2004.10934 (2020)
2020 arXiv
-
[20]
Jocher, et al., Yolov5 by ultralytics, GitHub repository (2021)
G. Jocher, et al., Yolov5 by ultralytics, GitHub repository (2021)
2021
-
[21]
K. He, G. Gkioxari, P. Dollár, R. Girshick, Mask r-cnn, in: International Conference on Computer Vision (ICCV), 2017, pp. 2961–2969
2017
-
[22]
L.-C. Chen, Y. Zhu, G. Papandreou, F. Schroff, H. Adam, Encoder- decoder with atrous separable convolution for semantic image segmen- 34 tation, in: European Conference on Computer Vision (ECCV), 2018, pp. 801–818
2018
-
[23]
Kirillov, E
A. Kirillov, E. Mintun, N. Ravi, H. Mao, L. Rolland, D. Gustafson, T. Xiao, S. Whitehead, A. Berg, W.-Y. Lo, et al., Segment anything, arXiv preprint arXiv:2304.02643 (2023)
2023 arXiv
-
[24]
S. Woo, J. Park, J.-Y. Lee, I. S. Kweon, Cbam: Convolutional block at- tention module, in: European Conference on Computer Vision (ECCV), 2018, pp. 3–19
2018
-
[25]
J.Hu, L.Shen, G.Sun, Squeeze-and-excitationnetworks, IEEETransac- tions on Pattern Analysis and Machine Intelligence 42 (8) (2020) 2011– 2023
2020
-
[26]
N.Carion, F.Massa, G.Synnaeve, N.Usunier, A.Kirillov, S.Zagoruyko, End-to-end object detection with transformers, in: European Confer- ence on Computer Vision (ECCV), Springer, 2020, pp. 213–229
2020
-
[27]
X. Zhu, W. Su, L. Lu, B. Li, X. Wang, J. Dai, Deformable detr: De- formable transformers for end-to-end object detection, in: International Conference on Learning Representations (ICLR), 2021
2021
-
[28]
Nataprawira, Y
J. Nataprawira, Y. Gu, I. Goncharenko, S. Kamijo, Pedestrian detection using multispectral images and a deep neural network, Sensors 21 (7) (2021) 2536
2021
-
[29]
L. Ma, H. Zhang, J. Xu, Y. Li, X. Guo, Hyperspectral object detection via spectral-spatial attention mechanism and faster r-cnn, IEEE Trans- actions on Geoscience and Remote Sensing 59 (12) (2021) 10477–10490. 35
2021
-
[30]
R. Zhao, S. Li, Y. Zhang, W. Wang, Pest detection from multispectral images using attention-guided convolutional neural network, Computers and Electronics in Agriculture 196 (2022) 106878
2022
-
[31]
T. Li, J. Wang, L. Zhang, F. Gao, Adaptive spectral-spatial feature fusion for hyperspectral plant disease detection, IEEE Transactions on Instrumentation and Measurement (2023). doi:10.1109/TIM.2023.3250212
2023
-
[32]
Zhang, K
Z. Zhang, K. Chen, X. Huang, Hyperspectral image classification via transformer with spectral attention, ISPRS Journal of Photogrammetry and Remote Sensing 203 (2023) 103–114
2023
-
[33]
Wada, Labelme: Image polygonal annotation with python, in: https://github.com/wkentaro/labelme, GPL-3, 2025, p
K. Wada, Labelme: Image polygonal annotation with python, in: https://github.com/wkentaro/labelme, GPL-3, 2025, p. 10.5281/zen- odo.5711226. 36
2025 doi
Reviewed August 6, 2026 · model on record in the stance chip above.
Discussion (0). Sign in to comment.