REVIEW 5 major objections 5 minor 62 references
An agentic system that encodes O-RAN telemetry as a causal graph and feeds it to a frozen LLM as a soft token claims to place the true root cause in the top three candidates in 89% of incidents.
Reviewed by Pith at T0; open to challenge. T0 means a machine referee read the full paper against a public rubric. the ladder, T0–T4 →
T0 review · deepseek-v4-flash
2026-08-01 01:21 UTC pith:PHAEHR2B
load-bearing objection Worth a serious referee: the testbed work is real, but the headline causal-ranking claim is not supported as stated, the numbers and runtime are inconsistent, and the soft prompt may be trained on a different LLM than the agent uses. the 5 major comments →
C-RE-ACT: Causal RE-ACTing Agent for O-RAN Forensic Triage
The pith
A machine-rendered reading of the paper's core claim, the machinery that carries it, and where it could break.
Core claim
The central discovery is that an O-RAN performance-degradation incident can be distilled into a weighted causal graph over interface metrics, with two special root nodes—a failure indicator F and a UE-population counter U—masked so that no edges point into them. The graph is learned with the Structural Agnostic Model, a GAN-based causal-discovery algorithm, over a contextual window that spans both baseline and incident regimes. Candidate root causes are the direct children of F, ranked by a confounder-penalized distance that down-weights metrics simultaneously close to F and to U, so routine UE attachment dynamics do not masquerade as incident causes. This graph is then compressed by a Graph
What carries the argument
The load-bearing object is the SAM-learned weighted DAG over telemetry, augmented with the masked exogenous roots F and U. The ranking tool computes, for each direct child v_j of F, a causality distance s(v_j) = d_F(v_j) [1 + λ(1 − d_U(v_j))], where d_F and d_U are edge distances from F and U respectively; this confounder penalty suppresses metrics whose variation tracks routine UE fluctuations. A Graph Isomorphism Network with Laplacian positional encodings reads the graph and produces a 128-dimensional embedding, projected to a 4096-dimensional soft token that is prepended to the query for a frozen LLM; two readout strategies (mean pooling for graph-level questions, the F-node embedding fo
Load-bearing premise
The central claim collapses if the edges SAM learns from the incident signal F to the metrics are not causal directions but mere statistical association with the alarm window, in which case the ranking measures goodness-of-fit to the labeled incidents rather than true root-cause structure.
What would settle it
Run the causal-discovery tool on windows where the same KPI deviation is produced by a known benign event (e.g., a scheduled bulk UE attach) with the F-node flagged exactly as in an attack; if the top-ranked 'root cause' matches the one found under true adversarial delay, the causal ranking is tracking the deviation pattern, not the incident's source.
If this is right
- If the causal ranking is reliable, NOC analysts can begin investigations from a short list of suspect metrics and interfaces, cutting the triage phase of mean-time-to-recovery.
- Soft-prompting a frozen LLM with a graph token means graph-structure reasoning can be added without fine-tuning the language model, so the approach can be repurposed to new causal graphs with only small encoder updates.
- The confounder penalty offers a general template for suppressing known operational non-stationarity (such as UE attach/detach) when diagnosing network incidents from time-series data.
- The system's confusion patterns—particularly the SCTP-induced loss/delay ambiguity on E2 and F1-C—identify where metric spaces are incomplete and where ticket routing decisions are least trustworthy.
- Because the final report is grounded in graph edges and observed windows, operators can audit each reasoning step, which is a step toward accountable AI in security operations.
Where Pith is reading between the lines
- Editorial: The masked root nodes impose the direction 'incident → metrics' by construction; if the learned E_{F,v} weights mostly capture which metrics co-vary with the alarm window, the top-3 accuracy is a supervised feature-selection result rather than evidence of causal diagnosis. A test against a reverse-directed model (where the indicator is a child of degraded metrics) would expose this.
- Editorial: A natural falsification experiment is to induce identical KPI signatures via a benign event (e.g., a scripted bulk UE attach) while flagging the F-node exactly as in an attack; if the ranking tool still names the same 'root cause' metrics, the causal graph is not separating cause from symptom.
- Editorial: The soft-token encoder is trained on only 840 custom graph–question–answer triplets plus generic pretraining; its 0.72 accuracy likely reflects a narrow query grammar. Probing with a broader, adversarial question distribution would test whether the token encodes genuine topology or shortcuts over the fixed templates.
- Editorial: The confusion matrices show a systematic leak of control-plane incidents toward the F1-U user-plane interface. Rather than treating this as error, a triage system could exploit it as a structural prior: any degradation eventually surfaces on the user plane, so F1-U involvement may indicate downstream propagation rather than the origin.
Editorial analysis
A structured set of objections, weighed in public.
Referee Report
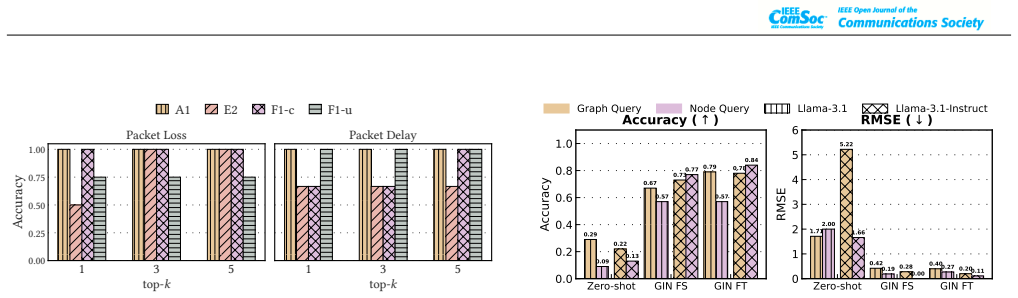
Summary. The paper proposes C-RE-ACT, an agentic triage system for O-RAN performance-degradation incidents. It constructs a weighted directed acyclic graph over telemetry using the Structural Agnostic Model (SAM), with an artificial binary F-node representing the incident and a U-node representing UE-count dynamics; candidate root causes are the direct children of F, ranked by a confounder-penalized distance to F (Eqs. 6–10). The graph is encoded as a continuous soft token by a Graph Isomorphism Network aligned with a frozen LLM, and a ReAct agent uses two tools (ranked_list_causes and query_graph) to produce a structured triage report. The system is evaluated on a physical O-RAN testbed across 140 packet-loss and delay experiments on the A1, E2, F1-C, and F1-U interfaces. The reported headline results are 89% top-3 root-cause accuracy, graph-reasoning accuracy improvement from 0.22 to 0.72, and anomaly classification accuracies of 83% (delay) and 84% (packet loss).
Significance. If the causal-ranking and graph-reasoning claims were established, C-RE-ACT would be a genuinely useful contribution to O-RAN incident triage: the problem is real, the physical testbed with replayed commercial traffic is a strength, the controlled 140-experiment evaluation is substantial, and the design choice to keep the LLM frozen and train only the GIN/projection is computationally attractive. The O-CIQA dataset and the GraphQA-pretraining strategy are also useful. However, the central causal claim is currently not established: the construction of the F-node and the absence of any correlation or feature-selection baseline leave the 89% top-3 figure open to the much weaker interpretation that the system is ranking metrics by association with the incident alarm window. The paper also contains internal inconsistencies in the headline numbers, the reported runtime, and the LLM used for the agent versus the LLM used for graph soft-prompting. These issues are load-bearing and require substantive revision.
major comments (5)
- [Sec. V.C.2, Eqs. (6)–(10)] The core causal claim is not supported as stated. The F-node is a binary indicator of the incident window and its incoming edges are masked (a_i,F = a_i,U = 0), forcing F and U to be exogenous roots. Under this construction, any metric whose distribution shifts during the incident window will tend to receive an edge from F because that reduces the reconstruction loss in Eq. (4). The candidate set V_F in Eq. (6) is therefore, by construction, the set of metrics that co-vary with the alarm window, and the ranking in Eq. (10) is a ranking by association strength with the incident label, penalized by association with U. No baseline is reported—e.g., ranking by Pearson correlation with F, or by z-scored mean shift during the window. Such a baseline is essential to show that SAM's edge weights add causal information beyond association. Without it, the 89% top-3 accuracy is equally consistent w
- [Abstract vs. Conclusion and Fig. 7] The headline empirical numbers are inconsistent. The Abstract reports 89% top-3 root-cause accuracy, 83% delay-anomaly accuracy, and 84% packet-loss accuracy; the Conclusion reports 91% top-3 and 98% delay-related classification accuracy. Figure 7 shows per-interface type accuracy of 0.70–0.93 and location accuracy of 0.89–0.94, which does not obviously support the 98% figure. These discrepancies are not explained (e.g., by filtering on interface or strength) and undermine the reproducibility of the central evaluation claims.
- [Sec. V.A vs. Sec. VI.E, Fig. 11] The runtime claim contradicts the stated operational budget. Section V.A states that the triage-stage latency budget is 'typically tens of seconds to a few minutes.' Section VI.E reports a median end-to-end runtime of 678 s (approximately 11 minutes) and says this is 'well within' the budget. Eleven minutes is not within 'tens of seconds to a few minutes,' and Fig. 11 shows a long upper tail beyond 1000 s. The paper needs to state the actual budget, report the full runtime distribution (including tail and per-phase breakdown), and either revise the budget or explain why the median is acceptable.
- [Sec. V.D vs. Sec. VI.A] There is a model mismatch between the graph-prompting design and the end-to-end deployment. Section V.D and Appendix E specify that the graph soft token is aligned with a frozen Llama-3.1-8B-Instruct model, and Fig. 6 evaluates Tool #2 only with Llama-3.1 models. Section VI.A, however, states that C-RE-ACT's agentic system is deployed 'using Gemma 4 31B.' The paper does not explain how a soft token trained against Llama's embedding space is compatible with Gemma's embedding space, nor does it clarify which LLM produced the end-to-end report quality and classification results. This is not a cosmetic inconsistency: the central mechanism of Tool #2 may not be operational in the evaluated agent.
- [Sec. V.D.2 / Sec. VI.C] The O-CIQA dataset used to fine-tune the GIN soft-prompt encoder is generated from the same 35 unique causal graphs produced by the same testbed deployment used in the evaluation. The paper does not describe a train/validation/test split over graphs, only 'training and validation dataset splits' (Appendix E). If the same graph structures appear in both training and evaluation, the 0.72 accuracy and near-zero RMSE in Fig. 6 may reflect memorization of the specific O-CIQA graphs rather than generalization to unseen causal topologies. The authors should report graph-disjoint splits and ideally evaluate on held-out deployment graphs.
minor comments (5)
- [Throughout] Cross-references use shorthand like 'Sec. B' and 'Sec. C' that is ambiguous (e.g., Sec. III.B vs. Sec. V.C). Please use numbered section references consistently.
- [Table 1] The rightmost column is labeled 'Anomaly Score' but the values appear to be the causality distances s(v) from Eq. (10). Rename the column for consistency with the text.
- [Sec. VI.E] The claim that 'A1 policy-guidance traffic is correct relative to a ground-truth A1 interface traffic' is unclear; please rephrase to state what the BLEU mismatch actually reflects.
- [Footnote in Sec. VI.A.2] The trace provenance is hidden 'due to double-blind review policy.' This is understandable, but please provide a citation or a non-sensitive description of the dataset so readers can judge the realism of the baseline traffic.
- [Fig. 6] The zero-shot text baseline values in Fig. 6 (0.29, 0.09, 0.22, 0.13) are not all consistent with the Abstract's single '0.22' figure. State clearly which query type or averaging produces the 0.22 number.
Circularity Check
Causal root-cause ranking reduces to association with the incident indicator: forcing F as an exogenous root makes SAM's E_{F,v} a goodness-of-fit to the alarm window, so the 89% top-3 'causal' accuracy is a supervised feature-selection result.
specific steps
-
fitted input called prediction
[Sec. V.C.1–V.C.3, Eq. (4), Eq. (6), Eq. (8); evaluation in Sec. VI.B]
"Nodes F and U act as exogenous drivers of the system rather than consequences of it. We enforce this by masking the columns of A corresponding to F and U throughout training, fixing a_i,F = a_i,U = 0 for all i ... V_F = {v_j ∈ V : E_{F,v_j} > 0} ... d_F(v_j) = δ(F, v_j) = 1 − E_{F,v_j}. ... The y-axis reports the percentage of incidents in which the ground-truth root-cause metric appears within the tool's Top-1(k=1), Top-3, or Top-5 candidates."
F is the incident indicator itself—a binary step function over the flagged window. Eq. (4) fits each metric from candidate parents, and with F's own incoming edges masked to zero, F can only enter as a parent of other metrics. The learned weight E_{F,v} therefore measures how well the incident step function reconstructs metric v in the same contextual window, i.e., how strongly v co-varies with the alarm. Eq. (6) then defines the root-cause candidate set as the direct children of F, and Eq. (8) ranks them by 1−E_{F,v}; the ranking is by goodness-of-fit to the incident label, not by causal structure. The ground-truth root-cause metric is, by experimental design, the directly impaired KPI that deviates during the same window, so top-3 accuracy on the same 140 incidents is an association/fit
full rationale
The paper's derivation chain is not built on a self-citation loop: SAM, GraphToken, GraphQA, and Llama are external references, and no uniqueness theorem is imported from the authors' prior work. The central problem is inside Tool #1. The 'causal graph' is learned with F, the incident alarm step function, forced to be an exogenous root, so every learned F→v edge encodes 'v deviates when the alarm is on.' The paper's own Eq. (6) and Eq. (8) turn that fitted association into the ranked root-cause list, and the top-3 accuracy is then measured on the same incident windows used to fit the graph. Thus the flagship 89%/91% causal-localization claim reduces to a goodness-of-fit evaluation of a supervised feature selector; a simple correlation-with-F baseline could likely reproduce it. This is partial circularity (score 6) rather than full circularity (score 8-10) because the ranking is not literally identical to the ground-truth label—it is a fitted edge weight renamed as causal evidence, and the rest of the agentic pipeline (LLM soft prompting, report generation) has independent evaluation content. Separately, the GIN soft-prompting accuracy (0.72) is reported without an explicit held-out graph split: O-CIQA is built from the same 35 deployment graphs used in the evaluation, so the improvement over the zero-shot text baseline may be partly in-sample; this is a reproducibility concern, not a derivation-circle step.
Axiom & Free-Parameter Ledger
free parameters (4)
- Confounder penalty λ =
not stated (tuned on validation)
- SAM hyperparameters (λ_S, λ_F, lr, dlr, nh, dnh, hlayers, dhlayers, dagstart, dagpenalization_increase) =
λ_S=5.159, λ_F=0.046, lr=0.0185, dlr=0.0037, nh=20, dnh=200, hlayers=2, dhlayers=1, dagstart=0.417, dagpen=0.041 (Table
- 2σ onset threshold =
2 standard deviations
- Max ReAct steps K =
40
axioms (7)
- domain assumption SAM's gate matrix A, obtained by GAN optimization on min-max normalized time series, identifies true causal parents.
- ad hoc to paper F-node and U-node are exogenous roots (columns of A masked to zero).
- ad hoc to paper Direct children of F are the candidate root causes.
- ad hoc to paper The scoring function s(v) with λ-tuned penalty is a valid causal proximity measure.
- domain assumption A single soft token projected from the GIN can carry graph structure to a frozen LLM's embedding space.
- domain assumption The O-CIQA ground-truth answers are correct and representative.
- domain assumption The testbed-injected impairments replicate real performance-degradation attacks.
invented entities (2)
-
F-Node
no independent evidence
-
UEs Node
no independent evidence
read the original abstract
The shift to O-RAN architectures marks a turning point in cellular security, where increased openness and modularity directly translate into a broader attack surface. Among the security threats cataloged by the O-RAN Alliance Working Group 11, performance-degradation attacks constitute the largest class. These attacks induce packet losses and latency spikes that are hard to distinguish from operational events such as misconfigurations, transient congestion, or software regressions. Consequently, upon an adverse incident detection, support engineers must rapidly determine whether to route the corresponding incident ticket to network maintenance or escalate it to security operations. This triage phase represents a critical human-in-the-loop bottleneck in the incident response lifecycle. To address this vulnerability, we introduce C-RE-ACT (Causal RE-ACTing agent), an automated agentic triage framework designed to generate actionable incident reports. C-RE-ACT starts constructing a Weighted Directed Acyclic Graph (WDAG) over O-RAN metrics using the Structural Agnostic Model (SAM). The resulting causal topology is encoded into a continuous soft token via a Graph Isomorphism Network (GIN) aligned with the language space of the Large Language Model (LLM) powering a ReAct agent. We evaluate C-RE-ACT on a physical, O-RAN-compliant testbed across 140 distinct performance-degradation experiments. Empirical results demonstrate the causal ranking isolates the correct root cause within the top three candidates in 89% of instances. Furthermore, graph soft-prompting improves LLM accuracy on causal-topology queries from 0.22 (text-only baseline) to 0.72. The autonomous agent achieves anomaly classification accuracies of 83% for delay anomalies and 84% for packet-loss anomalies.
Figures




Reference graph
Works this paper leans on
-
[1]
Fujitsu, KDDI successfully turns on the world’s first 5G standalone open RAN site powered by vRAN in Japan,
Fujitsu, “Fujitsu, KDDI successfully turns on the world’s first 5G standalone open RAN site powered by vRAN in Japan,” News Release, 2022. [Online]. Available: https://www.fujitsu.com/global/about/resources/news/press- releases/2022/0218-01.html
2022
-
[2]
NTT DOCOMO offers open RAN product set to other telcos,
NTT DOCOMO, “NTT DOCOMO offers open RAN product set to other telcos,” Fierce Network, News Release, 2023. [Online]. Available: https://www.fierce-network.com/tech/ntt-docomo- offers-open-ran-product-set-other-telcos
2023
-
[3]
AT&T to accelerate open and interoperable radio access networks (RAN) in the United States through new collaboration with Ericsson,
AT&T, “AT&T to accelerate open and interoperable radio access networks (RAN) in the United States through new collaboration with Ericsson,” News Release, 2023. [Online]. Available: https://about.att.com/story/2023/commercial- scale-open-radio-access-network.html
2023
-
[4]
Major European operators sign open RAN MoU,
GSMA, “Major European operators sign open RAN MoU,” News Release, 2021. [Online]. Avail- able: https://www.gsma.com/futurenetworks/digest/major-european- operators-sign-open-ran-mou/
2021
-
[5]
Amarisoft powered Orange 5G at Olympics in best open RAN example yet,
Light Reading, “Amarisoft powered Orange 5G at Olympics in best open RAN example yet,” Light Reading, 2024. [Online]. Available: https://www.lightreading.com/open-ran/amarisoft-powered- orange-5g-at-olympics-in-best-open-ran-example-yet 14 VOLUME ,
2024
-
[6]
O-ran control, user and synchronization plane specification 20.0,
O-RAN Alliance, “O-ran control, user and synchronization plane specification 20.0,” O-RAN Alliance, Technical Specification O- RAN.WG4.TS.CUS.0-R005-v20.00, 2026
2026
-
[7]
O-ran nr c-plane profile 17.0,
O-RAN Alliance, “O-ran nr c-plane profile 17.0,” O-RAN Alliance, Technical Specification O-RAN.WG5.TS.C.1-R005-v17.00, 2026
2026
-
[8]
5greasoner: A property-directed security and privacy analysis frame- work for 5g cellular network protocol,
S. R. Hussain, M. Echeverria, I. Karim, O. Chowdhury, and E. Bertino, “5greasoner: A property-directed security and privacy analysis frame- work for 5g cellular network protocol,” inProceedings of the 2019 ACM SIGSAC Conference on Computer and Communications Security, 2019, pp. 669–684
2019
-
[9]
The cost of securing o-ran,
J. Groen, B. Kim, and K. Chowdhury, “The cost of securing o-ran,” in ICC 2023-IEEE International Conference on Communications. IEEE, 2023, pp. 5444–5449
2023
-
[10]
Securing o-ran open interfaces,
J. Groen, S. D’Oro, U. Demir, L. Bonati, D. Villa, M. Polese, T. Melodia, and K. Chowdhury, “Securing o-ran open interfaces,”IEEE Transactions on Mobile Computing, vol. 23, no. 12, pp. 11 265–11 277, 2024
2024
-
[11]
On the criticality of integrity protection in 5g fronthaul networks,
J. Xing, S. Yoo, X. Foukas, D. Kim, and M. K. Reiter, “On the criticality of integrity protection in 5g fronthaul networks,” in33rd USENIX Security Symposium (USENIX Security 24), 2024, pp. 4463– 4479
2024
-
[12]
5g- muffler: Covert dos attacks over open fronthaul interface of o-ran 5g network,
W. Lin, Z. Li, B. Chen, J. Liu, R.-G. Cheng, and F. Zhang, “5g- muffler: Covert dos attacks over open fronthaul interface of o-ran 5g network,” inIEEE INFOCOM 2025-IEEE Conference on Computer Communications. IEEE, 2025, pp. 1–10
2025
-
[13]
Det-ran: Data-driven cross-layer real-time attack detection in 5g open rans,
A. Scalingi, S. D’Oro, F. Restuccia, T. Melodia, and D. Giustiniano, “Det-ran: Data-driven cross-layer real-time attack detection in 5g open rans,” inIEEE INFOCOM 2024-IEEE Conference on Computer Communications. IEEE, 2024, pp. 41–50
2024
-
[14]
5g- spector: An o-ran compliant layer-3 cellular attack detection service
H. Wen, P. A. Porras, V . Yegneswaran, A. Gehani, and Z. Lin, “5g- spector: An o-ran compliant layer-3 cellular attack detection service.” inNDSS, 2024
2024
-
[15]
Nuberu: Reliable ran virtualization in shared platforms,
G. Garcia-Aviles, A. Garcia-Saavedra, M. Gramaglia, X. Costa-Perez, P. Serrano, and A. Banchs, “Nuberu: Reliable ran virtualization in shared platforms,” inProceedings of the 27th Annual International Conference on Mobile Computing and Networking, 2021, pp. 749– 761
2021
-
[16]
Enabling resilience in virtualized rans with atlas,
J. Xing, J. Gong, X. Foukas, A. Kalia, D. Kim, and M. Kotaru, “Enabling resilience in virtualized rans with atlas,” inProceedings of the 29th Annual International Conference on Mobile Computing and Networking, 2023, pp. 1–15
2023
-
[17]
Security threat modeling and risk assessment 8.0,
O-RAN Alliance, “Security threat modeling and risk assessment 8.0,” O-RAN Alliance, Technical Report O-RAN.WG11.TR.Threat- Modeling-R005-v08.00, 2026, work Group 11 (Security). Available at https://www.o-ran.org/specifications
2026
-
[18]
Attacking O-RAN inter- faces: Threat modeling, analysis and practical experimentation,
P. Baguer, G. M. Yilma, E. Municio, G. Garcia-Aviles, A. Garcia- Saavedra, M. Liebsch, and X. Costa-P ´erez, “Attacking O-RAN inter- faces: Threat modeling, analysis and practical experimentation,”IEEE Open J. Commun. Soc., 2024
2024
-
[19]
Security testing the o-ran near-real time ric & a1 interface,
K. Thimmaraju, A. Shaik, S. Fl ¨uck, P. J. F. Mora, C. Werling, and J.-P. Seifert, “Security testing the o-ran near-real time ric & a1 interface,” inProceedings of the 17th ACM Conference on Security and Privacy in Wireless and Mobile Networks, 2024, pp. 277–287
2024
-
[20]
Automating diagnosis of cellular radio access network problems,
A. P. Iyer, L. E. Li, and I. Stoica, “Automating diagnosis of cellular radio access network problems,” inProceedings of the 23rd annual international conference on mobile computing and networking, 2017, pp. 79–87
2017
-
[21]
Robust procedural learning for anomaly detection and observability in 5g ran,
T. Sundqvist, M. Bhuyan, and E. Elmroth, “Robust procedural learning for anomaly detection and observability in 5g ran,”IEEE Transactions on Network and Service Management, vol. 21, no. 2, pp. 1432–1445, 2023
2023
-
[22]
Interpretable unsupervised anomaly detection for ran cell trace analysis,
A. Chawla, P. Jacob, S. Feghhi, D. Rughwani, S. van der Meer, and S. Fallon, “Interpretable unsupervised anomaly detection for ran cell trace analysis,” in2020 16th International Conference on Network and Service Management (CNSM). IEEE, 2020, pp. 1–5
2020
-
[23]
Spotlight: Accurate, explainable and efficient anomaly detection for open ran,
C. Sun, U. Pawar, M. Khoja, X. Foukas, M. K. Marina, and B. Radunovic, “Spotlight: Accurate, explainable and efficient anomaly detection for open ran,” inProceedings of the 30th Annual Interna- tional Conference on Mobile Computing and Networking, 2024, pp. 923–937
2024
-
[24]
Structural agnostic modeling: Adversarial learning of causal graphs,
D. Kalainathan, O. Goudet, I. Guyon, D. Lopez-Paz, and M. Sebag, “Structural agnostic modeling: Adversarial learning of causal graphs,” Journal of Machine Learning Research, vol. 23, no. 219, pp. 1–62, 2022
2022
-
[25]
Let your graph do the talking: Encoding structured data for LLMs,
B. Perozzi, B. Fatemi, D. Zelle, A. Tsitsulin, M. Kazemi, R. Al-Rfou, and J. Halcrow, “Let your graph do the talking: Encoding structured data for LLMs,”arXiv preprint arXiv:2402.05862, 2024
Pith/arXiv arXiv 2024
-
[26]
Talk like a graph: Encoding graphs for large language models,
B. Fatemi, J. Halcrow, and B. Perozzi, “Talk like a graph: Encoding graphs for large language models,”arXiv preprint arXiv:2310.04560, 2023
Pith/arXiv arXiv 2023
-
[27]
NR C-plane profile 17.0,
O-RAN Alliance, “NR C-plane profile 17.0,” O-RAN Alliance, Technical Specification O-RAN.WG5.TS.C.1-R005-v17.00, 2026, work Group 5 (Open F1/W1/E1/X2/Xn Interface). Available at https://www.o-ran.org/specifications
2026
-
[28]
O-ran E2 general aspects and principles (e2gap) 8.0,
O-RAN Alliance, “O-ran E2 general aspects and principles (e2gap) 8.0,” O-RAN Alliance, Technical Specification O- RAN.WG3.TS.E2GAP-R004-v08.00, 2025, work Group 3 (Near- Real-Time RIC and E2 Interface). Available at https://www.o- ran.org/specifications
2025
-
[29]
A1 interface: General aspects and princi- ples (A1GAP) 5.03,
O-RAN Alliance, “A1 interface: General aspects and princi- ples (A1GAP) 5.03,” O-RAN Alliance, Technical Specification O- RAN.WG2.TS.A1GAP-R005-v05.03, 2026, work Group 2 (Non- Real-Time RIC and A1 Interface). Available at https://www.o- ran.org/specifications
2026
-
[30]
Computer Security Incident Handling Guide,
P. Cichonski, T. Millar, T. Grance, and K. Scarfone, “Computer Security Incident Handling Guide,” National Institute of Standards and Technology, Gaithersburg, MD, NIST Special Publication (SP) 800-61 Rev. 2, 2012
2012
-
[31]
Mitigating the latency-accuracy trade-off in mobile data analytics systems,
A. Padmanabha Iyer, L. Erran Li, M. Chowdhury, and I. Stoica, “Mitigating the latency-accuracy trade-off in mobile data analytics systems,” inProceedings of the 24th annual international conference on mobile computing and networking, 2018, pp. 513–528
2018
-
[32]
Adapting foundation models for operator data analytics,
M. Kotaru, “Adapting foundation models for operator data analytics,” inProceedings of the 22nd ACM Workshop on Hot Topics in Networks, 2023, pp. 172–179
2023
-
[33]
FiGHT: 5G Hierarchy of Global Adversary Threats,
MITRE Corporation, “FiGHT: 5G Hierarchy of Global Adversary Threats,” 2026, accessed: April 18, 2026. [Online]. Available: https://fight.mitre.org/
2026
-
[34]
Flow-of-action: Sop enhanced llm-based multi- agent system for root cause analysis,
C. Pei, Z. Wang, F. Liu, Z. Li, Y . Liu, X. He, R. Kang, T. Zhang, J. Chen, J. Liet al., “Flow-of-action: Sop enhanced llm-based multi- agent system for root cause analysis,” inCompanion Proceedings of the ACM on Web Conference 2025, 2025, pp. 422–431
2025
-
[35]
Large language models can provide accurate and interpretable incident triage,
Z. Wang, J. Li, M. Ma, Z. Li, Y . Kang, C. Zhang, C. Bansal, M. Chintalapati, S. Rajmohan, Q. Linet al., “Large language models can provide accurate and interpretable incident triage,” in2024 IEEE 35th International Symposium on Software Reliability Engineering (ISSRE). IEEE, 2024, pp. 523–534
2024
-
[36]
Lost in the middle: How language models use long contexts,
N. F. Liu, K. Lin, J. Hewitt, A. Paranjape, M. Bevilacqua, F. Petroni, and P. Liang, “Lost in the middle: How language models use long contexts,”Trans. ACL, vol. 12, pp. 157–173, 2024
2024
-
[37]
Chain-of-thought prompting elicits reasoning in large language models,
J. Wei, X. Wang, D. Schuurmans, M. Bosma, F. Xia, E. Chi, Q. V . Le, D. Zhouet al., “Chain-of-thought prompting elicits reasoning in large language models,”Advances in neural information processing systems, vol. 35, pp. 24 824–24 837, 2022
2022
-
[38]
Meta prompting for ai systems,
Y . Zhang, Y . Yuan, and A. C.-C. Yao, “Meta prompting for ai systems,” arXiv preprint arXiv:2311.11482, 2023
arXiv 2023
-
[39]
Large language models can deliver accurate and interpretable time series anomaly detection,
J. Liu, C. Zhang, J. Qian, M. Ma, S. Qin, C. Bansal, Q. Lin, S. Rajmohan, and D. Zhang, “Large language models can deliver accurate and interpretable time series anomaly detection,” no. arXiv:2405.15370, May 2024, arXiv:2405.15370 [cs]. [Online]. Available: http://arxiv.org/abs/2405.15370
Pith/arXiv arXiv 2024
-
[40]
Netllm: Adapting large language models for networking,
D. Wu, X. Wang, Y . Qiao, Z. Wang, J. Jiang, S. Cui, and F. Wang, “Netllm: Adapting large language models for networking,” inProceedings of the ACM SIGCOMM 2024 Conference. Sydney NSW Australia: ACM, Aug. 2024, p. 661–678. [Online]. Available: https://dl.acm.org/doi/10.1145/3651890.3672268
arXiv 2024
-
[41]
ReAct: Synergizing reasoning and acting in language models,
S. Yao, J. Zhao, D. Yu, N. Du, I. Shafran, K. Narasimhan, and Y . Cao, “ReAct: Synergizing reasoning and acting in language models,” in Proc. ICLR, 2023
2023
-
[42]
(2024) Langgraph
LangChain. (2024) Langgraph. [Online]. Available: https://www.langchain.com/langgraph
2024
-
[43]
Spirtes, C
P. Spirtes, C. N. Glymour, and R. Scheines,Causation, prediction, and search. MIT press, 2000
2000
-
[44]
Root cause analysis of failures in microservices through causal discovery,
A. Ikram, S. Chakraborty, S. Mitra, S. Saini, S. Bagchi, and M. Ko- caoglu, “Root cause analysis of failures in microservices through causal discovery,”Advances in Neural Information Processing Sys- tems, vol. 35, pp. 31 158–31 170, 2022. VOLUME , 15 Authoret al.: Preparation of Papers for IEEE OPEN JOURNALS
2022
-
[45]
Generative adversarial nets,
I. J. Goodfellow, J. Pouget-Abadie, M. Mirza, B. Xu, D. Warde-Farley, S. Ozair, A. Courville, and Y . Bengio, “Generative adversarial nets,” Advances in neural information processing systems, vol. 27, 2014
2014
-
[46]
Statistical learning with sparsity,
T. Hastie, R. Tibshirani, and M. Wainwright, “Statistical learning with sparsity,”Monographs on statistics and applied probability, vol. 143, no. 143, p. 8, 2015
2015
-
[47]
Benchmarking graph neural networks,
V . P. Dwivedi, C. K. Joshi, A. T. Luu, T. Laurent, Y . Bengio, and X. Bresson, “Benchmarking graph neural networks,”J. Mach. Learn. Res., vol. 24, no. 43, pp. 1–48, 2023
2023
-
[48]
How powerful are graph neural networks?
K. Xu, W. Hu, J. Leskovec, and S. Jegelka, “How powerful are graph neural networks?”arXiv preprint arXiv:1810.00826, 2018
Pith/arXiv arXiv 2018
-
[49]
A. Grattafioriet al., “The Llama 3 herd of models,”arXiv preprint arXiv:2407.21783, 2024
Pith/arXiv arXiv 2024
-
[50]
(2026) O-ran software community
O-RAN Software Community. (2026) O-ran software community. [Online]. Available: https://o-ran-sc.org/
2026
-
[51]
(2026) srsran
Software Radio Systems. (2026) srsran. [Online]. Available: https://www.srslte.com/
2026
-
[52]
(2026) Open5gs
Open5GS. (2026) Open5gs. [Online]. Available: https://open5gs.org/
2026
-
[53]
(2026) Gemma 4
Google DeepMind. (2026) Gemma 4. [Online]. Available: https://deepmind.google/models/gemma/gemma-4/
2026
-
[54]
Gemma: Open models based on gemini research and technology,
G. Team, T. Mesnard, C. Hardin, R. Dadashi, S. Bhupatiraju, S. Pathak, L. Sifre, M. Rivi `ere, M. S. Kale, J. Loveet al., “Gemma: Open models based on gemini research and technology,”arXiv preprint arXiv:2403.08295, 2024
Pith/arXiv arXiv 2024
-
[55]
FALCON: An accurate real- time monitor for client-based mobile network data analytics,
R. Falkenberg and C. Wietfeld, “FALCON: An accurate real- time monitor for client-based mobile network data analytics,” in 2019 IEEE Global Communications Conference (GLOBECOM). Waikoloa, Hawaii, USA: IEEE, Dec. 2019. [Online]. Available: https://arxiv.org/abs/1907.10110
Pith/arXiv arXiv 2019
-
[56]
Bleu: a method for automatic evaluation of machine translation,
K. Papineni, S. Roukos, T. Ward, and W.-J. Zhu, “Bleu: a method for automatic evaluation of machine translation,” inProceedings of the 40th annual meeting of the Association for Computational Linguistics, 2002, pp. 311–318
2002
-
[57]
Meteor: An automatic metric for mt evaluation with improved correlation with human judgments,
S. Banerjee and A. Lavie, “Meteor: An automatic metric for mt evaluation with improved correlation with human judgments,” in Proceedings of the acl workshop on intrinsic and extrinsic evaluation measures for machine translation and/or summarization, 2005, pp. 65–72
2005
-
[58]
Rouge: A package for automatic evaluation of summaries,
C.-Y . Lin, “Rouge: A package for automatic evaluation of summaries,” inText summarization branches out, 2004, pp. 74–81
2004
-
[59]
Bertscore: Evaluating text generation with bert,
T. Zhang, V . Kishore, F. Wu, K. Q. Weinberger, and Y . Artzi, “Bertscore: Evaluating text generation with bert,”arXiv preprint arXiv:1904.09675, 2019. APPENDIX ILLUSTRATIVE PIPELINE ARTIFACTS A. Causal Graph and Root-Cause Ranking Figure 12 shows a representative causal graph produced by the SAM-based discovery pipeline for a packet-delay impairment on t...
Pith/arXiv arXiv 1904
-
[60]
Inspect the transport network between the Near-RT RIC and the O-DU/O-CU for congestion or hardware faults
-
[61]
Verify the E2 agent configuration on the O-DU/O-CU to ensure there are no processing bottlenecks causing uplink latency
-
[62]
HYPERP ARAMETERS AND TRAINING DETAILS D
Restart the E2 service on the affected components to clear potential stale sessions or buffer overflows. HYPERP ARAMETERS AND TRAINING DETAILS D. SAM Configurations To determine the optimal architecture and training dynamics for the SAM utilized in the causal discovery phase, we conducted an automated hyperparameter search over 110 runs using the Optuna f...
2023
discussion (0)
Sign in with ORCID, Apple, or X to comment. Anyone can read and Pith papers without signing in.