REVIEW 2 major objections 4 minor 53 references
Sectoral inter-dependencies drive the loss of structural balance in signed financial networks
T0 review · 2 major / 4 minor · reviewed 2026-08-16 · deepseek-v4-flash
Pith's one-line read Loss of structural balance in financial networks is driven by conflicts between sectors, not within them.
desk verdict Solid mesoscopic decomposition with one load-bearing 3-sigma threshold that needs a sensitivity sweep before the central claim is fully trusted. read the letter →
The pith
A machine-rendered reading of the paper's core claim, the machinery that carries it, and where it could break.
The reading
What carries the argument
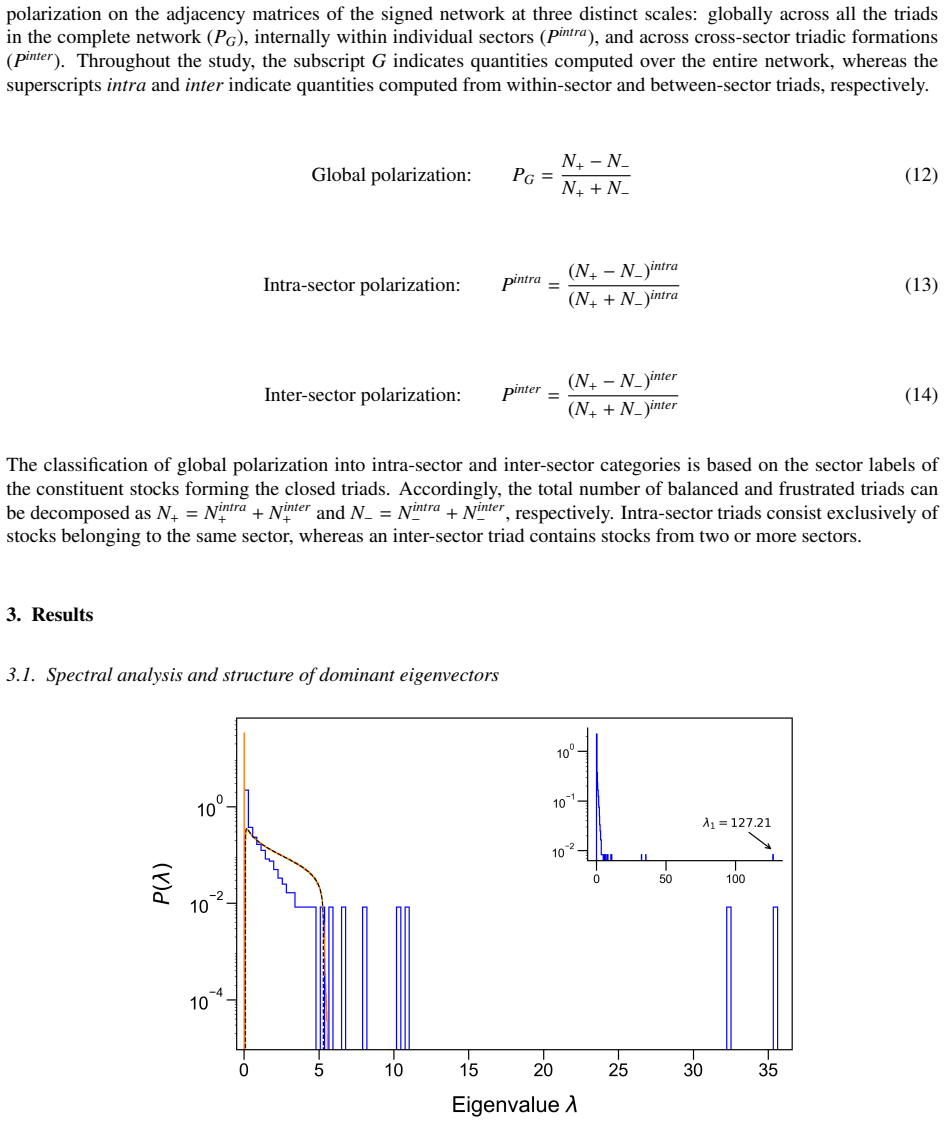
The signed network is derived from the group component of the return cross-correlation matrix, obtained by random-matrix filtering: eigenvalues outside the Marchenko-Pastur bulk, excluding the largest market mode, reconstruct $C_{\mathrm{group}}$, and entries of $C_{\mathrm{group}}$ are thresholded at $\mu_{\mathrm{random}} \pm 3\sigma_{\mathrm{random}}$ to assign positive, negative, or zero edges. Structural balance is quantified by the polarization order parameter $P=(N_+ - N_-)/(N_+ + N_-)$, where $N_\pm$ are the counts of balanced and frustrated triads, and the key identity is the decomposition $P_G = P_G^{\mathrm{intra}} W_G^{\mathrm{intra}} + P_G^{\mathrm{inter}} W_G^{\mathrm{inter}}$, which attributes global imbalance to intra- versus inter-sector triads.
What would settle it
Recompute the full intra/inter decomposition of $P_G$ with Eq. (10) thresholds of $2\sigma_{\mathrm{random}}$ and $4\sigma_{\mathrm{random}}$ on the same 56 windows; if the inter-sector component no longer tracks the global decline (or if intra-sector polarization drops as much as inter-sector), the paper's central conclusion fails. A second check is to run the identical pipeline on sector labels randomly permuted across stocks; if inter-sector dominance persists under shuffled labels, the effect is a density artifact rather than a sectoral one.
Extended reading notes
Core claim
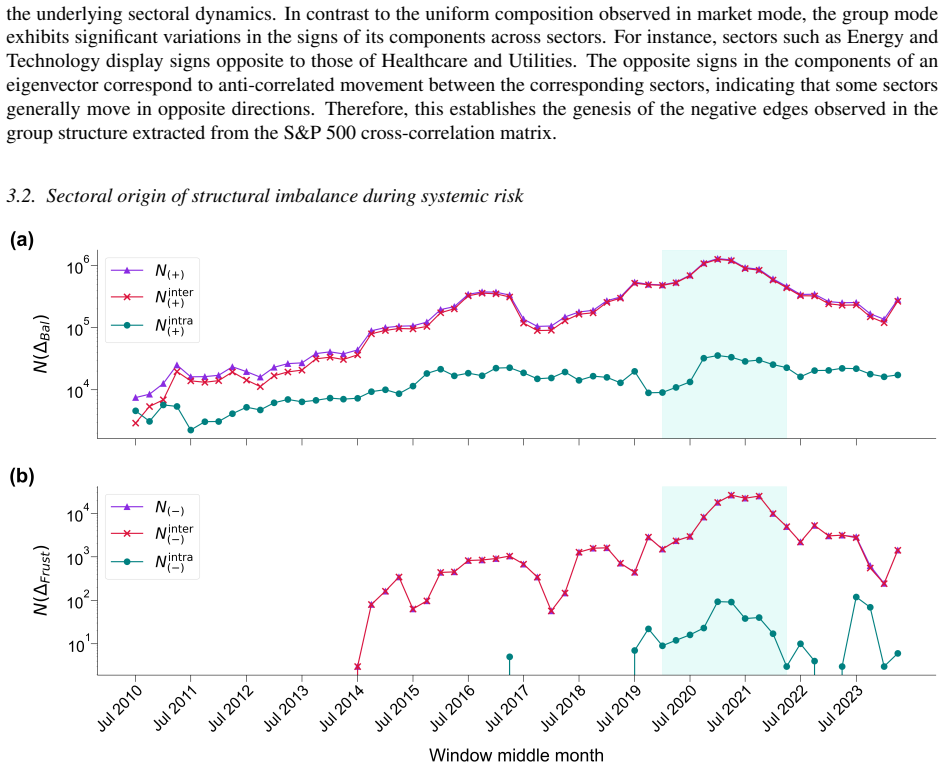
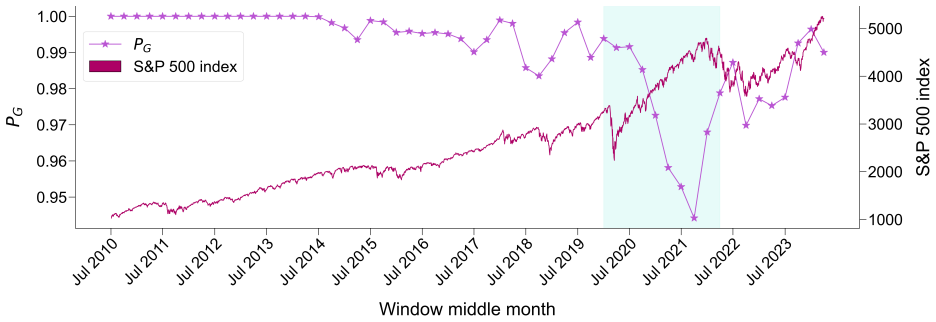
The central claim is that the crisis-time loss of global structural balance is a between-sector phenomenon: global polarization $P_G$ drops during the COVID-19 crash because triads spanning two or more sectors become frustrated, while triads within single sectors remain overwhelmingly balanced ($P^{\mathrm{intra}}\approx 1$ in most sectors). The paper demonstrates this by writing $P_G$ as a weighted sum of intra- and inter-sector polarizations, $P_G = P_G^{\mathrm{intra}} W_G^{\mathrm{intra}} + P_G^{\mathrm{inter}} W_G^{\mathrm{inter}}$, and showing that the temporal decline of $P_G$ is mirrored by $P_G^{\mathrm{inter}}$ but not by $P_G^{\mathrm{intra}}$. The same pattern is found in the 2008 financial crisis, though the COVID-19 period uniquely shows intra-sector frustrated triads, which the authors attribute to the exogenous, lockdown-driven nature of the shock. Finally, a multiple linear regression on the maximum of the supply-chain pressure index and the standard deviation of CPI explains about 68% of the variance in global polarization.
Load-bearing premise
The signed network in Eq. (10) is defined by a single threshold at $\mu_{\mathrm{random}} \pm 3\sigma_{\mathrm{random}}$ using the off-diagonal statistics of the random component $C_{\mathrm{random}}$, and every triad count and polarization measure depends on that one choice; no sensitivity analysis is given for other thresholds, and the anti-Wishart extension of the Marchenko-Pastur bound is assumed to hold exactly enough to isolate the group modes.
Editorial extensions
If this is right
- Global polarization can be monitored in real time as a continuous indicator of structural stress, with inter-sector polarization serving as the leading component that drops before the market-wide index does.
- Sectoral boundaries are the natural fault lines of the financial network: during crises, cooperation within sectors persists even when those sectors' prices are falling sharply.
- The COVID-19 crisis and the 2008 financial crisis leave distinguishable triadic signatures, so the decomposition can be used to classify the nature of a systemic shock (exogenous vs endogenous) from correlation data alone.
- Macroeconomic stress such as supply-chain pressure and inflation uncertainty is statistically associated with the measured loss of balance, tying the structural signature to measurable economic conditions.
Reading between the lines
- Changing the threshold in Eq. (10) from $3\sigma_{\mathrm{random}}$ to $2\sigma_{\mathrm{random}}$ or $4\sigma_{\mathrm{random}}$ would test whether the sector-boundary conclusion is an artifact of the single ad-hoc cutoff; the paper provides no such sensitivity analysis.
- The same decomposition could be applied directly to foreign-exchange or cryptocurrency networks, but only if those markets admit a stable sector or community partition; without one, the inter-sector interpretation is not defined.
- The regression result is a statistical association rather than causal evidence: supply-chain disruptions and inflation uncertainty could both be driven by the same underlying shock that also reshapes correlations.
- A testable extension is to examine whether inter-sector polarization Granger-causes the S&P 500 index or realized volatility, which would indicate whether the structural signature leads the crisis rather than merely accompanying it.
Signed reviews
Editorial analysis
A structured set of objections, weighed in public.
Referee Report
Summary. The paper analyzes the temporal evolution of structural balance in signed networks constructed from S&P 500 return correlations over 2010-2024, with a parallel analysis of the 2008 GFC period in the SI. After filtering the empirical correlation matrix into global, group, and random components via Random Matrix Theory, the authors threshold the group correlation matrix at the mean of the random component plus or minus three standard deviations to build signed networks. They compute global, intra-sector, and inter-sector triadic polarization, and decompose the global polarization into a weighted sum of intra- and inter-sector components. The central claim is that during systemic risk, particularly the COVID-19 crisis, the loss of structural balance is driven predominantly by frustrated triads spanning different sectors, while intra-sector structures remain largely balanced. The paper validates the polarization values with two null models and relates global polarization to supply chain pressure and inflation uncertainty through a multiple linear regression.
Significance. If the central claim holds, the paper provides a useful mesoscopic account of how structural balance is lost in financial networks: frustration concentrates at sector boundaries while sectors themselves remain internally coherent. The algebraic decomposition in Eq. (16) is exact by construction, and the paper gains credibility from the use of two distinct null models (signed degree-preserving rewiring and the signed topology-preserving maximum-entropy model) and from validation on an independent 2008 GFC dataset. The regression results and the COVID-versus-GFC comparison in terms of intra-sector negative edge density are also interesting. However, the principal empirical conclusion depends on an unexamined threshold choice in the signed-network construction, and the attribution of imbalance to inter-sector effects is not tested against a baseline that preserves the sector-block structure or the naturally large number of inter-sector triads. These issues are fixable but require additional analysis; I therefore recommend major revision rather than rejection.
major comments (2)
- [§2.3, Eq. (10)] The signed adjacency matrix is defined by thresholding C_group at μ_random ± 3σ_random, where μ_random and σ_random are the mean and standard deviation of the off-diagonal entries of C_random. Every quantity central to the paper—N_+, N_-, P_G, P_intra, P_inter, and the weights in Eq. (16)—is a deterministic function of this single, ad-hoc threshold. No sensitivity analysis is provided in the main text or the SI: a 2σ or 4σ threshold, or a quantile-based threshold, may change the set of positive and negative edges, and it cannot be assumed a priori that the intra/inter decomposition remains qualitatively unchanged. Because entries of C_group are not independent of C_random and the threshold is not calibrated to a controlled false-positive rate, the central claim that imbalance arises predominantly from inter-sector rather than intra-sector frustration currently rests on an unexamined choice. Please add a systematic threshold sweep and demonstrate that the temporal patterns, the COVID dip, and the GFC comparison are robust.
- [§3.3, Eq. (18)] The null-model analysis in Fig. 9 shows that the empirical polarization values are statistically far from sign-randomized ensembles, but it does not directly test the attribution claim. The z-scores are computed for each polarization metric separately, and the null models rewire signs while approximately preserving topology and degree; they do not preserve the sector-block structure of the signs. Consequently, the analysis does not test whether P_inter is significantly lower than P_intra, nor does it control for the fact that inter-sector triads vastly outnumber intra-sector triads by pure combinatorics. A sector-label-preserving null (for example, randomizing edge signs while fixing the number of positive and negative edges within each sector-pair block) would provide a more direct baseline for the claim that frustration concentrates at sector boundaries. Without such a control, the visual contrast between P_intra ≈ 1 and lower P_inter, while suggestive, is not yet quantified against the natural combinatorial baseline.
minor comments (4)
- [§3.2, paragraph after Fig. 4] The text states that there is a gradual increase in the number of inter-sector frustrated triads N^inter_- but writes the symbol as N^intra_-; the superscript should be corrected to avoid confusion with the intra-sector count discussed in the same paragraph.
- [§3.4, Eq. (19)] The regression is based on 56 heavily overlapping windows, and the predictors are window-level summaries selected from two macroeconomic indicators. HAC standard errors are a useful step, but the p-values and confidence intervals should be interpreted with caution because of the overlapping-window induced autocorrelation and the generated-regressor nature of the predictors.
- [§4, permutation test on ρ^intra_neg] The permutation test compares the first seven peak values of the intra-sector negative edge density in each crisis period. The selection of exactly seven peak values should be justified as a pre-specified rule, rather than an ex post choice, to avoid concerns about selective window selection.
- [SI Text S1.1] The 2008 GFC analysis maps all stocks to the modern 11-sector GICS classification even though Real Estate and Communication Services became standalone sectors only later. The main text notes the static mapping for the COVID analysis, but the SI should state explicitly that the same static modern classification is applied retrospectively and discuss any potential look-ahead bias.
Circularity Check
No significant circularity: the intra/inter decomposition is an explicit triad-count identity, and the central sectoral claim rests on independent empirical comparisons rather than on fitted or self-referential inputs.
full rationale
The derivation chain is self-contained. The signed network is built from the RMT-filtered group correlation matrix using the fixed threshold rule in Eq. (10); the 3-sigma threshold is computed from the random component and is not fitted to reproduce any polarization target. The polarization quantities in Eqs. (11)-(14) are direct functions of counted triads, and Eqs. (15)-(17) form an explicit algebraic decomposition: global polarization is expressed as a weighted sum of intra-sector and inter-sector polarizations. This identity does not manufacture the paper's conclusion; the conclusion that inter-sector frustration dominates is an empirical finding based on the separate temporal behaviors of P_intra (remaining high/balanced), P_inter (declining), and P_G in Figures 5, 6, and 8. The null-model analysis in Sec. 3.3 benchmarks these observed values against independent randomized ensembles, and the regression in Sec. 3.4 is presented as an in-sample OLS fit to external macroeconomic variables, not as a first-principles prediction with fitted parameters renamed as outputs. The paper's self-citations are background or methodological references and are not load-bearing: the anti-Wishart/Marchenko-Pastur statement is also supported by the independent result in [31], and the polarization measure is adopted from external work [23]. The skeptic's concern about the unexamined 3-sigma threshold is a legitimate robustness/correctness issue, but it is not circularity: changing the threshold would alter the network and would require rechecking the conclusions, but the analysis does not assume the conclusion it is intended to establish.
Assumptions & free parameters
free parameters (4)
- Signed-network threshold (mu_random +/- 3 sigma_random) =
3 sigma
- Window length =
T = 252 trading days
- Window overlap =
63 days
- Regression predictor summaries =
GSCPI_max and CPI_std
assumptions (6)
- standard math The Marchenko-Pastur upper bound lambda+ remains analytically valid for the bulk spectrum in the anti-Wishart regime T < N, and the non-zero eigenvalue distribution matches the Wishart case with N and T interchanged.
- domain assumption Triadic balance is a sufficient first-order measure of structural balance; longer cycles contribute less to overall balance.
- ad hoc to paper The off-diagonal mean and standard deviation of the random component C_random provide a valid null baseline for thresholding the group correlations.
- domain assumption A static GICS sector mapping is a valid mesoscopic grouping across the entire 2010-2024 study period.
- domain assumption The 252-day window length provides a good approximation to stationarity.
- domain assumption The z-score threshold z > 3 marks statistical significance.
Cite this review
Pith. "Pith review of Sectoral inter-dependencies drive the loss of structural balance in signed financial networks." pith.science (2026). https://pith.science/paper/PIV7GHJC
@misc{pith2026260812023,
  author       = {Pith},
  title        = {Pith review of: Sectoral inter-dependencies drive the loss of structural balance in signed financial networks},
  year         = {2026},
  howpublished = {\url{https://pith.science/paper/PIV7GHJC}},
  note         = {Machine review of arXiv:2608.12023}
}
read the original abstract
Signed graphs provide an effective architecture for portraying a system in which cooperation and conflict coexist. Emerging from the concept of balance in psychological sciences, they have found applications across several domains. Financial markets are one such example that can be modeled using signed networks, where assets exhibit correlations in price movements. During periods of systemic risk, such a signed financial network shows a loss of balance, which has been consistently demonstrated. Here, we explore how this structural imbalance is distributed across scales within the financial network, revealing its mesoscopic origin. Adopting the framework of structural balance theory, we use a measure of polarization based on triadic motifs to investigate the distribution of structural imbalance across varying sectoral scales. We analyze the temporal evolution of global polarization and its sectoral constituents using longitudinal data derived from the S&P 500 index. By decomposing global polarization into intra-sectoral and inter-sectoral constituents, we show that structural imbalance arises predominantly from interactions between sectors rather than within them during periods marked by systemic risk. We employ randomization protocols to confirm that observed imbalance configurations are statistically significant and not artifacts of lower-order interactions. We derive a regression equation demonstrating that the variance in global polarization is well explained by macroeconomic variables, indicating that low levels of global polarization during economic crises are driven by compounding pressures from supply chain disruptions and inflation uncertainty. Collectively, these findings provide a quantitative framework for understanding how localized sectoral conflicts propagate across the financial network and contribute to large-scale structural instability during periods of economic crisis.
Figures


Figures from the paper (8 more)




Reference graph
Works this paper leans on
-
[1]
R. N. Mantegna, H. E. Stanley, Introduction to econophysics: correlations and complexity in finance, Cambridge university press, 1999
1999
- [2]
-
[3]
R. Cont, J.-P. Bouchaud, Herd behavior and aggregate fluctuations in financial markets, Macroeconomic dynam- ics 4 (2) (2000) 170–196
work page 2000
-
[4]
Laloux, P
L. Laloux, P. Cizeau, J.-P. Bouchaud, M. Potters, Noise dressing of financial correlation matrices, Physical review letters 83 (7) (1999) 1467
1999
-
[5]
Plerou, P
V . Plerou, P. Gopikrishnan, B. Rosenow, L. A. N. Amaral, H. E. Stanley, Universal and nonuniversal properties of cross correlations in financial time series, Physical review letters 83 (7) (1999) 1471
1999
-
[6]
Plerou, P
V . Plerou, P. Gopikrishnan, B. Rosenow, L. A. N. Amaral, T. Guhr, H. E. Stanley, Random matrix approach to cross correlations in financial data, Physical Review E 65 (6) (2002) 066126
2002
-
[7]
D.-H. Kim, H. Jeong, Systematic analysis of group identification in stock markets, Physical Review E—Statistical, Nonlinear, and Soft Matter Physics 72 (4) (2005) 046133
work page 2005
-
[8]
R. K. Pan, S. Sinha, Collective behavior of stock price movements in an emerging market, Physical Review E—Statistical, Nonlinear, and Soft Matter Physics 76 (4) (2007) 046116
work page 2007
Show all 53 references
-
[9]
J. Shen, B. Zheng, Cross-correlation in financial dynamics, EPL (Europhysics Letters) 86 (4) (2009) 48005
2009
-
[10]
Battiston, M
S. Battiston, M. Puliga, R. Kaushik, P. Tasca, G. Caldarelli, Debtrank: Too central to fail? financial networks, the fed and systemic risk, Scientific reports 2 (1) (2012) 541
2012
-
[11]
Chakraborty, T
A. Chakraborty, T. Reisch, C. Diem, P. Astudillo-Estévez, S. Thurner, Inequality in economic shock exposures across the global firm-level supply network, Nature Communications 15 (1) (2024) 3348
2024
-
[12]
T. Aste, W. Shaw, T. Di Matteo, Correlation structure and dynamics in volatile markets, New Journal of Physics 12 (8) (2010) 085009
2010
-
[13]
Jiang, T
X. Jiang, T. Chen, B. Zheng, Structure of local interactions in complex financial dynamics, Scientific reports 4 (1) (2014) 5321
2014
-
[14]
Kuyyamudi, A
C. Kuyyamudi, A. S. Chakrabarti, S. Sinha, Emergence of frustration signals systemic risk, Physical Review E 99 (5) (2019) 052306
2019
-
[15]
Ferreira, S
E. Ferreira, S. Orbe, J. Ascorbebeitia, B. Álvarez Pereira, E. Estrada, Loss of structural balance in stock markets, Scientific Reports 11 (1) (2021) 12230
2021
-
[16]
Heider, Attitudes and cognitive organization, The Journal of psychology 21 (1) (1946) 107–112
F. Heider, Attitudes and cognitive organization, The Journal of psychology 21 (1) (1946) 107–112
1946
-
[17]
Cartwright, F
D. Cartwright, F. Harary, Structural balance: a generalization of heider’s theory., Psychological review 63 (5) (1956) 277
1956
-
[18]
S. A. Marvel, S. H. Strogatz, J. M. Kleinberg, Energy landscape of social balance, Physical review letters 103 (19) (2009) 198701. 17
2009
-
[19]
Zahedian, M
M. Zahedian, M. Bagherikalhor, A. Trufanov, G. R. Jafari, Financial crisis in the framework of non-zero tem- perature balance theory, PloS one 17 (12) (2022) e0279089
2022
-
[20]
A. M. Belaza, K. Hoefman, J. Ryckebusch, A. Bramson, M. van den Heuvel, K. Schoors, Statistical physics of balance theory, PLoS one 12 (8) (2017) e0183696
2017
-
[21]
Facchetti, G
G. Facchetti, G. Iacono, C. Altafini, Computing global structural balance in large-scale signed social networks, Proceedings of the National Academy of Sciences 108 (52) (2011) 20953–20958
2011
-
[22]
K. H. Fischer, J. A. Hertz, Spin glasses, no. 1, Cambridge university press, 1993
1993
-
[23]
Minh Pham, I
T. Minh Pham, I. Kondor, R. Hanel, S. Thurner, The effect of social balance on social fragmentation, Journal of the Royal Society Interface 17 (172) (2020)
2020
-
[24]
Thurner, M
S. Thurner, M. Hofer, J. Korbel, Why more social interactions lead to more polarization in societies, Proceedings of the National Academy of Sciences 122 (44) (2025) e2517530122
2025
-
[25]
URLhttps://finance.yahoo.com/
Yahoo Finance, Historical market data, accessed on: December 10, 2025. URLhttps://finance.yahoo.com/
2025
-
[26]
rep., MSCI and S&P Dow Jones Indices (2023)
MSCI, S&P Dow Jones Indices, Global industry classification standard GICS methodology, Tech. rep., MSCI and S&P Dow Jones Indices (2023). URLhttps://www.msci.com/documents/1296102/11185224/GICS+Methodology+2023.pdf
2023
-
[27]
H. K. Pharasi, K. Sharma, A. Chakraborti, T. H. Seligman, Complex market dynamics in the light of random matrix theory, in: New perspectives and challenges in econophysics and sociophysics, Springer, 2019, pp. 13–34
2019
-
[28]
URLhttps://www.newyorkfed.org/research/policy/gscpi
Federal Reserve Bank of New York, Global supply chain pressure index (GSCPI), accessed on: June 2026. URLhttps://www.newyorkfed.org/research/policy/gscpi
2026
-
[29]
Bureau of Labor Statistics, Consumer price index for all urban consumers: All items in U.S
U.S. Bureau of Labor Statistics, Consumer price index for all urban consumers: All items in U.S. city average (CPIAUCSL), accessed on: June 2026. URLhttps://fred.stlouisfed.org/series/CPIAUCSL
2026
-
[30]
V . A. Marˇcenko, L. A. Pastur, Distribution of eigenvalues for some sets of random matrices, Mathematics of the USSR-Sbornik 1 (4) (1967) 457–483
1967
-
[31]
P. Vivo, S. N. Majumdar, O. Bohigas, Large deviations of the maximum eigenvalue in wishart random matrices, Journal of Physics A: Mathematical and Theoretical 40 (16) (2007) 4317–4337
2007
-
[32]
Diaz-Diaz, E
F. Diaz-Diaz, E. Candellone, M. A. González-Casado, E. Fraxanet, A. Vendeville, I. Ferri, A. S. Teixeira, Signed networks: theory, methods, and applications, arXiv preprint arXiv:2511.17247 (2025)
2025
-
[33]
S. Aref, L. Dinh, R. Rezapour, J. Diesner, Multilevel structural evaluation of signed directed social networks based on balance theory, Scientific reports 10 (1) (2020) 15228
2020
-
[34]
Sinha, U
S. Sinha, U. Kovur, Uncovering the network structure of the world currency market: Cross-correlations in the fluctuations of daily exchange rates, Econophysics of Agent-Based Models (2013) 203
2013
-
[35]
Balemi, R
N. Balemi, R. Füss, A. Weigand, Covid-19’s impact on real estate markets: review and outlook, Financial Markets and Portfolio Management 35 (4) (2021) 495
2021
-
[36]
K. Baba, R. Shibata, M. Sibuya, Partial correlation and conditional correlation as measures of conditional inde- pendence, Australian & New Zealand Journal of Statistics 46 (4) (2004) 657–664
2004
-
[37]
D. Y . Kenett, M. Tumminello, A. Madi, G. Gur-Gershgoren, R. N. Mantegna, E. Ben-Jacob, Dominating clasp of the financial sector revealed by partial correlation analysis of the stock market, PloS one 5 (12) (2010) e15032
2010
-
[38]
Z. T. Kang, P. T.-W. Yen, S. A. Cheong, Indicator from the graph laplacian of stock market time series cross- sections can precisely determine the durations of market crashes, PLoS One 20 (7) (2025) e0327391
2025
-
[39]
Hammond, Geometric observables for financial regime detection, arXiv preprint arXiv:2605.17117 (2026)
W. Hammond, Geometric observables for financial regime detection, arXiv preprint arXiv:2605.17117 (2026)
2026 arXiv
-
[40]
Kirkley, G
A. Kirkley, G. T. Cantwell, M. E. Newman, Balance in signed networks, Physical Review E 99 (1) (2019) 012320
2019
-
[41]
Maslov, K
S. Maslov, K. Sneppen, Specificity and stability in topology of protein networks, Science 296 (5569) (2002) 910–913. 18
2002
-
[42]
B. Hao, I. A. Kovács, Proper network randomization is key to assessing social balance, Science Advances 10 (18) (2024) eadj0104
2024
-
[43]
B. Hao, B. Kovács, null_model_graphlet: Reference implementation of the signed topology-preserving null model,https://github.com/hbj153/null_model_graphlet(2024)
2024
-
[44]
T. M. Pham, A. C. Alexander, J. Korbel, R. Hanel, S. Thurner, Balance and fragmentation in societies with homophily and social balance, Scientific reports 11 (1) (2021) 17188
2021
-
[45]
D. I. Agatón Lombera, D. A. Cardoso López, J. A. López Cabrera, J. A. Nuñez Mora, Market reactions to us financial indices: A comparison of the gfc versus the covid-19 pandemic crisis, Economies 12 (7) (2024) 165
2024
-
[46]
M. M. Martínez-Ramos, M. Vyas, P. Majari, T. H. Seligman, Covid anomaly in the correlation analysis of s&p 500 market states, Plos one 19 (4) (2024) e0301238
2024
-
[47]
Saberi, J
M. Saberi, J. R. Rieck, S. Golafshan, C. L. Grady, B. Misic, B. T. Dunkley, A. Khatibi, The brain selectively allocates energy to functional brain networks under cognitive control, Scientific Reports 14 (1) (2024) 32032
2024
-
[48]
Saberi, A
M. Saberi, A. HaqiqiFar, A. Abdolalizadeh, B. Misic, A. Khatibi, Empirical evidence for structural balance theory in functional brain networks, Frontiers in Network Physiology 5 (2025) 1681597
2025
-
[49]
Benigno, J
G. Benigno, J. Di Giovanni, J. J. Groen, A. I. Noble, The gscpi: A new barometer of global supply chain pressures, FRB of New York StaffReport (1017) (2022)
2022
-
[50]
Nguyen, H.-G
T.-T. Nguyen, H.-G. Nguyen, J.-Y . Lee, Y .-L. Wang, C.-S. Tsai, The consumer price index prediction using machine learning approaches: Evidence from the united states, Heliyon 9 (10) (2023)
2023
-
[51]
Chakraborty, S
A. Chakraborty, S. Easwaran, S. Sinha, Deviations from universality in the fluctuation behavior of a heteroge- neous complex system reveal intrinsic properties of components: The case of the international currency market, Physica A: Statistical Mechanics and its Applications 5...
2018
-
[52]
Chakraborty, S
A. Chakraborty, S. Easwaran, S. Sinha, Uncovering the hierarchical structure of the international forex market by using similarity metric between the fluctuation distributions of currencies, Acta Physica Polonica 138 (1) (2020) 105–115
2020
-
[53]
Shukla, M
S. Shukla, M. Peyyala, A. Chakraborty, Time-dependent weighted directed networks of cryptocurrency interac- tion from high-frequency returns, arXiv preprint arXiv:2606.25466 (2026). 19 Supplementary Information SI Text S1. Robustness check: Structural balance during the 2008 g...
2026 arXiv
Reviewed August 16, 2026 · model on record in the stance chip above.
Discussion (0). Continue with ORCID to comment.