REVIEW 4 major objections 5 minor 84 references
In NGC 752 and Ruprecht 147, atomic diffusion depletes the surfaces of ~1.2–1.35 solar-mass stars by 0.08–0.12 dex on average, beyond 3σ, and fitting the observed Teff–[Fe/H] pattern gives cluster ages of 1.0 and 2.5–3.2 Gyr.
Reviewed by Pith at T0; open to challenge. T0 means a machine referee read the full paper against a public rubric. the ladder, T0–T4 →
T0 review · deepseek-v4-flash
2026-08-02 02:46 UTC pith:PKLK4YBN
load-bearing objection NGC 752 diffusion detection is credible; the Ruprecht 147 claim is not yet robust to pipeline and line-list systematics. the 4 major comments →
The Open Cluster Chemical Abundances and Mapping Survey: IX. Measuring the Effects of Stellar Diffusion in the Open Clusters NGC 752 and Ruprecht 147 using APOGEE
The pith
A machine-rendered reading of the paper's core claim, the machinery that carries it, and where it could break.
Core claim
Central claim: stars in the diffusion-dominated mass range (~1.2–1.35 solar masses) are systematically depleted relative to the cool-star reference in every element with reliable measurements, with mean Diff−CS offsets of −0.08±0.01 dex (NGC 752) and −0.12±0.01 dex (Ruprecht 147), both beyond 3σ. The authors attribute this to atomic diffusion — gravitational settling outweighing radiative levitation — in stars whose thin convective envelopes cannot dilute the sinking material. Because the predicted depletion minimum sits at a nearly age-independent mass near 1.25 M☉, the signature appears on the upper main sequence in the younger cluster and near the turnoff in the older one. Carbon is a dua
What carries the argument
The machinery is a mass-based classification rather than an evolutionary label: five classes (cool stars CS, main sequence MS, diffusion-dominated Diff, turnoff transition MS–TO, red giants RG) defined from isochrone-derived masses, with the Diff class centered on the predicted depletion minimum near 1.25 M☉, where the surface convection zone is thinnest and turbulent mixing — modeled in MIST as D_T ∝ (M_CZ/M⋆)^(−3/2) — has not yet restored the surface composition. The CS class, with deep convective envelopes that dilute settling, serves as the pristine-composition reference. The measured signal is the per-element Diff−CS offset (with significance from the dispersion of each class), and the
Load-bearing premise
The attribution of the Diff−CS offsets to atomic diffusion rests on the assumption that the line-by-line abundance analysis, after removing lines with known temperature trends (§§4.2.4–4.2.6), retains no temperature-dependent bias — a fragile premise because the diffusion signal is itself a Teff–abundance trend, and the paper's own Appendix B shows that APOGEE DR19 and DR17 pipelines often return null or opposite-sign offsets for Ruprecht 147.
What would settle it
Recompute the Diff−CS offsets for the same stars using a deliberately temperature-insensitive line list or a full non-LTE/3D analysis: if the −0.08 to −0.12 dex depletion vanishes, flips sign, or shrinks below the quoted uncertainties — as the automated pipelines already suggest for Ruprecht 147 (DR19 gives Fe +0.026 while this work gives −0.090) — the diffusion interpretation fails. Equivalently, shifting the adopted photometric Teff scale by its ~50–150 K systematic offsets and showing the offsets disappear would falsify the claim.
If this is right
- Every element with reliable measurements in both classes is depleted in the diffusion-dominated stars relative to the cool-star reference, with mean offsets of −0.08±0.01 dex (NGC 752) and −0.12±0.01 dex (Ruprecht 147), each significant beyond 3σ.
- Diffusion-inclusive MIST isochrones fit the observed Teff–[Fe/H] pattern better than a constant-metallicity model, favoring ages of 1.0 Gyr (NGC 752) and 2.5–3.2 Gyr (Ruprecht 147), consistent with photometric ages.
- Isochrone fitting that treats surface abundances as pristine will systematically mis-estimate ages; the paper cites earlier work quantifying age biases of roughly 10–20% from neglecting diffusion.
- Carbon is a key diagnostic because it traces both atomic diffusion (in warm stars) and first dredge-up (in red giants), allowing the two mixing processes to be separated along a cluster sequence.
- The cool-star populations give the cleanest estimate of initial cluster metallicity: [Fe/H] = 0.01±0.02 for NGC 752 and 0.17±0.00 for Ruprecht 147.
- The abundance pattern alone can act as a chemical clock for cluster ages, providing an estimate independent of photometry and distance.
Where Pith is reading between the lines
- If diffusion is the right explanation, the depletion minimum at ~1.25 M☉ predicts where the signature appears in any cluster of known age: re-analyzing other open clusters with full main-sequence coverage should show the abundance dip migrating to cooler temperatures as cluster age increases, a trend the two clusters here already hint at.
- The paper's own pipeline comparison (Appendix B) shows the Diff−CS offsets are not pipeline-independent: for Ruprecht 147, APOGEE DR19 and DR17 scales often return null or opposite-sign offsets (e.g., Fe +0.026 vs −0.090). A decisive follow-up would measure the same stars with an independent line list or a full non-LTE treatment.
- Because carbon shows both diffusion and dredge-up signatures, combined C and N measurements along a cluster sequence could separate the two effects and calibrate the turbulent-mixing prescription, which is currently pinned to a single metal-poor globular cluster.
- The claimed chemical clock — ages from abundance patterns alone — would be robust to distance and reddening uncertainties that plague photometric fitting; extending it to clusters of different metallicities would test whether the diffusion dip is metallicity-independent as the models assume.
Editorial analysis
A structured set of objections, weighed in public.
Referee Report
Summary. The paper uses APOGEE DR17/DR19 spectra of the open clusters NGC 752 and Ruprecht 147 to search for surface abundance changes caused by atomic diffusion. The authors derive photometric Teff and isochrone-based logg, measure elemental abundances for 16 elements with BACCHUS/MARCS, and divide each cluster sample into five evolutionary classes (CS, MS, Diff, MS-TO, RG) using MIST isochrones. They report that stars in the diffusion-dominated mass range are depleted relative to the cool-star reference population in both clusters, with average Diff-CS offsets of -0.08±0.01 dex (NGC 752) and -0.12±0.01 dex (Ruprecht 147), claimed to be >3σ significant. Fitting the Teff-[Fe/H] pattern with MIST diffusion isochrones gives best ages of 1.0 Gyr for NGC 752 and 2.5-3.2 Gyr for Ruprecht 147. The paper concludes that atomic diffusion measurably alters surface abundances of ~1.2-1.35 Msun stars and should be accounted for in isochrone fitting.
Significance. If the detection is robust, this would be a valuable addition to the observational case for atomic diffusion in open clusters, complementing previous M67 and Coma Berenices studies and providing constraints on diffusion models over a range of ages. The paper is thorough in presenting the data, membership selection, and a systematic comparison with APOGEE automated pipelines in Appendix B. However, the strength of the claim rests on a small number of stars in Ruprecht 147 and on the BACCHUS abundance scale, which Appendix B shows to be inconsistent with independent APOGEE pipelines for exactly the stars and elements used in the main claim. A useful element of the paper is the public machine-readable abundance table and the transparent accounting of line-selection choices, but these do not by themselves establish that the measured pattern is free of Teff-dependent systematics.
major comments (4)
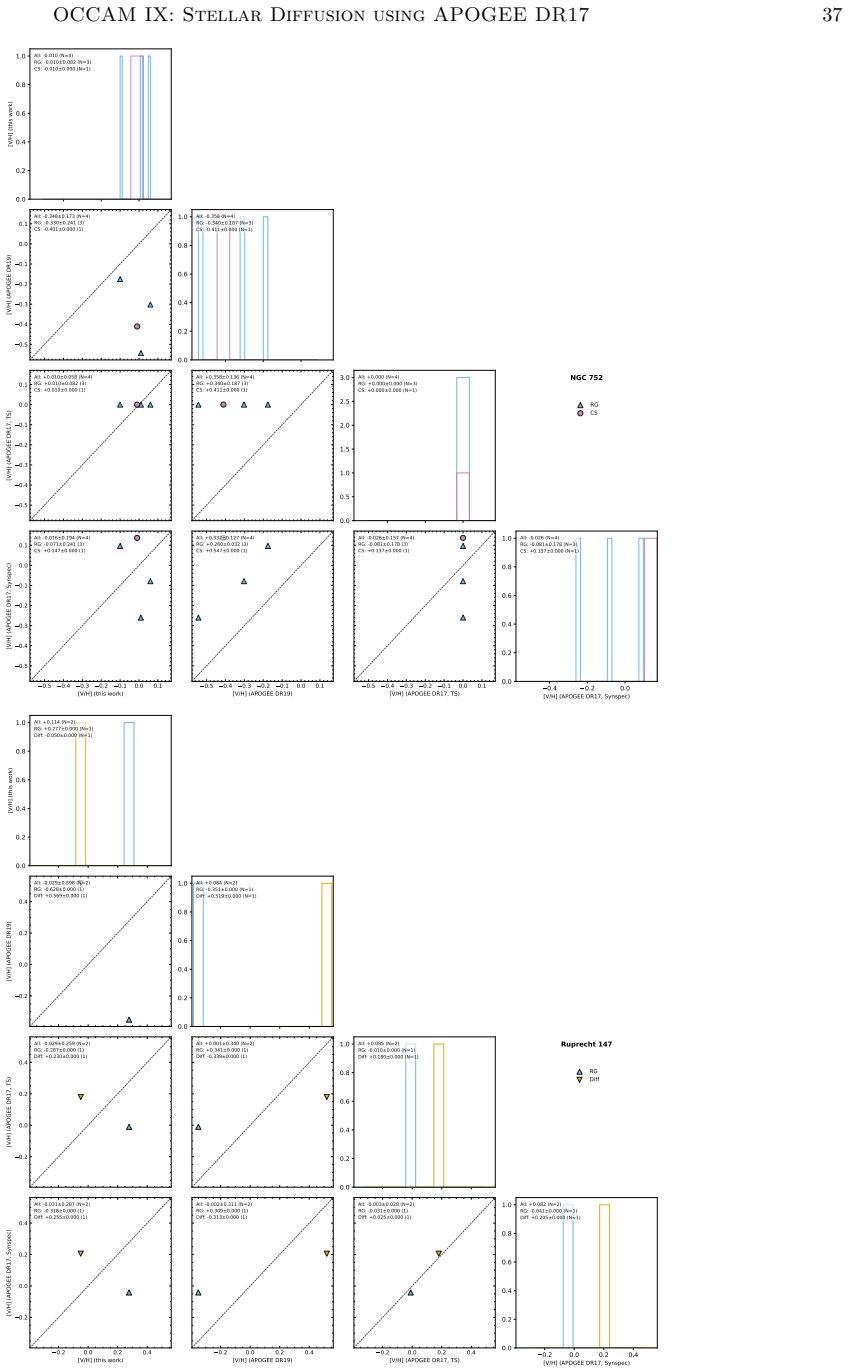
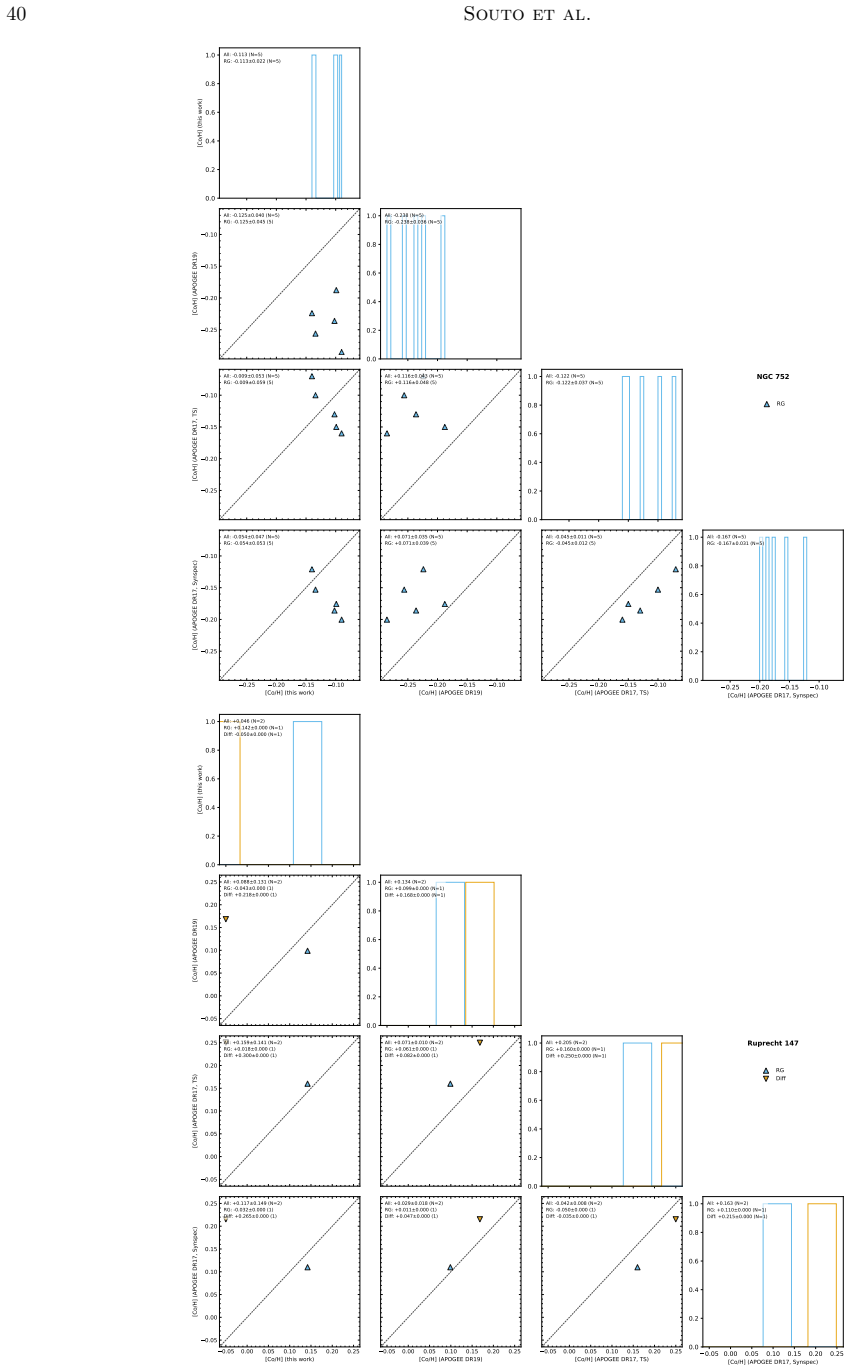
- [Appendix B, Eqs. (B1)-(B3); §4.2.14] The Ruprecht 147 detection is based on only 2 Diff and 2 CS stars. With N=2, the dispersion-based uncertainty in Eq. (B2) is essentially a two-point scatter; when the two stars have identical abundances, as in several CS measurements reported with σ=0.000, the significance S can become arbitrarily large (e.g., Fe S=-22.5, Ni S=-27.4, Cr S=-13.9 in Figs. 8, 23, 20). These numbers do not represent statistical evidence and should not be quoted as >3σ in the abstract or §5. A systematic floor, based on the 50-150 K Teff offsets in Appendix A and on the abundance-pipeline scatter in Appendix B, must be added before any significance claim.
- [Appendix B, Figs. 8-9, 13-14, 23] The Appendix B comparisons directly undercut the main claim for Ruprecht 147. For Fe (Fig. 8, bottom), this work gives Diff-CS = -0.090 while APOGEE DR19 gives +0.037; for C (Fig. 9), this work -0.129 vs DR19 +0.138; for Si (Fig. 14), this work -0.097 vs DR19 +0.052 and TS +0.030; for Al (Fig. 13), this work -0.223 vs TS -0.008 and Synspec -0.037. These are sign reversals on the same stars, using the same Diff/CS class definitions. The authors acknowledge this but do not quantify it as a systematic uncertainty in their headline offset. Until the source of this discrepancy is identified (Teff scale, line selection, gf values, or continuum normalisation), the Ruprecht 147 detection cannot be considered robust.
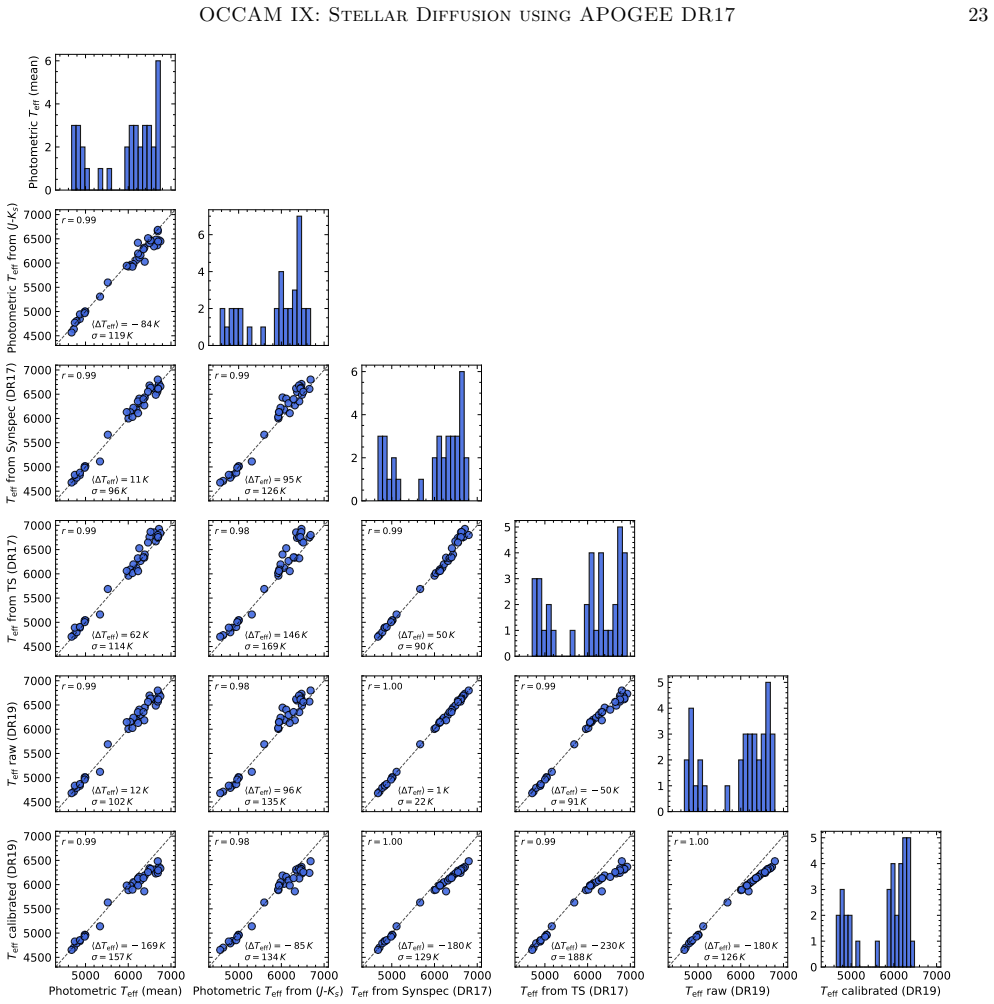
- [§§4.2.4-4.2.6; Appendix A] The diffusion signal is itself a Teff-abundance trend. The paper removes lines that show systematic Teff trends in dwarfs (Grilo et al. 2024), but does not demonstrate that the remaining lines are free of Teff-dependent biases in the relevant Teff range (5000-6700 K). Appendix A reports 50-150 K offsets between this work's Teff and APOGEE scales, and the quoted abundance uncertainties for Mg, Al, and Si are up to 0.10 dex, i.e., comparable to the claimed depletion. A convincing test would be a synthetic recovery using injected diffusion signals of varying amplitude, or a null test on a cluster/sequence where diffusion is negligible. Without such a test, the observed pattern could be a residual Teff systematic rather than atomic diffusion.
- [§4.2.14, Fig. 5; §4.1] The age inference is not independent of the model used to define the stellar sample. The same MIST isochrones assign masses and logg values, determine which stars are classified as 'Diff', predict the depletion curve, and are then fitted to the observed Teff-[Fe/H] pattern. The improvement in chi-square for the diffusion model over a constant [Fe/H] baseline is reported without uncertainties on the best-fit age or a significance estimate of the age difference (e.g., 1.0 vs 1.3 Gyr for NGC 752). The quoted best-fit ages should be framed as model-dependent consistency checks, not as 'chemical clock' measurements.
minor comments (5)
- [§3.1] The membership selection text says 'R VPROB>0.1 and R VPROB>0.1'; the second should presumably refer to PM_PROB.
- [Captions of Figs. 3 and 4] The captions describe pink triangles as red giants and yellow circles as MS-TO, while the text (e.g., §4.2.1) identifies RG as blue triangles and Diff as yellow inverted triangles. The symbol/colour scheme should be made consistent between text, captions, and the appendix figures.
- [Eq. (B1)-(B2)] The notation in the text following Eq. (B1) uses σ_TO and σ_MS, but the formula defines σ_Diff and σ_CS. Please align the notation to avoid confusion.
- [§4.2.1, footnote 8] A standard deviation of zero is interpreted in the footnote, but it would be clearer to report the numbers for the individual stars in that case, especially since Ruprecht 147 has only two CS stars.
- [Acknowledgments] The SDSS funding paragraph appears twice verbatim. Remove the duplicate.
Circularity Check
No significant circularity: the diffusion signature is an external measurement compared against a fixed MIST prediction; pipeline inconsistencies in Appendix B are a robustness concern, not a definitional reduction.
full rationale
The paper's derivation chain is observational: BACCHUS abundances from APOGEE spectra are measured against a fixed grid of MIST diffusion models whose turbulent-diffusion coefficient D_T was calibrated on NGC 6397, not on NGC 752 or Ruprecht 147. The Diff class is defined by isochrone-derived mass, and the depletion is then measured directly as Δ(Diff−CS); no fitted parameter is renamed as a prediction, and no equation reduces to another by construction. The age fit compares observed T_eff−[Fe/H] to MIST isochrones with fixed diffusion predictions, which is a standard model comparison rather than a circular derivation. The paper's own Appendix B does show that independent APOGEE pipelines produce null or opposite-sign Diff−CS offsets for several elements in Ruprecht 147, and the significance formula (Eq. B3) uses only internal dispersions rather than pipeline-to-pipeline systematics; this is a serious systematic-uncertainty and robustness concern, but it is not a circularity of the claimed derivation. The self-citations (OCCAM membership, Souto et al. line lists and prior cluster results) provide methodology and context but are not load-bearing in a way that makes the new clusters' results equivalent to prior inputs. Therefore, no specific circular step can be exhibited, and the honest finding is no significant circularity.
Axiom & Free-Parameter Ledger
free parameters (3)
- MIST turbulent diffusion coefficient D0 =
1 cm2 s-1
- Assumed cluster age used for mass/logg derivation =
1.3 Gyr (NGC 752), 2.5 Gyr (Ruprecht 147)
- Assumed cluster [Fe/H] for T_eff calibration and isochrone comparison =
-0.04/-0.05 (NGC 752), +0.12 (Ruprecht 147)
axioms (6)
- domain assumption Atomic diffusion (gravitational settling + radiative acceleration) as implemented in the MIST/MESA models correctly predicts surface abundance evolution for the studied stars.
- domain assumption Turbulent-mixing coefficient D_T from Eq. (2), with D0 = 1 cm2/s calibrated on NGC 6397, applies to solar-metallicity open clusters without recalibration.
- domain assumption Cool stars (CS) with M* ≲ 0.8–1.0 M_sun have deep convective envelopes and surface abundances equal to the initial cluster composition.
- domain assumption The photometric T_eff scale (González Hernández & Bonifacio 2009) applied at adopted cluster [Fe/H] is unbiased over 4500–7000 K.
- ad hoc to paper Lines removed because they show systematic T_eff trends in dwarfs (Grilo et al. 2024) are the only significant T_eff-dependent systematics; the remaining lines are clean.
- domain assumption For elements without explicit diffusion treatment in the MIST isochrones, iron abundance is an adequate proxy for their diffusion.
Cite this review
Pith. "Pith review of The Open Cluster Chemical Abundances and Mapping Survey: IX. Measuring the Effects of Stellar Diffusion in the Open Clusters NGC 752 and Ruprecht 147 using APOGEE." pith.science (2026). https://pith.science/paper/PKLK4YBN
@misc{pith2026260714208,
  author       = {Pith},
  title        = {Pith review of: The Open Cluster Chemical Abundances and Mapping Survey: IX. Measuring the Effects of Stellar Diffusion in the Open Clusters NGC 752 and Ruprecht 147 using APOGEE},
  year         = {2026},
  howpublished = {\url{https://pith.science/paper/PKLK4YBN}},
  note         = {Machine review of arXiv:2607.14208}
}
read the original abstract
A growing understanding of stellar processes that alter surface chemical abundances over time has opened new avenues for using these changes as probes of stellar properties. On the main sequence and near the turnoff, stellar surface abundances are affected by gravitational settling and radiative acceleration, collectively known as atomic diffusion. In this work, we use SDSS/APOGEE DR17/DR19 data to investigate atomic diffusion in the open clusters NGC~752 and Ruprecht~147, thereby constraining how these signatures vary with age. From the analysis of Fe, C, N, Na, Mg, Al, Si, S, K, Ca, Ti, V, Cr, Mn, Co, and Ni, we find significant abundance differences between stars near the turnoff and the cooler main-sequence, where warmer stars are depleted relative to the cooler main-sequence stars at the $\geq1\sigma$ level for all elements available in the analysis. These abundance differences are consistent with the signatures expected from atomic diffusion and are further supported by comparisons with stellar models that include diffusion. By fitting the observed $T_{\rm eff}$--[Fe/H] patterns with MIST isochrones, we obtain best-fit ages of 1.0~Gyr for NGC~752 and 2.5--3.2~Gyr for Ruprecht~147. Carbon is a key diagnostic, as it shows both atomic diffusion and extra-mixing signatures associated with first-dredge-up. For NGC~752, the coolest stars in our sample, which provide the best proxy for the initial cluster composition, yield [Fe/H]$_{\rm CS} = 0.01~\pm~0.02(\pm~0.05)$ dex. For Ruprecht~147, we obtain [Fe/H]$_{\rm CS} = 0.17~\pm~0.00(\pm~0.05)$ dex. Our findings further constrain atomic diffusion models, suggesting that atomic diffusion affects age estimates of stars near the main-sequence turnoff.
Figures







Reference graph
Works this paper leans on
-
[1]
2022, ApJS, 259, 35, doi: 10.3847/1538-4365/ac4414 Ag¨ ueros, M
Abdurro’uf, Accetta, K., Aerts, C., et al. 2022, ApJS, 259, 35, doi: 10.3847/1538-4365/ac4414 Ag¨ ueros, M. A., Curtis, J. L., N´ u˜ nez, A., et al. 2025, ApJ, 993, 144, doi: 10.3847/1538-4357/ae03a3
-
[2]
1998, A&A, 330, 1109, doi: 10.48550/arXiv.astro-ph/9711225 Astropy Collaboration, Robitaille, T
Alvarez, R., & Plez, B. 1998, A&A, 330, 1109, doi: 10.48550/arXiv.astro-ph/9711225 Astropy Collaboration, Robitaille, T. P., Tollerud, E. J., et al. 2013, A&A, 558, A33, doi: 10.1051/0004-6361/201322068 Astropy Collaboration, Price-Whelan, A. M., Sip˝ ocz, B. M., et al. 2018, AJ, 156, 123, doi: 10.3847/1538-3881/aabc4f Astropy Collaboration, Price-Whelan,...
-
[3]
Beaton, R. L., Oelkers, R. J., Hayes, C. R., et al. 2021, AJ, 162, 302, doi: 10.3847/1538-3881/ac260c
-
[4]
L., Kos, J., de Grijs, R., et al
Beeson, K. L., Kos, J., de Grijs, R., et al. 2024, MNRAS, 529, 2483, doi: 10.1093/mnras/stae439 Bertelli Motta, C., Pasquali, A., Richer, J., et al. 2018, MNRAS, 478, 425, doi: 10.1093/mnras/sty1011
-
[5]
Blanton, M. R., Bershady, M. A., Abolfathi, B., et al. 2017, AJ, 154, 28, doi: 10.3847/1538-3881/aa7567
-
[6]
Boesgaard, A. M., Deliyannis, C. P., Stephens, A., & King, J. R. 1998, ApJ, 493, 206, doi: 10.1086/305089
-
[7]
Bowen, I. S., & Vaughan, A. H., J. 1973, ApOpt, 12, 1430, doi: 10.1364/AO.12.001430
-
[8]
2018, A&A, 619, A176, doi: 10.1051/0004-6361/201833888
Donati, P. 2018, A&A, 619, A176, doi: 10.1051/0004-6361/201833888
-
[9]
2020, arXiv e-prints, arXiv:2004.07274
Cantat-Gaudin, T., Anders, F., Castro-Ginard, A., et al. 2020, arXiv e-prints, arXiv:2004.07274. https://arxiv.org/abs/2004.07274
Pith/arXiv arXiv 2020
-
[10]
2019, A&A, 623, A80, doi: 10.1051/0004-6361/201834546
Carrera, R., Bragaglia, A., Cantat-Gaudin, T., et al. 2019, A&A, 623, A80, doi: 10.1051/0004-6361/201834546
-
[11]
Casagrande, L., Silva Aguirre, V., Schlesinger, K. J., et al. 2016, MNRAS, 455, 987, doi: 10.1093/mnras/stv2320
-
[12]
1917a, MNRAS, 77, 539, doi: 10.1093/mnras/77.7.539
Chapman, S. 1917a, MNRAS, 77, 539, doi: 10.1093/mnras/77.7.539
-
[13]
1917b, MNRAS, 77, 540, doi: 10.1093/mnras/77.7.540
Chapman, S. 1917b, MNRAS, 77, 540, doi: 10.1093/mnras/77.7.540
-
[14]
2016, ApJ, 823, 102, doi: 10.3847/0004-637X/823/2/102
Choi, J., Dotter, A., Conroy, C., et al. 2016, ApJ, 823, 102, doi: 10.3847/0004-637X/823/2/102
-
[15]
Cunha, K., Smith, V. V., Johnson, J. A., et al. 2015, ApJL, 798, L41, doi: 10.1088/2041-8205/798/2/L41
-
[16]
M., Skrutskie, M
Cutri, R. M., Skrutskie, M. F., van Dyk, S., et al. 2003, 2MASS All Sky Catalog of point sources
2003
-
[17]
Donor, J., Frinchaboy, P. M., Cunha, K., et al. 2018, AJ, 156, 142, doi: 10.3847/1538-3881/aad635
-
[18]
Donor, J., Frinchaboy, P. M., Cunha, K., et al. 2020, AJ, 159, 199, doi: 10.3847/1538-3881/ab77bc
-
[19]
2016, ApJS, 222, 8, doi: 10.3847/0067-0049/222/1/8
Dotter, A. 2016, ApJS, 222, 8, doi: 10.3847/0067-0049/222/1/8
-
[20]
2017, ApJ, 840, 99, doi: 10.3847/1538-4357/aa6d10
Dotter, A., Conroy, C., Cargile, P., & Asplund, M. 2017, ApJ, 840, 99, doi: 10.3847/1538-4357/aa6d10
-
[21]
Eisenstein, D. J., Weinberg, D. H., Agol, E., et al. 2011, AJ, 142, 72, doi: 10.1088/0004-6256/142/3/72
-
[22]
2002, ARA&A, 40, 487, doi: 10.1146/annurev.astro.40.060401.093840
Freeman, K., & Bland-Hawthorn, J. 2002, ARA&A, 40, 487, doi: 10.1146/annurev.astro.40.060401.093840
arXiv 2002
-
[23]
Frinchaboy, P. M., Thompson, B., Jackson, K. M., et al. 2013, ApJL, 777, L1, doi: 10.1088/2041-8205/777/1/L1
-
[24]
Gao, X., Lind, K., Amarsi, A. M., et al. 2018, MNRAS, 481, 2666, doi: 10.1093/mnras/sty2414 20Souto et al. Garc ´ ıa P´ erez, A. E., Allende Prieto, C., Holtzman, J. A., et al. 2016, AJ, 151, 144, doi: 10.3847/0004-6256/151/6/144
-
[25]
2012, The Messenger, 147, 25 Gonz´ alez Hern´ andez, J
Gilmore, G., Randich, S., Asplund, M., et al. 2012, The Messenger, 147, 25 Gonz´ alez Hern´ andez, J. I., & Bonifacio, P. 2009, A&A, 497, 497, doi: 10.1051/0004-6361/200810904
-
[26]
2024, MNRAS, 534, 3005, doi: 10.1093/mnras/stae2209
Grilo, V., Souto, D., Cunha, K., et al. 2024, MNRAS, 534, 3005, doi: 10.1093/mnras/stae2209
-
[27]
Gruyters, P., Korn, A. J., Richard, O., et al. 2013, A&A, 555, A31, doi: 10.1051/0004-6361/201220821
-
[28]
Gruyters, P., Nordlander, T., & Korn, A. J. 2014, A&A, 567, A72, doi: 10.1051/0004-6361/201423590
-
[29]
Gunn, J. E., Siegmund, W. A., Mannery, E. J., et al. 2006, AJ, 131, 2332, doi: 10.1086/500975
doi:10.1086/500975 2006
-
[30]
2008, A&A, 486, 951, doi: 10.1051/0004-6361:200809724
Gustafsson, B., Edvardsson, B., Eriksson, K., et al. 2008, A&A, 486, 951, doi: 10.1051/0004-6361:200809724
-
[31]
Harris, C. R., Millman, K. J., van der Walt, S. J., et al. 2020, Nature, 585, 357, doi: 10.1038/s41586-020-2649-2
-
[32]
R., Sharma, S., Bland-Hawthorn, J., et al
Hayden, M. R., Sharma, S., Bland-Hawthorn, J., et al. 2022, MNRAS, 517, 5325, doi: 10.1093/mnras/stac2787
-
[33]
A., Hasselquist, S., Shetrone, M., et al
Holtzman, J. A., Hasselquist, S., Shetrone, M., et al. 2018, AJ, 156, 125, doi: 10.3847/1538-3881/aad4f9
-
[34]
Hunter, J. D. 2007, Computing in Science & Engineering, 9, 90, doi: 10.1109/MCSE.2007.55 J¨ onsson, H., Holtzman, J. A., Allende Prieto, C., et al. 2020a, AJ, 160, 120, doi: 10.3847/1538-3881/aba592 J¨ onsson, H., Holtzman, J. A., Allende Prieto, C., et al. 2020b, AJ, 160, 120, doi: 10.3847/1538-3881/aba592
-
[35]
Karakas, A. I., & Lattanzio, J. C. 2014, PASA, 31, e030, doi: 10.1017/pasa.2014.21
-
[36]
R., Stephens, A., Boesgaard, A
King, J. R., Stephens, A., Boesgaard, A. M., & Deliyannis, C. 1998, AJ, 115, 666, doi: 10.1086/300209
doi:10.1086/300209 1998
-
[37]
J., Grundahl, F., Richard, O., et al
Korn, A. J., Grundahl, F., Richard, O., et al. 2006, Nature, 442, 657, doi: 10.1038/nature05011
-
[38]
J., Grundahl, F., Richard, O., et al
Korn, A. J., Grundahl, F., Richard, O., et al. 2007, ApJ, 671, 402, doi: 10.1086/523098
doi:10.1086/523098 2007
-
[39]
2012, A&A, 543, A108, doi: 10.1051/0004-6361/201118331
Lagarde, N., Decressin, T., Charbonnel, C., et al. 2012, A&A, 543, A108, doi: 10.1051/0004-6361/201118331
-
[40]
2019, A&A, 627, A117, doi: 10.1051/0004-6361/201935306
Liu, F., Asplund, M., Yong, D., et al. 2019, A&A, 627, A117, doi: 10.1051/0004-6361/201935306
-
[41]
2023, MNRAS, 526, 2378, doi: 10.1093/mnras/stad2896
Loaiza-Tacuri, V., Cunha, K., Souto, D., et al. 2023, MNRAS, 526, 2378, doi: 10.1093/mnras/stad2896
-
[42]
Lum, M. G., & Boesgaard, A. M. 2019, ApJ, 878, 99, doi: 10.3847/1538-4357/ab1c4d
-
[43]
2023, A&A, 669, A119, doi: 10.1051/0004-6361/202244957
Magrini, L., Viscasillas V´ azquez, C., Spina, L., et al. 2023, A&A, 669, A119, doi: 10.1051/0004-6361/202244957
-
[44]
Majewski, S. R., Schiavon, R. P., Frinchaboy, P. M., et al. 2017, AJ, 154, 94, doi: 10.3847/1538-3881/aa784d
-
[45]
L., Sharma, S., Buder, S., et al
Martell, S. L., Sharma, S., Buder, S., et al. 2017, MNRAS, 465, 3203, doi: 10.1093/mnras/stw2835
-
[46]
2016,, Astrophysics Source Code Library, record ascl:1605.004
Masseron, T., Merle, T., & Hawkins, K. 2016,, Astrophysics Source Code Library, record ascl:1605.004
2016
-
[47]
2015, Atomic Diffusion in Stars, doi: 10.1007/978-3-319-19854-5
Michaud, G., Alecian, G., & Richer, J. 2015, Atomic Diffusion in Stars, doi: 10.1007/978-3-319-19854-5
-
[48]
Michaud, G., Richard, O., Richer, J., & VandenBerg, D. A. 2004, ApJ, 606, 452, doi: 10.1086/383001
-
[49]
2022, AJ, 164, 85, doi: 10.3847/1538-3881/ac7ce5
Myers, N., Donor, J., Spoo, T., et al. 2022, AJ, 164, 85, doi: 10.3847/1538-3881/ac7ce5
-
[50]
Nordlander, T., Gruyters, P., Richard, O., & Korn, A. J. 2024, MNRAS, 527, 12120, doi: 10.1093/mnras/stad3973 ¨Onehag, A., Gustafsson, B., & Korn, A. 2014, A&A, 562, A102, doi: 10.1051/0004-6361/201322663
-
[51]
2020, A&A, 637, A80, doi: 10.1051/0004-6361/201937054
Shetrone, M. 2020, A&A, 637, A80, doi: 10.1051/0004-6361/201937054
-
[52]
Otto, J. M., Frinchaboy, P. M., Myers, N. R., et al. 2026, AJ, 171, 91, doi: 10.3847/1538-3881/ae28d8
-
[53]
2011, ApJS, 192, 3, doi: 10.1088/0067-0049/192/1/3
Paxton, B., Bildsten, L., Dotter, A., et al. 2011, ApJS, 192, 3, doi: 10.1088/0067-0049/192/1/3
-
[54]
2013, ApJS, 208, 4, doi: 10.1088/0067-0049/208/1/4
Paxton, B., Cantiello, M., Arras, P., et al. 2013, ApJS, 208, 4, doi: 10.1088/0067-0049/208/1/4
-
[55]
2015, ApJS, 220, 15, doi: 10.1088/0067-0049/220/1/15
Paxton, B., Marchant, P., Schwab, J., et al. 2015, ApJS, 220, 15, doi: 10.1088/0067-0049/220/1/15
-
[56]
2012, http://ascl.net/1205.004
Plez, B. 2012, http://ascl.net/1205.004
2012
-
[57]
Proffitt, C. R., & Michaud, G. 1991, ApJ, 380, 238, doi: 10.1086/170580 Prˇ sa, A., Harmanec, P., Torres, G., et al. 2016, AJ, 152, 41, doi: 10.3847/0004-6256/152/2/41
doi:10.1086/170580 1991
-
[58]
2018, A&A, 612, A99, doi: 10.1051/0004-6361/201731738
Randich, S., Tognelli, E., Jackson, R., et al. 2018, A&A, 612, A99, doi: 10.1051/0004-6361/201731738
-
[59]
Reddy, A. B. S., Giridhar, S., & Lambert, D. L. 2012, MNRAS, 419, 1350, doi: 10.1111/j.1365-2966.2011.19791.x
arXiv 2012
-
[60]
1998, ApJ, 492, 833, doi: 10.1086/305054
Richer, J., Michaud, G., Rogers, F., et al. 1998, ApJ, 492, 833, doi: 10.1086/305054
-
[61]
Santana, F. A., Beaton, R. L., Covey, K. R., et al. 2021, AJ, 162, 303, doi: 10.3847/1538-3881/ac2cbc
-
[62]
2009, ApJ, 698, 1872, doi: 10.1088/0004-637X/698/2/1872 SDSS Collaboration, Adamane Pallathadka, G.,
Sarajedini, A., Dotter, A., & Kirkpatrick, A. 2009, ApJ, 698, 1872, doi: 10.1088/0004-637X/698/2/1872 SDSS Collaboration, Adamane Pallathadka, G.,
-
[63]
Aghakhanloo, M., et al. 2025, arXiv e-prints, arXiv:2507.07093, doi: 10.48550/arXiv.2507.07093 SDSS Collaboration, Aghakhanloo, M., Aird, J., et al. 2026, ApJS, 285, 9, doi: 10.3847/1538-4365/ae4697
-
[64]
2020, A&A, 643, A164, doi: 10.1051/0004-6361/202038833
Semenova, E., Bergemann, M., Deal, M., et al. 2020, A&A, 643, A164, doi: 10.1051/0004-6361/202038833
-
[65]
2024, ApJ, 975, 89, doi: 10.3847/1538-4357/ad78e1 OCCAM IX: Stellar Diffusion using APOGEE DR1721
Sinha, A., Zasowski, G., Frinchaboy, P., et al. 2024, ApJ, 975, 89, doi: 10.3847/1538-4357/ad78e1 OCCAM IX: Stellar Diffusion using APOGEE DR1721
-
[66]
Smith, V. V., Cunha, K., Shetrone, M. D., et al. 2013, ApJ, 765, 16, doi: 10.1088/0004-637X/765/1/16
-
[67]
Soderblom, D. R. 2010, ARA&A, 48, 581, doi: 10.1146/annurev-astro-081309-130806
-
[68]
Souto, D., Cunha, K., & Smith, V. V. 2021, ApJ, 917, 11, doi: 10.3847/1538-4357/abfdb5
-
[69]
2026, ApJL, 1001, L28, doi: 10.3847/2041-8213/ae5b7c
Souto, D., Pascucci, I., Cunha, K., & Kanodia, S. 2026, ApJL, 1001, L28, doi: 10.3847/2041-8213/ae5b7c
-
[71]
2016b, ApJ, 830, 35, doi: 10.3847/0004-637X/830/1/35
Souto, D., Cunha, K., Smith, V., et al. 2016b, ApJ, 830, 35, doi: 10.3847/0004-637X/830/1/35
-
[72]
Souto, D., Cunha, K., Garc ´ ıa-Hern´ andez, D. A., et al. 2017, ApJ, 835, 239, doi: 10.3847/1538-4357/835/2/239
-
[73]
Souto, D., Cunha, K., Smith, V. V., et al. 2018a, ApJ, 857, 14, doi: 10.3847/1538-4357/aab612
-
[74]
Souto, D., Unterborn, C. T., Smith, V. V., et al. 2018b, ApJL, 860, L15, doi: 10.3847/2041-8213/aac896
-
[75]
2019, ApJ, 874, 97, doi: 10.3847/1538-4357/ab0b43
Souto, D., Allende Prieto, C., Cunha, K., et al. 2019, ApJ, 874, 97, doi: 10.3847/1538-4357/ab0b43
-
[76]
Thoul, A. A., Bahcall, J. N., & Loeb, A. 1994, ApJ, 421, 828, doi: 10.1086/173695
doi:10.1086/173695 1994
-
[77]
2010, A&A Rv, 18, 67, doi: 10.1007/s00159-009-0025-1
Torres, G., Andersen, J., & Gim´ enez, A. 2010, A&A Rv, 18, 67, doi: 10.1007/s00159-009-0025-1
-
[78]
VandenBerg, D. A., Bergbusch, P. A., Dotter, A., et al. 2012, ApJ, 755, 15, doi: 10.1088/0004-637X/755/1/15
-
[79]
A., Richard, O., Michaud, G., & Richer, J
VandenBerg, D. A., Richard, O., Michaud, G., & Richer, J. 2002, ApJ, 571, 487, doi: 10.1086/339895
doi:10.1086/339895 2002
-
[80]
Virtanen, P., Gommers, R., Oliphant, T. E., et al. 2020, Nature Methods, 17, 261, doi: 10.1038/s41592-019-0686-2
-
[81]
Wilson, J. C., Hearty, F. R., Skrutskie, M. F., et al. 2019, PASP, 131, 055001, doi: 10.1088/1538-3873/ab0075
discussion (0)
Sign in with ORCID, Apple, or X to comment. Anyone can read and Pith papers without signing in.