Short-term prediction of Electricity Outages Caused by Convective Storms
Pith reviewed 2026-05-25 11:48 UTC · model grok-4.3
The pith
Storm cells isolated by 35 dBZ radar contours can be tracked and classified with machine learning to predict electricity outages hours ahead.
A machine-rendered reading of the paper's core claim, the machinery that carries it, and where it could break.
Core claim
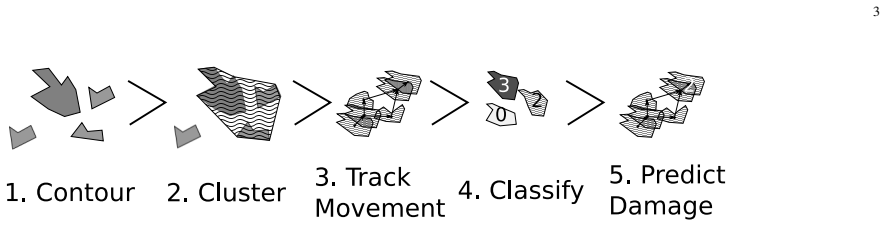
Storm cells identified by contouring CAPPI radar images at a fixed 35 dBZ threshold, tracked over successive scans, and classified by random-forest or deep-neural-network models that combine radar, ground-weather, and lightning features produce short-term forecasts of electricity outages caused by convective storms.
What carries the argument
Storm-cell identification and tracking via 35 dBZ contouring on CAPPI radar images combined with multi-source classification for damage potential.
If this is right
- Grid operators receive forecasts that specify which storm cells are likely to cause outages and when they will arrive.
- The same tracked cells can be reclassified as new radar and lightning observations arrive, updating the outage risk in real time.
- Random-forest and deep-neural-network classifiers can be swapped without changing the upstream contouring and tracking steps.
- The approach operates on data already collected by existing radar, lightning, and weather-station networks.
Where Pith is reading between the lines
- The method could be tested on storms in regions with different radar coverage or vegetation to check whether the 35 dBZ threshold remains effective.
- Adding wind-gust or hail-size estimates from the same radar volume might further separate damaging from non-damaging cells.
- The pipeline could be applied to other infrastructure risks such as transportation delays or communication outages during the same storms.
Load-bearing premise
A single fixed 35 dBZ threshold on radar images isolates precisely the storm cells that damage power lines.
What would settle it
Measure whether the classifier's damage predictions, when run on a fresh set of observed convective storms, match the actual locations and times of recorded power outages at better than random rates.
Figures
read the original abstract
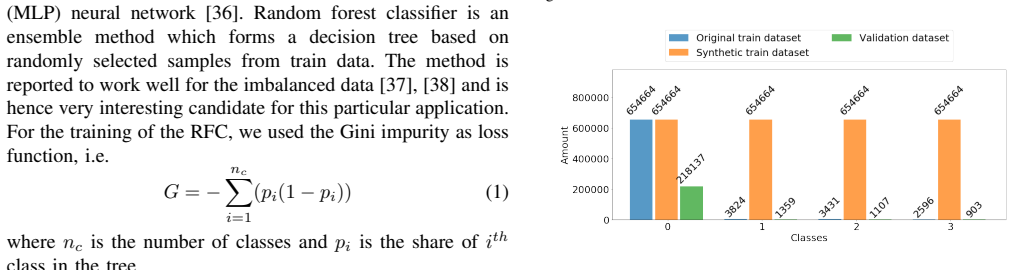
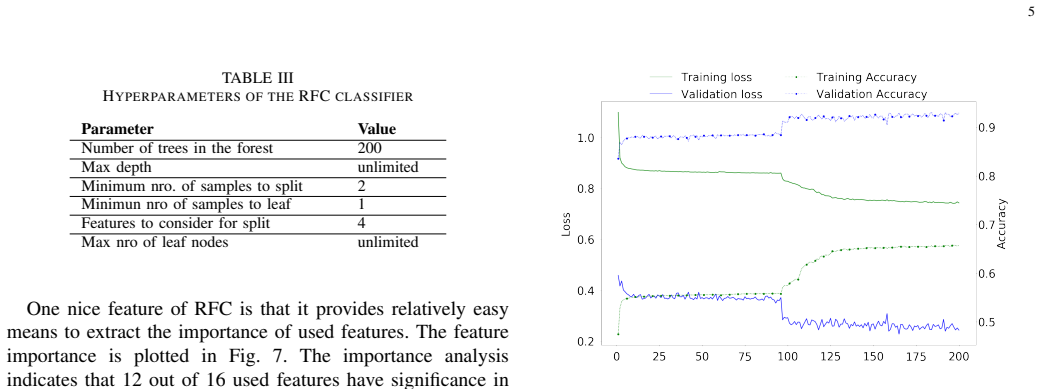
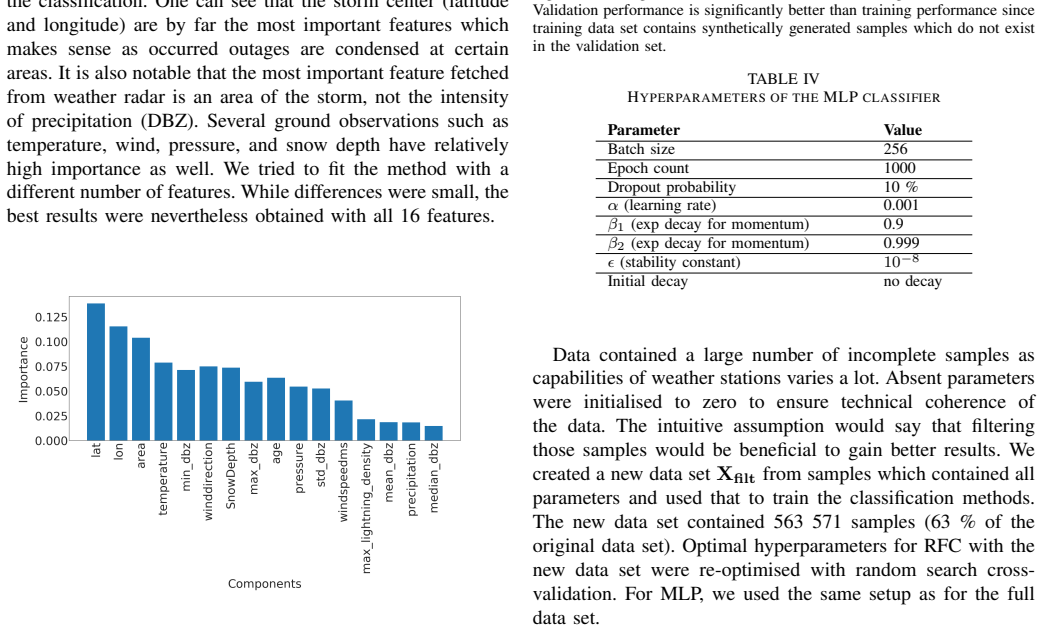
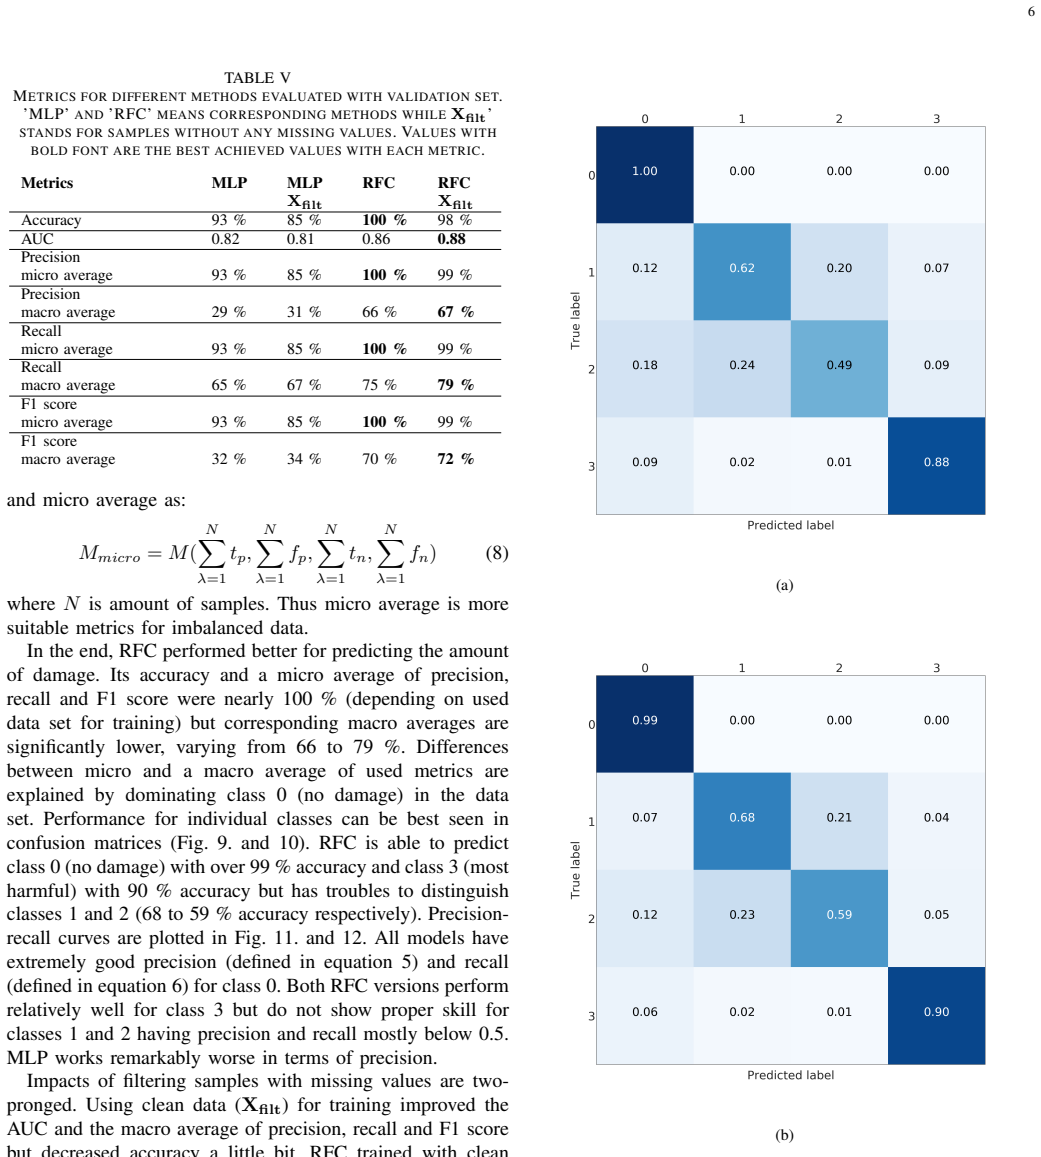
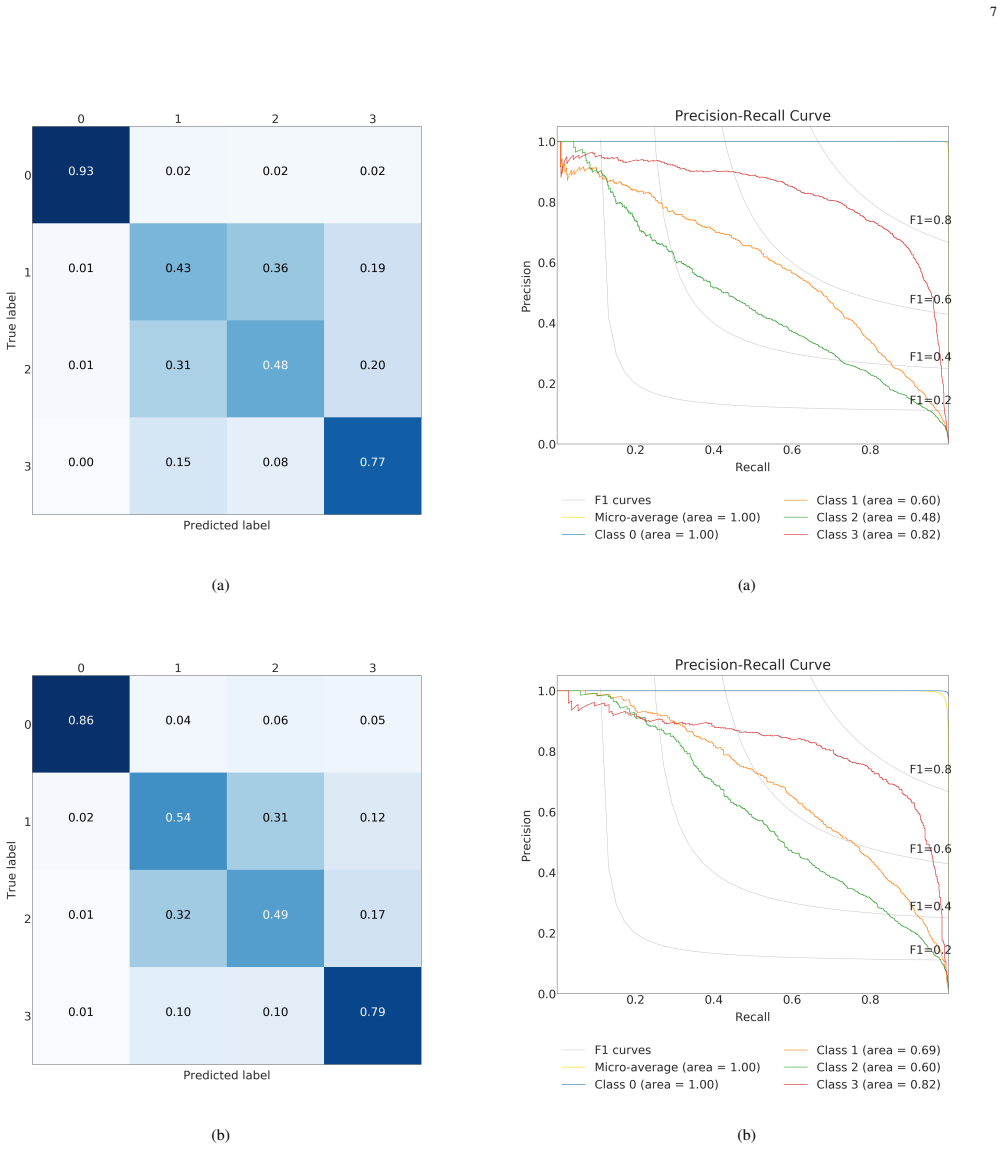
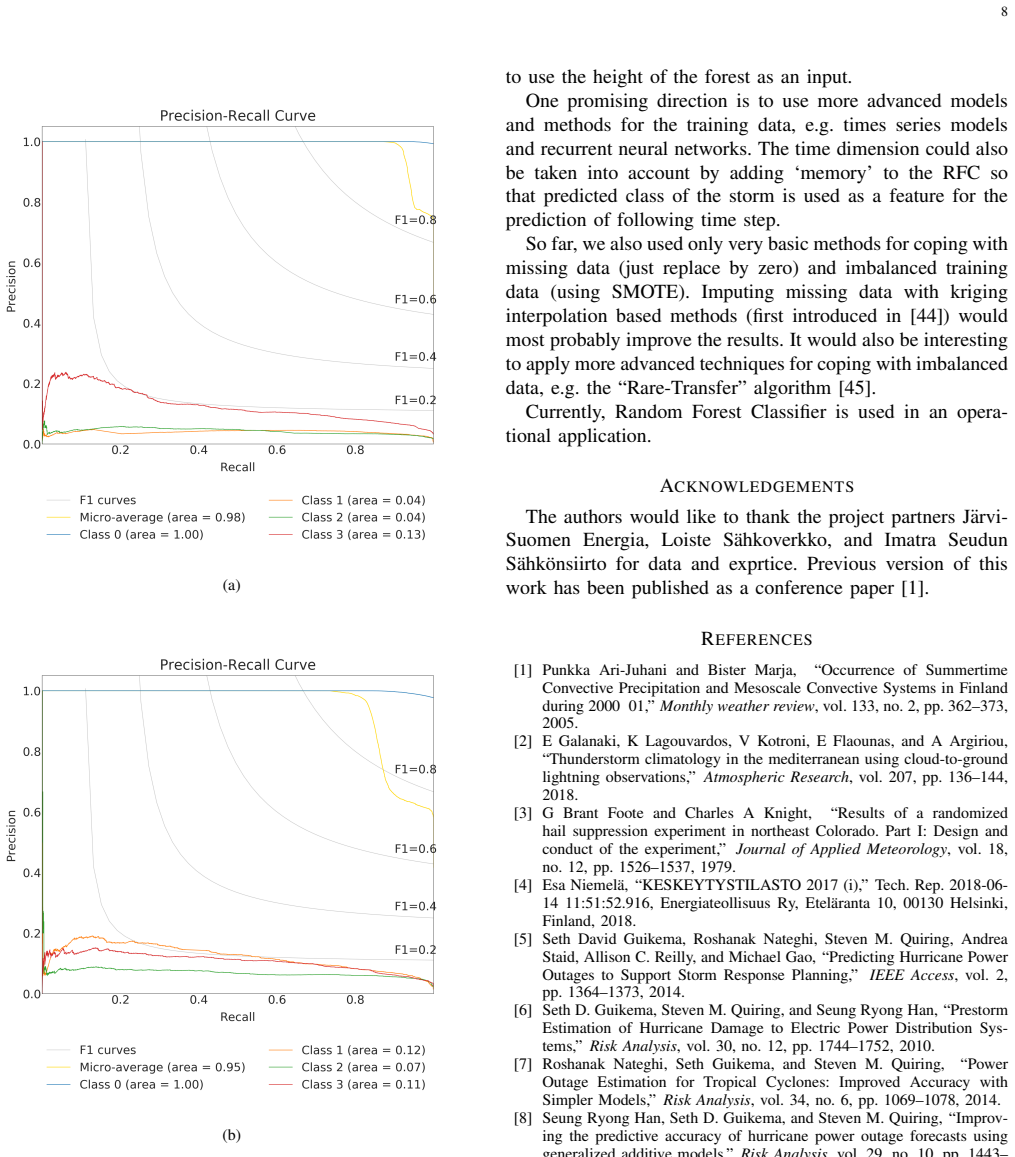
Prediction of power outages caused by convective storms which are highly localised in space and time is of crucial importance to power grid operators. We propose a new machine learning approach to predict the damage caused by storms. This approach hinges identifying and tracking of storm cells using weather radar images on the application of machine learning techniques. Overall prediction process consists of identifying storm cells from CAPPI weather radar images by contouring them with a solid 35 dBZ threshold, predicting a track of storm cells and classifying them based on their damage potential to power grid operators. Tracked storm cells are then classified by combining data obtained from weather radar, ground weather observations and lightning detectors. We compare random forest classifiers and deep neural networks as alternative methods to classify storm cells. The main challenge is that the training data are heavily imbalanced as extreme weather events are rare.
Editorial analysis
A structured set of objections, weighed in public.
Referee Report
Summary. The manuscript proposes a machine learning pipeline for short-term prediction of electricity outages from convective storms. Storm cells are identified by contouring CAPPI radar images at a fixed 35 dBZ threshold, their tracks are predicted, and damage potential is classified using random forest or deep neural network models that fuse radar, ground weather observations, and lightning data. The primary noted challenge is severe class imbalance in the training data due to the rarity of extreme events.
Significance. If the pipeline can be validated with appropriate metrics and threshold sensitivity, the approach could provide grid operators with actionable localized forecasts by combining multiple independent data streams. The explicit comparison between random forest and deep neural network classifiers is a positive design choice, and the focus on an operationally relevant problem (power outages) adds potential impact. However, the absence of any reported results, validation details, or imbalance-handling methods prevents evaluation of whether the method delivers useful predictions.
major comments (3)
- [Abstract] Abstract: the central claim that the described pipeline 'enables short-term prediction' cannot be assessed because the abstract supplies no performance numbers, validation procedure, baseline comparisons, or quantitative results from the RF or DNN classifiers.
- [Abstract] Abstract: the fixed 35 dBZ contouring step is presented without justification, sensitivity analysis, or comparison to alternative thresholds, yet this choice directly determines which cells enter the tracking and classification stages and is therefore load-bearing for the claimed isolation of damage-causing storms.
- [Abstract] Abstract: although the text identifies severe class imbalance as the main challenge, it provides no description of balancing techniques, cost-sensitive losses, or metrics (e.g., precision-recall AUC) that would demonstrate the classifiers remain informative rather than defaulting to the majority class.
Simulated Author's Rebuttal
We thank the referee for the constructive feedback on our manuscript. We address each of the three major comments on the abstract below and indicate planned revisions to improve clarity and completeness.
read point-by-point responses
-
Referee: [Abstract] Abstract: the central claim that the described pipeline 'enables short-term prediction' cannot be assessed because the abstract supplies no performance numbers, validation procedure, baseline comparisons, or quantitative results from the RF or DNN classifiers.
Authors: We agree that the abstract would benefit from quantitative support for the central claim. In the revised manuscript we will add concise statements of the key performance metrics (including PR-AUC for both classifiers), the validation approach, and a brief note on the comparison between random forest and neural-network results. revision: yes
-
Referee: [Abstract] Abstract: the fixed 35 dBZ contouring step is presented without justification, sensitivity analysis, or comparison to alternative thresholds, yet this choice directly determines which cells enter the tracking and classification stages and is therefore load-bearing for the claimed isolation of damage-causing storms.
Authors: The 35 dBZ threshold follows common practice for convective-cell detection, yet we accept that the abstract should supply a short justification. The revision will include a one-sentence rationale and a reference to the threshold-sensitivity experiments reported in the methods section. revision: yes
-
Referee: [Abstract] Abstract: although the text identifies severe class imbalance as the main challenge, it provides no description of balancing techniques, cost-sensitive losses, or metrics (e.g., precision-recall AUC) that would demonstrate the classifiers remain informative rather than defaulting to the majority class.
Authors: We concur that the abstract should indicate how class imbalance was addressed. The revised abstract will note the use of class-weighted training and the adoption of precision-recall AUC as the primary evaluation metric. revision: yes
Circularity Check
No circularity; method uses independent external data streams
full rationale
The paper describes an empirical ML pipeline: contouring CAPPI radar at a fixed 35 dBZ threshold to identify cells, track them, then classify damage potential via RF/DNN on combined radar/lightning/ground data. No equations, fitted parameters renamed as predictions, or self-citation chains appear in the provided text. The 35 dBZ choice and imbalance handling are methodological decisions (potentially weak, as noted by the skeptic), but they do not reduce any claimed prediction to the input by construction. The derivation chain is therefore self-contained against external benchmarks and receives the default non-circularity finding.
Axiom & Free-Parameter Ledger
free parameters (1)
- 35 dBZ threshold
axioms (1)
- domain assumption Storm cells identified by radar reflectivity above 35 dBZ are the primary entities whose tracks determine power-grid damage potential
Reference graph
Works this paper leans on
-
[1]
Punkka Ari-Juhani and Bister Marja, “Occurrence of Summertime Convective Precipitation and Mesoscale Convective Systems in Finland during 2000 01,” Monthly weather review, vol. 133, no. 2, pp. 362–373, 2005
work page 2000
-
[2]
Thunderstorm climatology in the mediterranean using cloud-to-ground lightning observations,
E Galanaki, K Lagouvardos, V Kotroni, E Flaounas, and A Argiriou, “Thunderstorm climatology in the mediterranean using cloud-to-ground lightning observations,” Atmospheric Research, vol. 207, pp. 136–144, 2018
work page 2018
-
[3]
G Brant Foote and Charles A Knight, “Results of a randomized hail suppression experiment in northeast Colorado. Part I: Design and conduct of the experiment,” Journal of Applied Meteorology , vol. 18, no. 12, pp. 1526–1537, 1979
work page 1979
-
[4]
Esa Niemel ¨a, “KESKEYTYSTILASTO 2017 (i),” Tech. Rep. 2018-06- 14 11:51:52.916, Energiateollisuus Ry, Etel ¨aranta 10, 00130 Helsinki, Finland, 2018
work page 2017
-
[5]
Predicting Hurricane Power Outages to Support Storm Response Planning,
Seth David Guikema, Roshanak Nateghi, Steven M. Quiring, Andrea Staid, Allison C. Reilly, and Michael Gao, “Predicting Hurricane Power Outages to Support Storm Response Planning,” IEEE Access , vol. 2, pp. 1364–1373, 2014
work page 2014
-
[6]
Prestorm Estimation of Hurricane Damage to Electric Power Distribution Sys- tems,
Seth D. Guikema, Steven M. Quiring, and Seung Ryong Han, “Prestorm Estimation of Hurricane Damage to Electric Power Distribution Sys- tems,” Risk Analysis, vol. 30, no. 12, pp. 1744–1752, 2010
work page 2010
-
[7]
Power Outage Estimation for Tropical Cyclones: Improved Accuracy with Simpler Models,
Roshanak Nateghi, Seth Guikema, and Steven M. Quiring, “Power Outage Estimation for Tropical Cyclones: Improved Accuracy with Simpler Models,” Risk Analysis, vol. 34, no. 6, pp. 1069–1078, 2014
work page 2014
-
[8]
Seung Ryong Han, Seth D. Guikema, and Steven M. Quiring, “Improv- ing the predictive accuracy of hurricane power outage forecasts using generalized additive models,” Risk Analysis, vol. 29, no. 10, pp. 1443– 1453, 2009
work page 2009
-
[9]
A Bayesian network model for prediction of weather-related failures in railway turnout systems,
Guang Wang, Tianhua Xu, Tao Tang, Tangming Yuan, and Haifeng Wang, “A Bayesian network model for prediction of weather-related failures in railway turnout systems,” Expert Systems with Applications , vol. 69, pp. 247–256, 2017
work page 2017
-
[10]
Application of hybrid geo-spatially granular fragility curves to improve power outage predictions,
M Allen, S Fernandez, O Omitaomu, and K Walker, “Application of hybrid geo-spatially granular fragility curves to improve power outage predictions,” Journal of Geography & Natural Disasters , vol. 4, no. 2, pp. 1–6, 2014
work page 2014
-
[11]
Fuzzy logic approach to predictive risk analysis in distribution outage management,
Po-Chen Chen and Mladen Kezunovic, “Fuzzy logic approach to predictive risk analysis in distribution outage management,” IEEE Transactions on Smart Grid , vol. 7, no. 6, pp. 2827–2836, 2016
work page 2016
-
[12]
Nonparametric Tree- Based Predictive Modeling of Storm Outages on an Electric Distribution Network,
Jichao He, David W. Wanik, Brian M. Hartman, Emmanouil N. Anag- nostou, Marina Astitha, and Maria E.B. Frediani, “Nonparametric Tree- Based Predictive Modeling of Storm Outages on an Electric Distribution Network,” Risk Analysis, vol. 37, no. 3, pp. 441–458, 2017. 9
work page 2017
-
[13]
Scene Classification Based on Multiscale Convolutional Neural Network,
Yanfei Liu, Yanfei Zhong, and Qianqing Qin, “Scene Classification Based on Multiscale Convolutional Neural Network,”IEEE Transactions on Geoscience and Remote Sensing , vol. 56, no. 12, pp. 7109 – 7121, 7 2018
work page 2018
-
[14]
Spatio- temporal forecasting of weather-driven damage in a distribution system,
Zhiguo Li, Amith Singhee, Haijing Wang, Abhishek Raman, Stuart Siegel, Fook-Luen Heng, Richard Mueller, and Gerard Labut, “Spatio- temporal forecasting of weather-driven damage in a distribution system,” in 2015 IEEE Power & Energy Society General Meeting . IEEE, 2015, pp. 1–5
work page 2015
-
[15]
Probabilistic forecasts of service outage counts from severe weather in a distribution grid,
Amith Singhee and Haijing Wang, “Probabilistic forecasts of service outage counts from severe weather in a distribution grid,” in 2017 IEEE Power & Energy Society General Meeting . IEEE, 2017, pp. 1–5
work page 2017
-
[16]
Predictive modeling of thunderstorm-related power outages,
Stephen Shield et al., “Predictive modeling of thunderstorm-related power outages,” M.S. thesis, The Ohio State University, 2018
work page 2018
-
[17]
Modeling weather- related failures of overhead distribution lines,
Yujia Zhou, Anil Pahwa, and Shie Shien Yang, “Modeling weather- related failures of overhead distribution lines,” IEEE Transactions on Power Systems, vol. 21, no. 4, pp. 1683–1690, 2006
work page 2006
-
[18]
Regression models for outages due to wind and lightning on overhead distribution feeders,
P Kankanala, A Pahwa, and S Das, “Regression models for outages due to wind and lightning on overhead distribution feeders,” in Power and Energy Society General Meeting, 2011 IEEE . IEEE, 2011, pp. 1–4
work page 2011
-
[19]
Padmavathy Kankanala, Anil Pahwa, and Sanjoy Das, “Estimation of Overhead Distribution System Outages Caused by Wind and Lightning Using an Artificial Neural Network,” in International Conference on Power System Operation & Planning , 2012
work page 2012
-
[20]
Padmavathy Kankanala, Sanjoy Das, and Anil Pahwa, “AdaBoost +: An Ensemble Learning Approach for Estimating Weather-Related Outages in Distribution Systems,” IEEE Transactions on Power Systems, vol. 29, no. 1, pp. 359–367, 2014
work page 2014
-
[21]
Meng Yue, Tami Toto, Michael P. Jensen, Scott E. Giangrande, and Robert Lofaro, “A Bayesian approach-based outage prediction in electric utility systems using radar measurement data,” IEEE Transactions on Smart Grid, vol. 9, no. 6, pp. 6149–6159, 2018
work page 2018
-
[22]
An empirical model for assessing the severe weather potential of developing convection,
John L Cintineo, Michael J Pavolonis, Justin M Sieglaff, and Daniel T Lindsey, “An empirical model for assessing the severe weather potential of developing convection,” Weather and Forecasting, vol. 29, no. 3, pp. 639–653, 2014
work page 2014
-
[23]
thesis, Aalto University, 2015
Pekka Juhana Rossi, Object-Oriented Analysis and Nowcasting of Convective Storms in Finland , Ph.D. thesis, Aalto University, 2015
work page 2015
-
[24]
Simulating wet snow loads on power line cables by a simple model,
Lasse Makkonen and Bodo Wichura, “Simulating wet snow loads on power line cables by a simple model,” Cold Regions Science and Technology, vol. 61, no. 2-3, pp. 73–81, 2010
work page 2010
-
[25]
Real-time hazard approximation of long-lasting convective storms using emergency data,
Pekka J. Rossi, Vesa Hasu, Kalle Halmevaara, Antti m?? Kel??, Jarmo Koistinen, and Heikki Pohjola, “Real-time hazard approximation of long-lasting convective storms using emergency data,” Journal of Atmospheric and Oceanic Technology, vol. 30, no. 3, pp. 538–555, 2013
work page 2013
-
[26]
TITAN: Thunderstorm Identifica- tion, Tracking, Analysis, and NowcastingA Radar-based Methodology,
Michael Dixon and Gerry Wiener, “TITAN: Thunderstorm Identifica- tion, Tracking, Analysis, and NowcastingA Radar-based Methodology,” Journal of Atmospheric and Oceanic Technology , vol. 10, no. 6, pp. 785–797, 1993
work page 1993
-
[27]
Computer vision methods for anomaly removal,
Markus Peura, “Computer vision methods for anomaly removal,” Second European Conference on Radar Meteorology (ERAD02) , pp. 312–317, 2002
work page 2002
-
[28]
Density-based clustering in spatial databases: The algorithm gdbscan and its applications,
J ¨org Sander, Martin Ester, Hans-Peter Kriegel, and Xiaowei Xu, “Density-based clustering in spatial databases: The algorithm gdbscan and its applications,” Data mining and knowledge discovery , vol. 2, no. 2, pp. 169–194, 1998
work page 1998
-
[29]
A density-based algorithm for discovering clusters in large spatial databases with noise.,
Martin Ester, Hans-Peter Kriegel, J ¨org Sander, Xiaowei Xu, and others, “A density-based algorithm for discovering clusters in large spatial databases with noise.,” in KDD-96 Proceedings , 1996, vol. 96, pp. 226–231
work page 1996
-
[30]
Kalman filtering-based probabilistic nowcasting of object-oriented tracked convective storms,
Pekka J. Rossi, V . Chandrasekar, Vesa Hasu, and Dmitri Moisseev, “Kalman filtering-based probabilistic nowcasting of object-oriented tracked convective storms,” Journal of Atmospheric and Oceanic Technology, vol. 32, no. 3, pp. 461–477, 2015
work page 2015
-
[31]
A clustering-based tracking method for convective cell identification and analysis,
Pekka Rossi and M ¨akel¨a Antti, “A clustering-based tracking method for convective cell identification and analysis,” Fith European Conference on Radar in Meteorology and Hydrology , 2008
work page 2008
-
[32]
Berthold K P Horn and Brian G Schunck, “Determining optical flow,” Artificial intelligence, vol. 17, no. 1-3, pp. 185–203, 1981
work page 1981
-
[33]
Pyramidal implementation of the affine lucas kanade feature tracker description of the algorithm,
Jean-Yves Bouguet, “Pyramidal implementation of the affine lucas kanade feature tracker description of the algorithm,” Intel Corporation, vol. 5, no. 1-10, pp. 4, 2001
work page 2001
-
[34]
Pekka J Rossi, Vesa Hasu, Jarmo Koistinen, Dmitri Moisseev, Antti M¨akel¨a, and Elena Saltikoff, “Analysis of a statistically initialized fuzzy logic scheme for classifying the severity of convective storms in Finland,” Meteorological Applications, vol. 21, no. 3, pp. 656–674, 2014
work page 2014
-
[35]
Leo Breiman, “Random forests,” Machine learning, vol. 45, no. 1, pp. 5–32, 2001
work page 2001
-
[36]
Ian Goodfellow, Yoshua Bengio, and Aaron Courville, “Deep Learning,” in Deep Learning, pp. 164–223. MIT Press, 2016
work page 2016
-
[37]
An empirical study of learning from imbalanced data,
Xiuzhen Zhang and Yuxuan Li, “An empirical study of learning from imbalanced data,” Conferences in Research and Practice in Information Technology Series, vol. 115, pp. 85–94, 2011
work page 2011
-
[38]
Random forest classifier for remote sensing classification,
M. Pal, “Random forest classifier for remote sensing classification,” International Journal of Remote Sensing , vol. 26, no. 1, pp. 217–222, 2005
work page 2005
-
[39]
Ian Goodfellow, Yoshua Bengio, and Aaron Courville, “Deep Learning,” in Deep Learning, pp. 255–265. MIT Press, 2016
work page 2016
-
[40]
SMOTE: synthetic minority over-sampling technique,
Nitesh V Chawla, Kevin W Bowyer, Lawrence O Hall, and W Philip Kegelmeyer, “SMOTE: synthetic minority over-sampling technique,” Journal of artificial intelligence research , vol. 16, pp. 321–357, 2002
work page 2002
-
[41]
Random search for hyper- parameter optimization,
James Bergstra and Yoshua Bengio, “Random search for hyper- parameter optimization,” Journal of Machine Learning Research , vol. 13, no. Feb, pp. 281–305, 2012
work page 2012
-
[42]
Adam: A Method for Stochastic Optimization,
Diederik P Kingma and Jimmy Ba, “Adam: A Method for Stochastic Optimization,” in 3rd International Conference in Learning Represen- tations, San Diego, 2015
work page 2015
-
[43]
Grigorios Tsoumakas, Ioannis Katakis, and Ioannis Vlahavas, “Mining multi-label data,” in Data mining and knowledge discovery handbook , pp. 667–685. Springer, 2009
work page 2009
-
[44]
Georges Matheron, “Principles of geostatistics,” Economic geology, vol. 58, no. 8, pp. 1246–1266, 1963
work page 1963
-
[45]
Transfer learning for class imbalance problems with inadequate data,
Samir Al-Stouhi and Chandan K Reddy, “Transfer learning for class imbalance problems with inadequate data,” Knowledge and information systems, vol. 48, no. 1, pp. 201–228, 2016. Roope Tervo is a part-time Ph.D. student at Aalto University in Machine Learning Group with the main interest in impact analysis of the weather. The ultimate goal of his studies i...
work page 2016
discussion (0)
Sign in with ORCID, Apple, or X to comment. Anyone can read and Pith papers without signing in.