REVIEW 5 major objections 8 minor 49 references
Unveiling and Steering Connectome Organization with Interpretable Latent Variables
T0 review · 5 major / 8 minor · reviewed 2026-08-15 · deepseek-v4-flash
Pith's one-line read The paper argues that a compact set of latent variables can both encode and controllably steer the structure of fruit fly connectome subgraphs.
desk verdict A credible engineering pipeline for interpretable connectome latent spaces, but the 'predefined properties' claim only holds for edge count—still worth a serious referee. read the letter →
The pith
A machine-rendered reading of the paper's core claim, the machinery that carries it, and where it could break.
The reading
What carries the argument
The central machinery is the combination of an information-bottleneck variational autoencoder with a SHAP-based explainability module. The encoder uses multi-head graph attention networks to embed the directed adjacency matrix, concatenates these edge embeddings with one-hot node-type features, and maps them to a low-dimensional Gaussian latent $z$; the decoder reconstructs the adjacency matrix and node categories from $z$. A differentiable surrogate model approximates each graph statistic so that SHAP values can attribute the statistics to latent dimensions, and the additive property of SHAP values turns the task of hitting a target statistic into a knapsack-like dynamic programming problem. This pipeline is what carries the argument from "the latent space reconstructs the data" to "the latent space can be steered."
What would settle it
Train the same VAE and SHAP pipeline on 100-neuron subgraphs sampled randomly within the visual region without aligning to the visual-stream axis; if the set of influential latent dimensions and their mappings to edge count, reciprocity, betweenness, and non-neuronal ratio do not persist, the claimed organizational principles are an artifact of the cylindrical sampling. A second check is to compare subgraphs generated by the steering procedure against anatomically identified columnar units in the FlyWire dataset to see whether the controlled generations match real functional columns.
Extended reading notes
Core claim
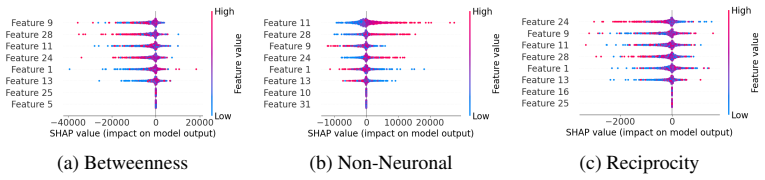
On the paper's own terms, the discovery is that connectome subgraphs from the fly visual system can be compressed into low-dimensional latent codes that preserve essential topology, and that individual latent dimensions are interpretably tied to measurable structural statistics. Using a VAE with an information bottleneck, the model reconstructs both the adjacency structure and the neurotransmitter-type labels of padded 100-node subgraphs, and SHAP analysis shows that a handful of dimensions (notably dimensions 1, 9, 11, 13, 24, and 28) dominate four structural readouts: edge count, reciprocity, betweenness, and non-neuronal ratio. The paper then demonstrates that manipulating these dimensions through SHAP-guided dynamic programming or CMA-ES produces graphs whose statistics move toward the requested targets, with an AUC of 0.919 when the full target graph is available and 0.852 when only its statistics are used.
Load-bearing premise
The load-bearing assumption is that the cylinder-sampled subgraphs are functionally meaningful columnar units of the fly visual system; if the sampling is arbitrary or biased, the learned latent variables and their apparent ties to structural features could reflect sampling artifacts rather than genuine brain organization.
Editorial extensions
If this is right
- If the claim holds, local connectome structure can be analyzed and compared through compact latent codes rather than through full graph statistics, making cross-region and cross-species comparisons tractable.
- The identified steering dimensions provide a direct way to test causal hypotheses: generate subgraphs with perturbed statistics and probe how those perturbations affect circuit function.
- The same pipeline can be applied to other whole-brain connectomes as they are mapped, to test whether low-dimensional organizational principles generalize beyond the fly.
- Controlled subgraph generation could supply synthetic neural-network training data with specified topology, bridging connectomics and artificial neural network design.
- The reconstruction metrics quantify how much information survives the bottleneck, giving an empirical bound on the compressibility of local connectome structure.
Reading between the lines
- My inference: the cylindrical sampling assumption could be tested directly by training the same VAE on randomly selected 100-neuron subgraphs that ignore the visual-stream axis; if the influential latent dimensions change, the discovered principles are sampling artifacts rather than columnar biology.
- My inference: the genetic-bottleneck framing suggests a quantitative prediction the paper does not make: the information content of the six influential dimensions should scale sublinearly with subgraph neuron count, and measuring that scaling across subgraph sizes would test whether the bottleneck truly mirrors genome-scale compression.
- My inference: because the SHAP-guided DP search treats dimensions additively, explicitly modeling pairwise interactions between the six influential dimensions could either improve steering accuracy or reveal that the paper's linear attribution masks coupled effects.
- My inference: if the same six dimensions control the same statistics in other brain regions of the fly, that would support a universal "wiring code" rather than region-specific organization; this is a natural transfer experiment the paper does not run.
Signed reviews
Editorial analysis
A structured set of objections, weighed in public.
Referee Report
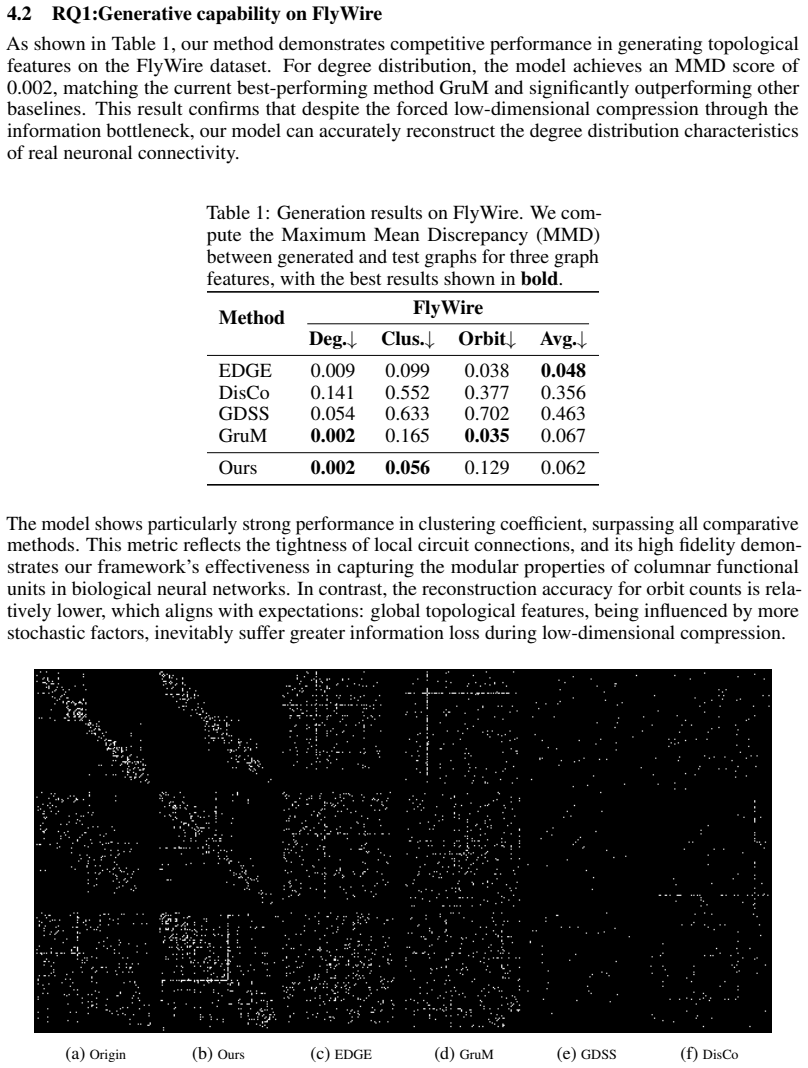
Summary. This manuscript proposes an end-to-end framework, applied to the FlyWire Drosophila connectome, for learning interpretable low-dimensional representations of neural-circuit subgraphs and using those codes for controlled graph generation. The pipeline consists of (i) adaptive cylindrical sampling of 81-100-neuron subgraphs along the visual-stream axis, padded to 100 nodes; (ii) a graph VAE with a GAT-based edge encoder, a latent bottleneck, and a staged '1+2n' training protocol; (iii) a differentiable surrogate per graph statistic (edge count, reciprocity, betweenness, non-neuronal count) that enables SHAP attribution of latent dimensions; and (iv) two steering mechanisms, a SHAP-guided dynamic program (Algorithm 1) and CMA-ES. The experiments report competitive graph-generation MMD versus EDGE, DisCo, GDSS, and GruM; surrogate correlations between 0.92 and 0.998; a monotonic DP steering curve for edge count; and AUC of 0.919/0.852 in RQ3 when generating a target graph from full versus statistical information. Appendix H concedes that DP 'yields suboptimal results' for the other three statistics, attributing this to coupling between dimensions.
Significance. If the results hold, the framework is a novel and potentially useful combination of connectomics subgraph sampling, information-bottleneck representation learning, and SHAP-based white-box steering, and several parts of the manuscript are genuine strengths: the surrogate is validated against the ground-truth statistics of decoded graphs rather than only against its own training target, the experiments use the real FlyWire dataset, and the authors candidly report where DP fails. That candor, however, reveals that the headline claim--'controllably generate connectome subgraphs with predefined properties'--is demonstrated for one of four statistics via DP, while the complementary CMA-ES experiments lack baselines and variance estimates. The contribution to connectomics is also conditional on the unvalidated assumption that the cylinder-sampled subgraphs correspond to functionally meaningful columnar units. With a narrowed central claim, added statistical support, and validation of the steering assumptions, this could be a solid contribution to interpretable graph representation learning; in its current form the abstract overstates the demonstrated capability.
major comments (5)
- [Abstract; Sec. 4.3; Appendix H] The manuscript's central load-bearing claim, stated in the abstract and conclusion, is that latent codes can be manipulated to 'controllably generate connectome subgraphs with predefined properties.' Appendix H reports that for reciprocity, betweenness, and non-neuronal count, dynamic programming 'yields suboptimal results,' so the DP-based controlled generation is demonstrated only for edge count (Figure 3c). The CMA-ES experiments in Sec. 4.4 report AUC of 0.919 and 0.852, but with no baselines, no comparison against optimizing latent vectors in a non-interpretable space of equal dimension, and no per-seed variability; they therefore cannot carry the full weight of the 'predefined properties' claim. The claims should be narrowed accordingly, or the missing baselines and variance information should be supplied.
- [Sec. 3.5, Algorithm 1; Appendix E] Algorithm 1 assumes a global additive decomposition of each target statistic in terms of per-dimension SHAP values, expressed by the transition dp[i][j + shap[i][k]] <- k. SHAP values are local attributions: the efficiency property in Eq. (24) holds at a single input point and does not license treating shap[i][k] as a coordinate-independent contribution of setting z_i = k. The paper never tests this additivity assumption, and Appendix H's own diagnosis--that coupling between dimensions induces excessive variance in SHAP values--is direct internal evidence that the assumption fails for three of four statistics. The authors should either establish conditions under which Algorithm 1 is valid, validate additivity for the statistics it is applied to, or replace the DP with a steering method that accounts for interactions.
- [Sec. 4.1; Tables 1-2; Sec. 4.4] No reported metric carries an error bar, confidence interval, or significance test. Table 1 supports comparative statements ('matching' GruM on degree MMD, 'particularly strong performance in clustering coefficient'), yet each cell appears to be a single value, and the baseline procedure of 'selecting the best-performing configuration' from 10 random hyperparameter samples is not an acceptable substitute for a repeated-seed protocol with reported variability. The surrogate correlations in Table 2 motivate the entire SHAP analysis; for reciprocity (0.9192) and betweenness (0.9622) the unexplained variance is substantial enough to matter for the downstream steering failure, so confidence intervals should be reported here as well.
- [Sec. 3.1; Appendix D, Eq. (21)] The biological claims of the paper depend on the assertion that cylindrical sampling 'captures columnar functional units characteristic of neural circuitry,' but this is not validated: there is no comparison with anatomically defined columnar units, no sensitivity analysis for the cylinder radius or the 81-100 neuron window, and the centers are drawn randomly in the XZ-plane. Relatedly, the 'non-neuronal' count used as a target statistic is, by the paper's own definition in Eq. (21), the number of padding nodes introduced to standardize variable-size subgraphs to 100 nodes; it is an artifact of the sampling protocol rather than a structural property of the circuit. This should be acknowledged when the paper claims that latent dimensions 'govern important structural properties' of neural circuits.
- [Sec. 4.3] The RQ2 analysis is internally inconsistent about its principal result: the text identifies six influential dimensions (1, 9, 11, 13, 24, and 28) and two sentences later refers to 'these 8 key dimensions.' Moreover, the paper provides no quantitative criterion for declaring a dimension 'key' (no |SHAP| threshold, no permutation or ablation test), so the claim that a few dimensions govern structural properties is not precisely defined. The number, identity, and selection rule for key dimensions should be stated consistently and justified.
minor comments (8)
- [References] The reference list contains exact-duplicate entries: [7] and [8] (Chen et al., 2023), [18] and [19] (Hou et al., 2024), [30] and [31] (Loshchilov and Hutter, 2016), and [50] and [51] (Xu et al., 2024); these should be merged.
- [Appendix D, Eq. (18)] The reciprocity definition is internally inconsistent: the left-hand side sum_{i<j} A_ij A_ji / sum_{i!=j} A_ij (1 - A_ji) equals (number of mutual pairs)/(total edges - 2*(mutual pairs)), whereas the right-hand side tr(A^2)/(||A||_0 - tr(A^2)) equals 2*(mutual pairs)/(total edges - 2*(mutual pairs)); the numerator differs by a factor of two, and the 1000x scaling mentioned in the appendix is not defined in the main text.
- [Appendix I] The text 'Figure 3 demonstrates our model's graph reconstruction capability' is a mis-reference: Figure 3 shows SHAP and DP results for edge count, while the reconstruction panels are Figure 9.
- [Sec. 4.1; Algorithm 1] Several quantities needed to reproduce the experiments are missing: the latent dimensionality d used in the main runs (Appendix G sweeps 4-32), the binarization threshold kappa, the DP bounds l and r, the discretization of the target statistic y, and the distribution whose standard deviation sigma is used to set the search range in Algorithm 1; the phrase 'possible eigen value bounds (l <= lambda <= r)' does not match the latent variable notation used elsewhere.
- [Appendix B, Eq. (8)] The opening equality of the VAE derivation, log p(x;theta) = integral of q(z|x) log p(x) dz, is incorrect as written (for normalized q the integral equals log p(x)), and the rest of the derivation would benefit from a clean restatement.
- [Sec. 3.3] The training-loss notation is inconsistent: L1, Lrec_2, Lkl_2, and L3 = Ledge_rec_3 + Lnode_rec_3 + Lkl_3 are introduced without defining the three components of L3; this should be aligned across Sec. 3.3 and Appendix F.
- [Author affiliations] The affiliation line contains 'Sichuang, China,' which appears to be a typo for 'Sichuan, China.'
- [Appendix I] Appendix I itself notes that the reconstruction results 'would benefit from comparison with standard reconstruction baselines in future work'; because the decoder's output distribution feeds all downstream SHAP and steering analyses, this missing comparison should be acknowledged as a limitation in the main text as well.
Circularity Check
No significant circularity; the controlled-generation claim is overbroad relative to the evidence, but no derivation reduces to its own inputs.
full rationale
The paper's pipeline is a self-contained learning system: subgraphs are sampled from FlyWire and padded, a VAE is trained to reconstruct them, four surrogate regressors are fitted to ground-truth statistics of decoded graphs, SHAP values are computed on the surrogate, and DP or CMA-ES searches latent codes for target statistics. No equation defines a target quantity in terms of the claimed conclusion. The surrogate Pearson correlations in Table 2 are fit-quality diagnostics, not predictions, and the paper explicitly says ground-truth statistics rather than surrogate outputs are used for the final analysis. The SHAP-DP route is an optimization: SHAP values serve as knapsack coefficients, and the reported achieved statistic comes from the decoded graph, so the monotonic edge-count curve in Figure 3c is an empirical result rather than an identity. Appendix H even states that DP 'yields suboptimal results' for reciprocity, betweenness, and non-neuronal, which would be impossible if the result were tautological. The 'genetic bottleneck' is motivational and does not enter any derivation. The one self-citation, reference [6] in the introduction, is a general background citation for 'structure dictates function' and is not load-bearing; no uniqueness theorem or ansatz is imported from prior work by the authors. The genuine weakness is evidential, not circular: the abstract's promise to 'controllably generate connectome subgraphs with predefined properties' is broader than the demonstrated DP success on edge count plus a baseline-free CMA-ES experiment. That is a correctness and support concern, not a circularity finding.
Assumptions & free parameters
free parameters (3)
- Latent dimensionality d
- Edge binarization threshold kappa
- DP discretization step for SHAP values
assumptions (5)
- domain assumption A VAE with a low-dimensional latent space trained on connectome subgraphs can capture the brain's organizational principles analogous to the genetic bottleneck.
- domain assumption Cylindrical sampling along the visual stream axis yields functionally relevant columnar units representative of the connectome.
- domain assumption SHAP values computed on a surrogate model reflect the true relationship between latent variables and graph statistics.
- domain assumption The FlyWire dataset is an accurate reconstruction of the Drosophila visual connectome.
- standard math Standard VAE and SHAP mathematical properties hold.
Cite this review
Pith. "Pith review of Unveiling and Steering Connectome Organization with Interpretable Latent Variables." pith.science (2026). https://pith.science/paper/PYODSI3F
@misc{pith2026250513011,
  author       = {Pith},
  title        = {Pith review of: Unveiling and Steering Connectome Organization with Interpretable Latent Variables},
  year         = {2026},
  howpublished = {\url{https://pith.science/paper/PYODSI3F}},
  note         = {Machine review of arXiv:2505.13011}
}
read the original abstract
The brain's intricate connectome, a blueprint for its function, presents immense complexity, yet it arises from a compact genetic code, hinting at underlying low-dimensional organizational principles. This work bridges connectomics and representation learning to uncover these principles. We propose a framework that combines subgraph extraction from the Drosophila connectome, FlyWire, with a generative model to derive interpretable low-dimensional representations of neural circuitry. Crucially, an explainability module links these latent dimensions to specific structural features, offering insights into their functional relevance. We validate our approach by demonstrating effective graph reconstruction and, significantly, the ability to manipulate these latent codes to controllably generate connectome subgraphs with predefined properties. This research offers a novel tool for understanding brain architecture and a potential avenue for designing bio-inspired artificial neural networks.
Figures


Figures from the paper (6 more)




Reference graph
Works this paper leans on
-
[1]
Machine learning explainability in nasopharyngeal cancer survival using lime and shap
Rasheed Omobolaji Alabi, Mohammed Elmusrati, Ilmo Leivo, Alhadi Almangush, and Antti A Mäkitie. Machine learning explainability in nasopharyngeal cancer survival using lime and shap. Scientific Reports, 13(1):8984, 2023
work page 2023
-
[2]
Tutorial cma-es: evolution strategies and covariance matrix adaptation
Anne Auger and Nikolaus Hansen. Tutorial cma-es: evolution strategies and covariance matrix adaptation. In Proceedings of the 14th annual conference companion on Genetic and evolutionary computation, pages 827–848, 2012
work page 2012
-
[3]
Dynamic programming
Richard Bellman. Dynamic programming. science, 153(3731):34–37, 1966
1966
-
[4]
Seymour Benzer. From the gene to behavior. Jama, 218(7):1015–1022, 1971
work page 1971
-
[5]
Eg-nas: neural architecture search with fast evolutionary exploration
Zicheng Cai, Lei Chen, Peng Liu, Tongtao Ling, and Yutao Lai. Eg-nas: neural architecture search with fast evolutionary exploration. In Proceedings of the AAAI Conference on Artificial Intelligence, volume 38, pages 11159–11167, 2024. 9
work page 2024
-
[6]
Guozhang Chen, Franz Scherr, and Wolfgang Maass. A data-based large-scale model for primary visual cortex enables brain-like robust and versatile visual processing.Science advances, 8(44):eabq7592, 2022
work page 2022
-
[8]
Efficient and degree-guided graph generation via discrete diffusion modeling
Xiaohui Chen, Jiaxing He, Xu Han, and Li-Ping Liu. Efficient and degree-guided graph generation via discrete diffusion modeling. arXiv preprint arXiv:2305.04111, 2023
arXiv 2023
-
[9]
Flywire: online community for whole-brain connectomics
Sven Dorkenwald, Claire E McKellar, Thomas Macrina, Nico Kemnitz, Kisuk Lee, Ran Lu, Jingpeng Wu, Sergiy Popovych, Eric Mitchell, Barak Nehoran, et al. Flywire: online community for whole-brain connectomics. Nature methods, 19(1):119–128, 2022
work page 2022
Show all 49 references
-
[10]
What is dynamic programming? Nature biotechnology, 22(7):909–910, 2004
Sean R Eddy. What is dynamic programming? Nature biotechnology, 22(7):909–910, 2004
2004
-
[11]
Information theory and the genetic code
A Figureau. Information theory and the genetic code. Origins of Life and Evolution of the Biosphere, 17(3):439–449, 1987
1987
-
[12]
Sg-snn: a self-organizing spiking neural network based on temporal information
Shouwei Gao, Ruixin Zhu, Yu Qin, Wenyu Tang, and Hao Zhou. Sg-snn: a self-organizing spiking neural network based on temporal information. Cognitive Neurodynamics, 19(1):14, 2025
2025
-
[13]
Complex spiking neural networks with synaptic time-delay based on anti-interference function
Lei Guo, Sijia Zhang, Youxi Wu, and Guizhi Xu. Complex spiking neural networks with synaptic time-delay based on anti-interference function. Cognitive Neurodynamics, 16(6):1485–1503, 2022
2022
-
[14]
The cma evolution strategy: A tutorial
Nikolaus Hansen. The cma evolution strategy: A tutorial. arXiv preprint arXiv:1604.00772, 2016
2016 arXiv
-
[15]
Neuroscience-inspired artificial intelligence
Demis Hassabis, Dharshan Kumaran, Christopher Summerfield, and Matthew Botvinick. Neuroscience-inspired artificial intelligence. Neuron, 95(2):245–258, 2017
2017
-
[16]
Multi-level cognitive state classification of learners using complex brain networks and interpretable machine learning
Xiuling He, Yue Li, Xiong Xiao, Yingting Li, Jing Fang, and Ruijie Zhou. Multi-level cognitive state classification of learners using complex brain networks and interpretable machine learning. Cognitive Neurodynamics, 19(1):5, 2025
2025
-
[17]
beta-vae: Learning basic visual concepts with a constrained variational framework
Irina Higgins, Loic Matthey, Arka Pal, Christopher Burgess, Xavier Glorot, Matthew Botvinick, Shakir Mohamed, and Alexander Lerchner. beta-vae: Learning basic visual concepts with a constrained variational framework. In International conference on learning representations, 2017
2017
-
[19]
Improving molecular graph generation with flow matching and optimal transport
Xiaoyang Hou, Tian Zhu, Milong Ren, Dongbo Bu, Xin Gao, Chunming Zhang, and Shiwei Sun. Improving molecular graph generation with flow matching and optimal transport. arXiv preprint arXiv:2411.05676, 2024
2024 arXiv
-
[20]
Graph generation with diffusion mixture
Jaehyeong Jo, Dongki Kim, and Sung Ju Hwang. Graph generation with diffusion mixture. arXiv:2302.03596, 2024
2024 arXiv
-
[21]
Score-based generative modeling of graphs via the system of stochastic differential equations
Jaehyeong Jo, Seul Lee, and Sung Ju Hwang. Score-based generative modeling of graphs via the system of stochastic differential equations. arXiv:2202.02514, 2022
2022 arXiv
-
[22]
Generative ai: a review on models and applications
Kuldeep Singh Kaswan, Jagjit Singh Dhatterwal, Kiran Malik, and Anupam Baliyan. Generative ai: a review on models and applications. In 2023 International Conference on Communication, Security and Artificial Intelligence (ICCSAI), pages 699–704. IEEE, 2023
2023
-
[23]
Relevance factor vae: Learning and identifying disentangled factors
Minyoung Kim, Yuting Wang, Pritish Sahu, and Vladimir Pavlovic. Relevance factor vae: Learning and identifying disentangled factors. arXiv preprint arXiv:1902.01568, 2019. 10
1902 arXiv
-
[24]
Seong Hwan Kim, Hayom Kim, and Jung Bin Kim. Differences in functional network between focal onset nonconvulsive status epilepticus and toxic metabolic encephalopathy: application to machine learning models for differential diagnosis. Cognitive Neurodynamics, 17(4):845–853, 2023
2023
-
[25]
Auto-encoding variational bayes, 2013
Diederik P Kingma, Max Welling, et al. Auto-encoding variational bayes, 2013
2013
-
[26]
Variational inference of disentangled latent concepts from unlabeled observations
Abhishek Kumar, Prasanna Sattigeri, and Avinash Balakrishnan. Variational inference of disentangled latent concepts from unlabeled observations. arXiv preprint arXiv:1711.00848, 2017
2017 arXiv
-
[27]
Deep learning
Yann LeCun, Yoshua Bengio, and Geoffrey Hinton. Deep learning. nature, 521(7553):436–444, 2015
2015
-
[28]
Dc-nas: Divide-and- conquer neural architecture search for multi-modal classification
Xinyan Liang, Pinhan Fu, Qian Guo, Keyin Zheng, and Yuhua Qian. Dc-nas: Divide-and- conquer neural architecture search for multi-modal classification. In Proceedings of the AAAI conference on artificial intelligence, volume 38, pages 13754–13762, 2024
2024
-
[29]
Challenging common assumptions in the unsupervised learning of disentangled representations
Francesco Locatello, Stefan Bauer, Mario Lucic, Gunnar Raetsch, Sylvain Gelly, Bernhard Schölkopf, and Olivier Bachem. Challenging common assumptions in the unsupervised learning of disentangled representations. In international conference on machine learning, pages 4114–
-
[31]
Cma-es for hyperparameter optimization of deep neural networks
Ilya Loshchilov and Frank Hutter. Cma-es for hyperparameter optimization of deep neural networks. arXiv preprint arXiv:1604.07269, 2016
2016 arXiv
-
[32]
A unified approach to interpreting model predictions
Scott M Lundberg and Su-In Lee. A unified approach to interpreting model predictions. Advances in neural information processing systems, 30, 2017
2017
-
[33]
Graphdf: A discrete flow model for molecular graph generation
Youzhi Luo, Keqiang Yan, and Shuiwang Ji. Graphdf: A discrete flow model for molecular graph generation. In International conference on machine learning, pages 7192–7203. PMLR, 2021
2021
-
[34]
Generative modelling of structurally constrained graphs.Advances in Neural Information Processing Systems, 37:137218– 137262, 2024
Manuel Madeira, Clement Vignac, Dorina Thanou, and Pascal Frossard. Generative modelling of structurally constrained graphs.Advances in Neural Information Processing Systems, 37:137218– 137262, 2024
2024
-
[35]
Toward an integration of deep learning and neuroscience
Adam H Marblestone, Greg Wayne, and Konrad P Kording. Toward an integration of deep learning and neuroscience. Frontiers in computational neuroscience, 10:94, 2016
2016
-
[36]
From explanations to feature selection: assessing shap values as feature selection mechanism
Wilson E Marcílio and Danilo M Eler. From explanations to feature selection: assessing shap values as feature selection mechanism. In 2020 33rd SIBGRAPI conference on Graphics, Patterns and Images (SIBGRAPI), pages 340–347. Ieee, 2020
2020
-
[37]
Algorithms for knapsack problems
Silvano Martello and Paolo Toth. Algorithms for knapsack problems. North-Holland Mathe- matics Studies, 132:213–257, 1987
1987
-
[38]
Overlooked implications of the reconstruction loss for vae disentanglement
Nathan Michlo, Richard Klein, and Steven James. Overlooked implications of the reconstruction loss for vae disentanglement. arXiv preprint arXiv:2202.13341, 2022
2022 arXiv
-
[39]
Computational role of structure in neural activity and connec- tivity
Srdjan Ostojic and Stefano Fusi. Computational role of structure in neural activity and connec- tivity. Trends in Cognitive Sciences, 2024
2024
-
[40]
Practical guide to shap analysis: explaining supervised machine learning model predictions in drug development
Ana Victoria Ponce-Bobadilla, Vanessa Schmitt, Corinna S Maier, Sven Mensing, and Sven Stodtmann. Practical guide to shap analysis: explaining supervised machine learning model predictions in drug development. Clinical and Translational Science, 17(11):e70056, 2024
2024
-
[41]
The importance of interpreting machine learning models for blood glucose prediction in diabetes: an analysis using shap
Francesco Prendin, Jacopo Pavan, Giacomo Cappon, Simone Del Favero, Giovanni Sparacino, and Andrea Facchinetti. The importance of interpreting machine learning models for blood glucose prediction in diabetes: an analysis using shap. Scientific reports, 13(1):16865, 2023. 11
2023
-
[42]
Detection of the chronic kidney disease using xgboost classifier and explaining the influence of the attributes on the model using shap
Md Johir Raihan, Md Al-Masrur Khan, Seong-Hoon Kee, and Abdullah-Al Nahid. Detection of the chronic kidney disease using xgboost classifier and explaining the influence of the attributes on the model using shap. Scientific Reports, 13(1):6263, 2023
2023
-
[43]
Connectome: How the brain’s wiring makes us who we are
Sebastian Seung. Connectome: How the brain’s wiring makes us who we are. HMH, 2012
2012
-
[44]
Graphaf: a flow-based autoregressive model for molecular graph generation
Chence Shi, Minkai Xu, Zhaocheng Zhu, Weinan Zhang, Ming Zhang, and Jian Tang. Graphaf: a flow-based autoregressive model for molecular graph generation. arXiv preprint arXiv:2001.09382, 2020
2001 arXiv
-
[45]
Encoding innate ability through a genomic bottleneck
Sergey Shuvaev, Divyansha Lachi, Alexei Koulakov, and Anthony Zador. Encoding innate ability through a genomic bottleneck. Proceedings of the National Academy of Sciences , 121(38):e2409160121, 2024
2024
-
[46]
Graphvae: Towards generation of small graphs using variational autoencoders
Martin Simonovsky and Nikos Komodakis. Graphvae: Towards generation of small graphs using variational autoencoders. In Artificial Neural Networks and Machine Learning–ICANN 2018: 27th International Conference on Artificial Neural Networks, Rhodes, Greece, October 4-7, 2018, Pr...
2018
-
[47]
Networks of the brain
Olaf Sporns, MARK DALEY , and JODY C CULHAM. Networks of the brain. Canadian Psychology, 52(4):321–322, 2011
2011
-
[48]
Bisnn: bio-information-fused spiking neural networks for enhanced eeg-based emotion recognition
Hongze Sun, Shifeng Mao, Wuque Cai, Yan Cui, Duo Chen, Dezhong Yao, and Daqing Guo. Bisnn: bio-information-fused spiking neural networks for enhanced eeg-based emotion recognition. Cognitive Neurodynamics, 19(1):1–12, 2025
2025
-
[49]
Graph attention networks
Petar Veliˇckovi´c, Guillem Cucurull, Arantxa Casanova, Adriana Romero, Pietro Lio, and Yoshua Bengio. Graph attention networks. arXiv preprint arXiv:1710.10903, 2017
2017 arXiv
-
[51]
Discrete-state continuous-time diffusion for graph generation
Zhe Xu, Ruizhong Qiu, Yuzhong Chen, Huiyuan Chen, Xiran Fan, Menghai Pan, Zhichen Zeng, Mahashweta Das, and Hanghang Tong. Discrete-state continuous-time diffusion for graph generation. arXiv preprint arXiv:2405.11416, 2024
2024 arXiv
-
[52]
A critique of pure learning and what artificial neural networks can learn from animal brains
Anthony M Zador. A critique of pure learning and what artificial neural networks can learn from animal brains. Nature communications, 10(1):3770, 2019
2019
-
[53]
Pard: Permutation-invariant autoregressive diffusion for graph generation
Lingxiao Zhao, Xueying Ding, and Leman Akoglu. Pard: Permutation-invariant autoregressive diffusion for graph generation. arXiv preprint arXiv:2402.03687, 2024. A Graph Attention Network The Graph Attention Network (GAT) employs an attention mechanism to dynamically capture st...
2024 arXiv
Reviewed August 15, 2026 · model on record in the stance chip above.
Discussion (0). Continue with ORCID to comment.