Processing-Controlled Structural Uniformity and Oxide-Ion Conduction in Na0.52Bi0.47TiO3 Ceramics Probed by Eu3+ Photoluminescence
Pith reviewed 2026-06-30 00:03 UTC · model grok-4.3
The pith
Mixing routes in Na0.52Bi0.47TiO3 control local structural uniformity and trade bulk against grain-boundary oxide-ion conductivity.
A machine-rendered reading of the paper's core claim, the machinery that carries it, and where it could break.
Core claim
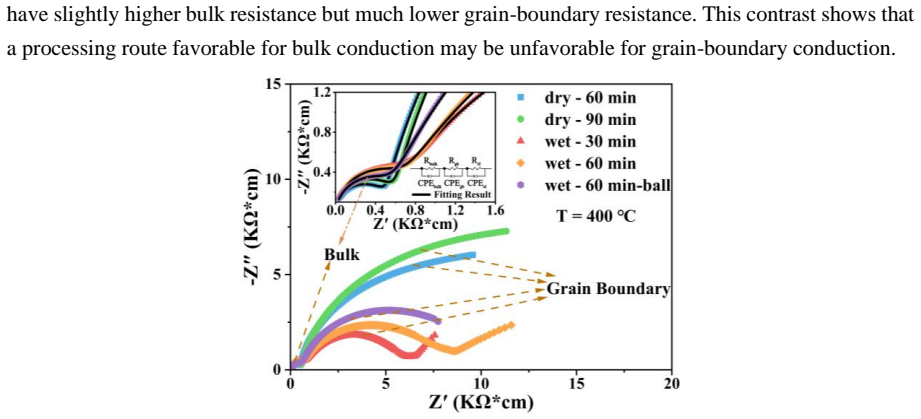
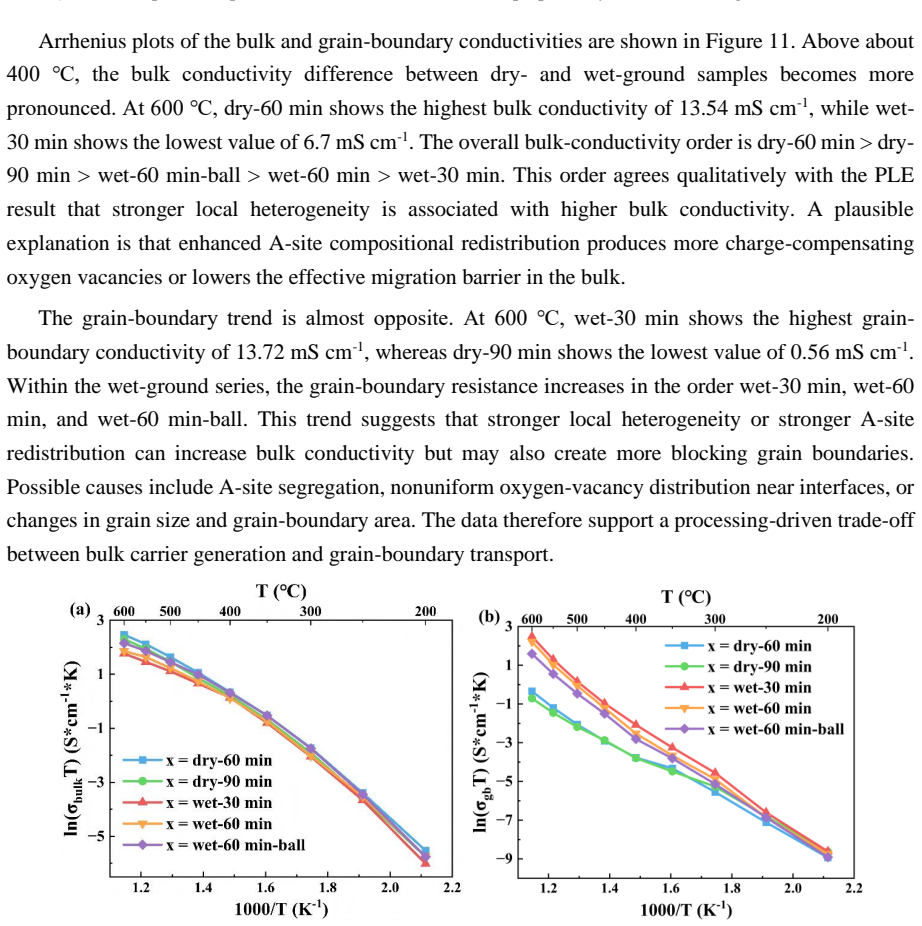
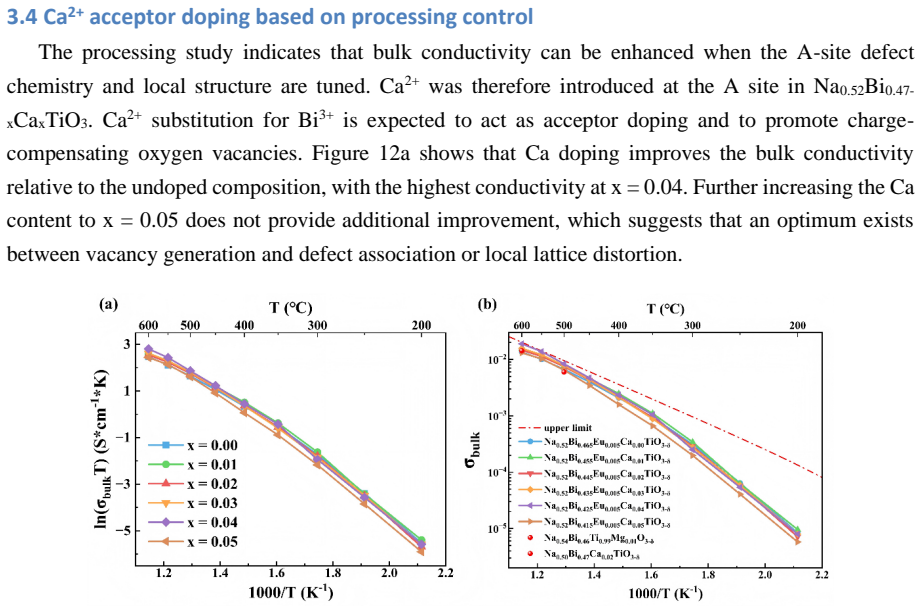
All mixing routes form the perovskite phase, yet produce distinct microstructures, A-site cation ratios, and local Eu3+ environments; dry grinding favors bulk defect generation while wet grinding reduces grain-boundary blocking, yielding a bulk conductivity of 13.54 mS cm-1 at 600°C for the dry-60 min sample and a grain-boundary conductivity of 13.72 mS cm-1 for the wet-30 min sample, with the x=0.04 Ca-doped composition reaching 8.35 mS cm-1 at 500°C and 18.98 mS cm-1 at 600°C.
What carries the argument
Eu3+ photoluminescence excitation spectroscopy monitored at different emission wavelengths, which maps the distribution of local Eu3+ environments as a proxy for structural uniformity and distortion.
If this is right
- Dry grinding increases bulk ionic conductivity by generating more defects inside the grains.
- Wet grinding lowers grain-boundary resistance, improving overall transport when boundaries dominate.
- A-site Ca substitution can be tuned once the processing-uniformity relationship is known, raising total conductivity above either undoped route.
- All routes produce the same average perovskite structure detectable by XRD, so performance differences arise from local and microstructural features.
- The observed trade-off implies that a single processing route cannot optimize both bulk and grain-boundary contributions simultaneously.
Where Pith is reading between the lines
- The same Eu3+ spectral monitoring could be tested on other A-site disordered perovskites to check whether processing sensitivity is general.
- If local uniformity proves rate-limiting, controlled atmosphere or temperature during mixing might further decouple bulk and boundary effects.
- Density variations or trace second phases remain possible secondary contributors that would need separate quantification in follow-up work.
Load-bearing premise
Differences in Eu3+ excitation spectra at varying emission wavelengths accurately map to variations in local structural uniformity that are the dominant cause of the measured conductivity changes.
What would settle it
Prepare sets of dry- and wet-ground samples with matched density, identical A-site stoichiometry by post-synthesis analysis, and no detectable impurities, then measure whether the bulk and grain-boundary conductivity differences disappear while the Eu3+ spectral-shape variations remain.
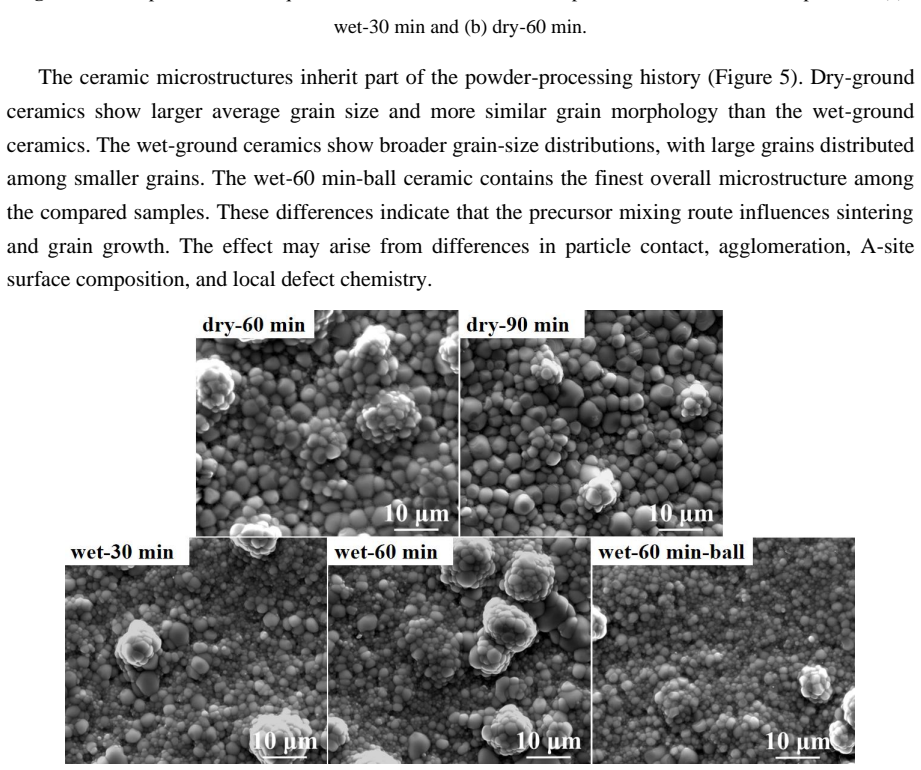
Figures
read the original abstract
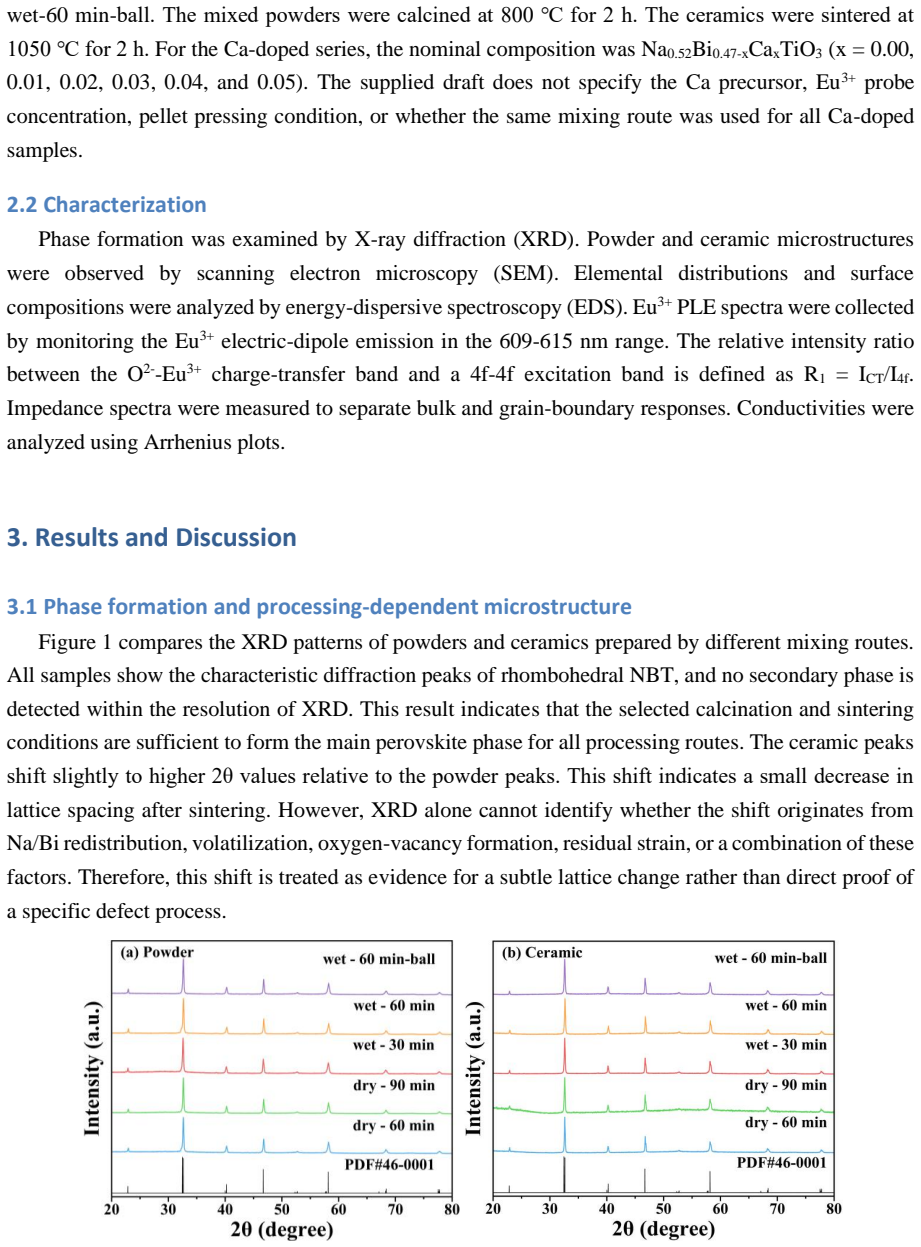
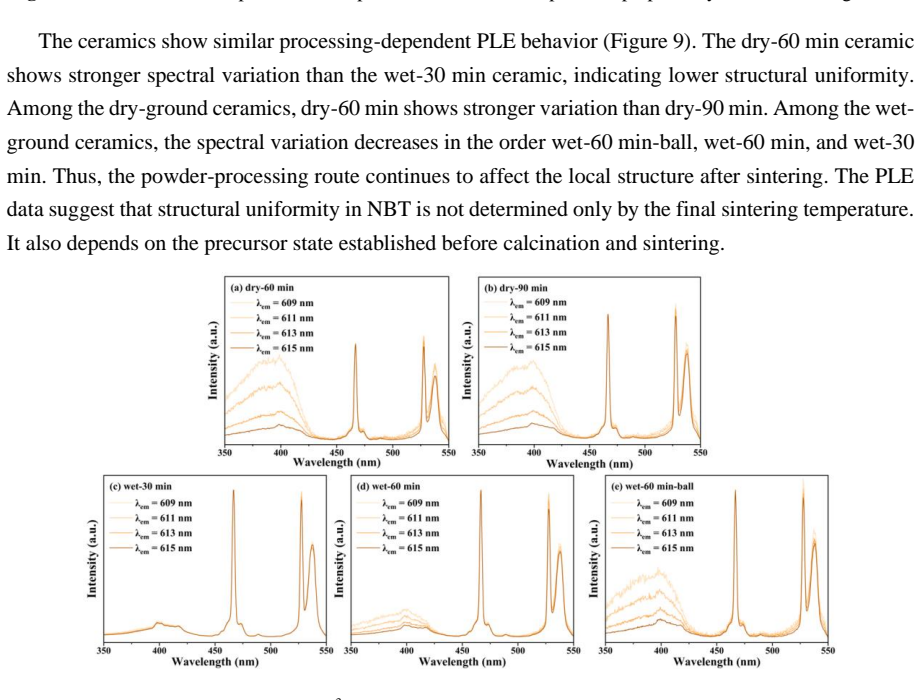
Sodium bismuth titanate (NBT) is a promising oxide-ion conductor,but its electrical conductivity is highly sensitive to small changes in A-site stoichiometry and processing history.This sensitivity can reduce sample-to-sample reproducibility.Here we examine how precursor mixing controls structural uniformity and ionic transport in Na0.52Bi0.47TiO3 ceramics.Dry grinding,wet grinding with ethanol,and ball milling were compared by X-ray diffraction,electron microscopy,energy-dispersive spectroscopy,Eu3+ photoluminescence excitation spectroscopy,and electrochemical impedance spectroscopy.All processed powders and ceramics form the perovskite NBT phase within the detection limit of XRD.However,the microstructure,surface A-site cation ratio,Eu3+ excitation spectra,and electrical response change strongly with the mixing route.Continuous monitoring of Eu3+ excitation spectra at different emission wavelengths reveals different distributions of local Eu3+ environments.Larger spectral-shape variations are consistent with lower structural uniformity and stronger local distortion.Dry-ground samples show higher bulk conductivity than wet-ground samples,whereas wet-ground samples show much lower grain-boundary resistance.At 600 \u2103,the dry-60 min sample reaches a bulk conductivity of 13.54 mS cm-1,while wet-30 min shows the highest grain-boundary conductivity of 13.72 mS cm-1.These results suggest a processing-driven trade-off between bulk defect generation and grain-boundary blocking.Based on this processing understanding,Ca was introduced at the A site in Na0.52Bi0.47-xCaxTiO3.The x=0.04 sample reaches 8.35 mS cm-1 at 500 \u2103 and 18.98 mS cm-1 at 600 \u2103.
Editorial analysis
A structured set of objections, weighed in public.
Referee Report
Summary. The manuscript reports an experimental study of how precursor mixing routes (dry grinding, wet grinding with ethanol, and ball milling) affect phase formation, microstructure, surface A-site cation ratios, local structural uniformity (probed via wavelength-dependent Eu3+ photoluminescence excitation spectra), and oxide-ion transport (via EIS) in Na0.52Bi0.47TiO3 ceramics. It claims that dry-ground samples exhibit higher bulk conductivity (e.g., 13.54 mS cm-1 at 600°C for the dry-60 min sample) while wet-ground samples show lower grain-boundary resistance (highest GB conductivity 13.72 mS cm-1 for wet-30 min), indicating a processing-controlled trade-off between bulk defect generation and grain-boundary blocking. Ca substitution at the A-site (Na0.52Bi0.47-xCaxTiO3, x=0.04) is shown to yield further improvements (8.35 mS cm-1 at 500°C and 18.98 mS cm-1 at 600°C). All samples form the perovskite phase per XRD.
Significance. If the reported conductivity values and the attribution to processing-induced uniformity hold after addressing potential confounders, the work offers a practical route to improve reproducibility and performance in NBT-based oxide-ion conductors, which are known to be sensitive to A-site stoichiometry. The use of Eu3+ PL excitation spectra monitored at multiple emission wavelengths to map distributions of local environments is a useful experimental probe that could be adopted more widely.
major comments (2)
- [Abstract / results on electrical properties] Abstract and results sections: the central interpretation attributes the observed bulk vs. grain-boundary conductivity trade-off primarily to differences in structural uniformity inferred from Eu3+ spectral-shape variations across mixing routes. However, the same abstract states that microstructure and surface A-site cation ratio also vary strongly with mixing method; no quantitative correlation (e.g., plots of spectral variation metric vs. conductivity, or vs. relative density/EDS stoichiometry) is described to show that uniformity is the dominant factor rather than the noted microstructural or compositional changes. This is load-bearing for the trade-off claim.
- [Abstract] Abstract: specific conductivity numbers are stated (dry-60 min bulk 13.54 mS cm-1, wet-30 min GB 13.72 mS cm-1, Ca x=0.04 values at 500/600°C) without reference to error bars, number of samples, or how spectral shapes were quantified (e.g., any metric for 'larger spectral-shape variations'). This prevents assessment of whether the differences exceed experimental variability and undermines the strength of the processing-driven trade-off conclusion.
minor comments (2)
- [Abstract] The abstract uses 'mS cm-1' without defining the temperature range or atmosphere for all EIS measurements; a methods or results subsection should clarify this for reproducibility.
- [Experimental methods] No mention of how Eu3+ doping level was chosen or verified to be non-perturbing to the host structure; a brief statement in the experimental section would strengthen the probe validity.
Simulated Author's Rebuttal
We thank the referee for the constructive comments, which help clarify the presentation of our results on processing effects in NBT ceramics. We address each major comment below and will revise the manuscript to incorporate quantitative metrics, statistical details, and correlation analyses as needed.
read point-by-point responses
-
Referee: [Abstract / results on electrical properties] Abstract and results sections: the central interpretation attributes the observed bulk vs. grain-boundary conductivity trade-off primarily to differences in structural uniformity inferred from Eu3+ spectral-shape variations across mixing routes. However, the same abstract states that microstructure and surface A-site cation ratio also vary strongly with mixing method; no quantitative correlation (e.g., plots of spectral variation metric vs. conductivity, or vs. relative density/EDS stoichiometry) is described to show that uniformity is the dominant factor rather than the noted microstructural or compositional changes. This is load-bearing for the trade-off claim.
Authors: We agree that microstructure and A-site cation ratios vary with mixing route, as already noted in the abstract and results. The Eu3+ excitation spectra are intended as a local probe of structural uniformity (distinct from average microstructure or stoichiometry), with larger spectral variations indicating broader distributions of Eu3+ environments and thus lower uniformity that correlates with higher bulk conductivity via defect generation. While the current version does not include explicit quantitative correlation plots, the observed trends across the three mixing methods support the interpretation. In revision we will define a quantitative metric for spectral-shape variation (e.g., standard deviation of normalized excitation intensity ratios across monitored emission wavelengths) and add plots correlating this metric with bulk/GB conductivity, relative density, and EDS A-site ratios to demonstrate that uniformity contributes independently to the trade-off. revision: yes
-
Referee: [Abstract] Abstract: specific conductivity numbers are stated (dry-60 min bulk 13.54 mS cm-1, wet-30 min GB 13.72 mS cm-1, Ca x=0.04 values at 500/600°C) without reference to error bars, number of samples, or how spectral shapes were quantified (e.g., any metric for 'larger spectral-shape variations'). This prevents assessment of whether the differences exceed experimental variability and undermines the strength of the processing-driven trade-off conclusion.
Authors: We acknowledge that the abstract and results would be strengthened by including error bars, replicate sample counts, and an explicit definition of the spectral-shape variation metric. The reported conductivity values derive from EIS fits on representative pellets; we will add error bars from multiple independent measurements (n ≥ 3 per condition) and state the number of samples measured. We will also define the spectral metric (e.g., variance in excitation peak intensity or shape similarity index across emission wavelengths) and report average values with standard deviations in the revised abstract and main text to allow assessment of variability. revision: yes
Circularity Check
No circularity; purely experimental measurements with no derivations or fitted predictions
full rationale
The paper reports experimental comparisons of dry/wet/ball-milled processing routes in Na0.52Bi0.47TiO3 via XRD, SEM, EDS, Eu3+ photoluminescence excitation spectra at multiple emission wavelengths, and EIS conductivity measurements. No equations, models, or derivations appear anywhere; conductivity values (e.g., 13.54 mS cm-1 bulk for dry-60 min) are direct experimental outputs, not predictions from fitted parameters. The Ca-doping extension is presented as an application of observed trends, not a mathematical reduction. No self-citations, uniqueness theorems, or ansatzes are invoked. The study is self-contained against external benchmarks with independent measurements, so circularity score is 0.
Axiom & Free-Parameter Ledger
axioms (2)
- domain assumption Eu3+ photoluminescence excitation spectra can be used to distinguish distributions of local environments in perovskite ceramics.
- domain assumption Electrochemical impedance spectroscopy separates bulk and grain-boundary contributions in polycrystalline ceramics.
Reference graph
Works this paper leans on
-
[1]
Oxygen ion Conductors [J]
Skinner S J, Kilner J A. Oxygen ion Conductors [J]. Materials Today, 2003, 6(3): 30–37
2003
-
[2]
Aligned nanofibers incorporated composite solid electrolyte for High - sensitivity oxygen sensing at medium Temperatures [J]
Zhang M, Yao L, Xing Y, et al. Aligned nanofibers incorporated composite solid electrolyte for High - sensitivity oxygen sensing at medium Temperatures [J]. Journal of Materials Science & Technology, 2024, 181: 189–197
2024
-
[3]
Recent developments in oxide ion conductors: Focusing on Dion –Jacobson Phases [J]
Zhang W, Yashima M . Recent developments in oxide ion conductors: Focusing on Dion –Jacobson Phases [J]. Chemical Communications, 2023, 59(2): 134–152
2023
-
[4]
Barium titanate Write - once read - many times resistive memory with an ultra - high on/off current ratio of 108 [J]
Hsu C - C, Wu W - C, Jhang W - C, et al. Barium titanate Write - once read - many times resistive memory with an ultra - high on/off current ratio of 108 [J]. Journal of Alloys and Compounds, 2024, 988: 174252
2024
-
[5]
Elucidating dynamic conductive state changes in amorphous lithium lanthanum titanate for resistive switching devices[J]
SHIMIZU R, CHENG D, ZHU G, et al. Elucidating dynamic conductive state changes in amorphous lithium lanthanum titanate for resistive switching devices[J]. Next Materials, 2024, 2: 100102
2024
-
[6]
Improvement of ionic conductivity in A - site lithium doped sodium bismuth Titanate [J]
Shih D P C, Aguadero A, Skinner S J. Improvement of ionic conductivity in A - site lithium doped sodium bismuth Titanate [J]. Solid State Ionics, 2018, 317: 32–38
2018
-
[7]
Bi 0.5Na0.5TiO3 - based energy storage ceramics with excellent comprehensive performance by constructing dynamic nanoscale domains and high intrinsic breakdown Strength [J]
LONG C, SU Z, XU A, ET AL . Bi 0.5Na0.5TiO3 - based energy storage ceramics with excellent comprehensive performance by constructing dynamic nanoscale domains and high intrinsic breakdown Strength [J]. Nano Energy, 2024, 124: 109493
2024
-
[8]
Phase transformation in lead titanate based relaxor ferroelectrics with Ultra - high Strain [J]
ZHANG H, LI Z, W ANG Y, et al. Phase transformation in lead titanate based relaxor ferroelectrics with Ultra - high Strain [J]. Nature Communications, 2025, 16(1)
2025
-
[9]
Lead‐Free High Permittivity Quasi‐Linear Dielectrics for Giant Energy Storage Multilayer Ceramic Capacitors with Broad Temperature Stability [J]
WANG X, SONG X, FAN Y , et al. Lead‐Free High Permittivity Quasi‐Linear Dielectrics for Giant Energy Storage Multilayer Ceramic Capacitors with Broad Temperature Stability [J]. Advanced Energy Materials, 2024, 14(31)
2024
-
[10]
A family of oxide ion conductors based on the ferroelectric perovskite Na0.5Bi0.5TiO3 [J]
Li M, Pietrowski M J, De Souza R A, et al. A family of oxide ion conductors based on the ferroelectric perovskite Na0.5Bi0.5TiO3 [J]. Nature Materials, 2013, 13(1): 31–35
2013
-
[11]
Atomistic simulations of ion migration in sodium bismuth titanate (NBT) materials: Towards superior oxide - ion Conductors [J]
Zhang H, Ramadan Amr H H, De Souza R A. Atomistic simulations of ion migration in sodium bismuth titanate (NBT) materials: Towards superior oxide - ion Conductors [J]. Journal of Materials Chemistry A, 2018, 6(19): 9116–9123
2018
-
[12]
Dramatic Influence of A - Site Nonstoichiometry on the Electrical Conductivity and Conduction Mechanisms in the Perovskite Oxide Na 0.5Bi0.5TiO3 [J]
Li M, Zhang H, Cook S N, et al. Dramatic Influence of A - Site Nonstoichiometry on the Electrical Conductivity and Conduction Mechanisms in the Perovskite Oxide Na 0.5Bi0.5TiO3 [J]. Chemistry of Materials, 2015, 27(2): 629–634
2015
-
[13]
Accelerated materials design of Na 0.5Bi0.5TiO3 oxygen ionic conductors based on first principles Calculations [J]
He X, Mo Y . Accelerated materials design of Na 0.5Bi0.5TiO3 oxygen ionic conductors based on first principles Calculations [J]. Physical Chemistry Chemical Physics, 2015, 17(27): 18035–18044
2015
-
[14]
Influence of excess sodium addition on the structural characteristics and electrical conductivity of Na0.5Bi0.5TiO3[J]
Bhattacharyya R, Omar S . Influence of excess sodium addition on the structural characteristics and electrical conductivity of Na0.5Bi0.5TiO3[J]. Solid State Ionics, 2018, 317: 115-121
2018
-
[15]
High ionic conductivity of Mg2+ - doped non - stoichiometric sodium bismuth Titanate [J]
Bhattacharyya R, Das S, Omar S. High ionic conductivity of Mg2+ - doped non - stoichiometric sodium bismuth Titanate [J]. Acta Materialia, 2018, 159: 8–15
2018
-
[16]
Electrical and Dielectric Properties of Ca - Doped Bi - Deficient Sodium Bismuth Titanate Na0.5Bi0.49−xCaxTiO3−δ (0 ≤ x ≤ 0.08) [J]
Yang F, Hu Y , Hu Q, et al. Electrical and Dielectric Properties of Ca - Doped Bi - Deficient Sodium Bismuth Titanate Na0.5Bi0.49−xCaxTiO3−δ (0 ≤ x ≤ 0.08) [J]. Crystals, 2022, 12(12): 1800
2022
-
[17]
Yang F, Dean J S, Hu Q , et al. From insulator to Oxide - ion conductor by a synergistic effect from defect chemistry and microstructure: Acceptor - doped Bi - excess sodium bismuth titanate Na0.5Bi0.51TiO3.015 [J]. Journal of Materials Chemistry A, 2020, 8(47): 25120–25130
2020
-
[18]
Crystal structure, defect chemistry and oxygen ion transport of the ferroelectric perovskite, Na 0.5Bi0.5TiO3: Insights from first -principles Calculations [J]
DAWSON J A, CHEN H, TANAKA I. Crystal structure, defect chemistry and oxygen ion transport of the ferroelectric perovskite, Na 0.5Bi0.5TiO3: Insights from first -principles Calculations [J]. Journal of Materials Chemistry A, 2015, 3(32): 16574–16582
2015
-
[19]
Optimisation of Oxide - ion conductivity in acceptor - doped Na0.5Bi0.5TiO3 perovskite: Approaching the Limit? [J]
YANG F, LI M, LI L, et al. Optimisation of Oxide - ion conductivity in acceptor - doped Na0.5Bi0.5TiO3 perovskite: Approaching the Limit? [J]. Journal of Materials Chemistry A, 2017, 5(41): 21658–21662
2017
discussion (0)
Sign in with ORCID, Apple, or X to comment. Anyone can read and Pith papers without signing in.