REVIEW 4 major objections 5 minor 86 references
Mapping the Filamentary Nebula of NGC 1275 with Multiwavelength SITELLE Observations
T0 review · 4 major / 5 minor · reviewed 2026-08-08 · deepseek-v4-flash
Pith's one-line read The AGN does not power the extended filaments of NGC 1275; a distributed hard-ionizing source, likely the cooling intracluster medium, does.
desk verdict The new SITELLE maps are a genuine dataset, but the paper's headline claim that they rule out AGN photoionization of the extended filaments overreaches what the diagnostics can actually discriminate. read the letter →
The pith
A machine-rendered reading of the paper's core claim, the machinery that carries it, and where it could break.
The reading
What carries the argument
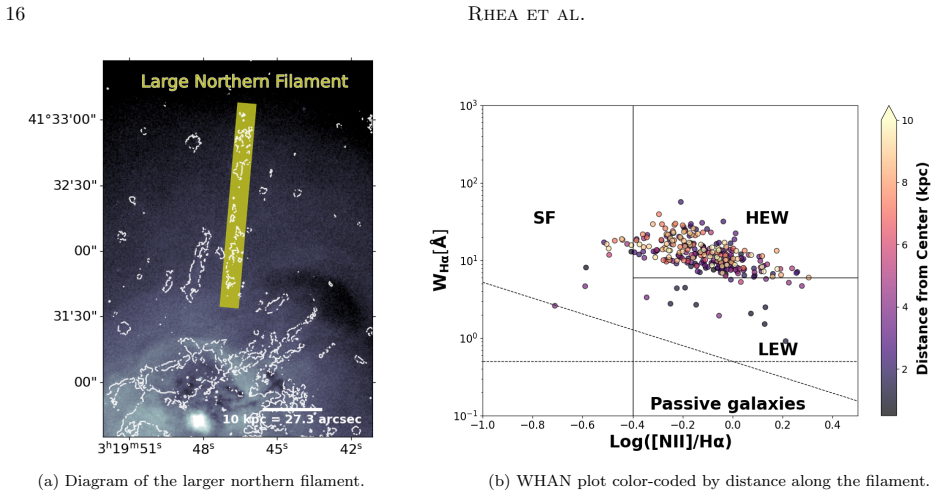
The key machinery is the combination of the WHAN diagram (equivalent width of Hα versus log([N II]/Hα)) and the BPT diagram ([O III]/Hβ versus [N II]/Hα), with diagnostic cuts adopted from Stasińska et al. (2006) at log([N II]/Hα) = -0.4 and Kewley et al. (2006) at W_Hα = 6 Å. Because [O III] is undetected in the extended filaments, the WHAN diagram is the primary tool there; it classifies each spaxel as star-forming, high-equivalent-width (HEW), or low-equivalent-width (LEW), and the spatial maps of these classifications reveal the distribution of ionizing mechanisms across the nebula.
What would settle it
A spatially resolved spectrum of the large northern filament that detects [O III] λ5007 at greater than 3σ significance, or that shows W_Hα increasing toward the galaxy center, would falsify the claim that a uniform distributed source rather than the AGN ionizes the extended filaments.
Extended reading notes
Core claim
The paper establishes that [O III] λ5007 is detected only in the central core of NGC 1275 and is absent from the extended filaments, placing an upper limit on its flux in the small northern filament. In the BPT diagram, all central-region spaxels lie above the Kauffmann et al. (2003) line, indicating that neither pure AGN nor star-formation photoionization alone explains the observed line ratios, while the WHAN diagram places nearly the entire nebula in the high-equivalent-width region that requires a highly energetic ionizing source. Critically, the northern filament shows no radial trend in either [N II]/Hα or W_Hα with distance from the AGN, which the authors interpret as evidence that the ionizing source is uniformly distributed along the filament rather than centrally concentrated. The conclusion is that AGN photoionization does not power the filaments; a distributed hard-ionizing mechanism, consistent with cooling ICM gas via collisional excitation and/or mixing, is responsible, and magnetic fields play a key role in the filaments' formation and persistence.
Load-bearing premise
The diagnostic boundaries calibrated on galaxy-integrated spectra apply to the low-density, $10^{4}$ K cluster filaments, and the non-detection of [O III] in the extended filaments can be read as the absence of hard AGN photoionization there.
Editorial extensions
If this is right
- The extended optical filaments of NGC 1275 are not lit by the central AGN, so models of cool-core clusters must invoke distributed energy input, such as thermal conduction, mixing, or particle heating from the ICM.
- Magnetic fields must play a structural role: thin 10^4 K filaments survive without being shredded, supporting the idea that field lines guide and confine the gas.
- The central high-dispersion region is kinematically and ionizingly distinct, consistent with a separate mechanism such as an AGN-driven outflow or jet interaction.
- Most of the nebula contains no [O III], so future ionization studies of such filaments cannot rely on classic BPT diagrams alone; WHAN-style diagnostics are needed.
- Star formation is confined to a few clumps, so the nebula is not a star-forming system; its optical emission traces cooling or mixing of hot ICM gas.
Reading between the lines
- If the distributed hard-ionizing source is the cooling ICM, the same diagnostic pattern should appear in other cool-core clusters with resolved filaments; its absence in another cluster would separate the Perseus case from them.
- The transferability of the S06/K06 diagnostic cuts could be tested by comparing resolved filament spectra with photoionization-plus-precipitation models; a mismatch would shift classifications without necessarily changing the [O III] upper-limit argument.
- The non-detection of [O III] in the extended filaments can be read as a constraint on the local ionizing spectrum: fewer than roughly one hard photon per recombining atom, which would rule out unshielded AGN radiation even if the AGN's luminosity varies over time.
Signed reviews
Editorial analysis
A structured set of objections, weighed in public.
Referee Report
Summary. This paper presents new SITELLE observations of NGC 1275 covering the SN1, SN2, and SN3 filters, from which the authors produce flux maps of [O II] λ3726/3729, [O III] λ5007, Hβ, [N II] λ6548/6583, and Hα across the full filamentary nebula. Using LUCI for spectral fitting and applying BPT and WHAN diagnostics, the authors find that [O III] is detected only in the central core, that the extended filaments are consistent with a hard-ionizing source that is uniformly distributed, and that the AGN does not play a critical role in ionizing the extended filaments. They interpret the results as supporting cooling ICM and/or mixing as the ionization mechanism, with magnetic fields important for filament support.
Significance. The observational product is valuable: this is the first complete, spatially resolved multi-filter map of the NGC 1275 filamentary nebula in [O II], [O III], Hβ, [N II], and Hα at a common spectral resolution, and the paper gives a detailed description of the LUCI fitting procedure plus the exact fit commands in Appendix B, which aids reproducibility. The authors also repeatedly and appropriately caution that BPT/WHAN classification boundaries should not be overinterpreted. If the central conclusion—that a distributed hard-ionizing source rather than the AGN powers the filaments—withstood scrutiny, it would strengthen the case for cooling ICM, collisional excitation/mixing, and magnetic field support. However, the inference rests on the transfer of galaxy-calibrated diagnostic cuts to low-density cluster filaments and on interpreting non-detections as absences, and the key radial-gradient argument in §4.2.4 is not discriminating between central and distributed ionizing sources.
major comments (4)
- [§4.2.4] The conclusion that AGN photoionization is not responsible for the filaments, based on the absence of a radial trend in the WHAN indicators, is not supported by the data as presented. The two WHAN quantities, W_Hα and log([N II]/Hα), are nearly flat functions of ionization parameter U in the low-U regime that applies to these filaments, whereas [O III]/Hβ is the diagnostic that actually tracks U. The paper's own BPT analysis (§4.1, Fig. 4) shows [O III]/Hβ decreasing with distance in the core, which directly demonstrates a decreasing U; extrapolating this trend would place [O III] below the SITELLE detection limit in the extended filaments. Thus a central AGN illuminating the gas at low U would naturally produce the observed pattern: undetectable [O III] outside the core, high and roughly constant [N II]/Hα, and a flat W_Hα because both Hα and the continuum fall approximately as r^-2 for a point source. The no-radial-trend argument therefore does not exclude AGN photoionization. To support the distributed-source claim, the authors need a quantitative test, for example a CLOUDY or MAPPINGS photoionization grid covering low U values to show that AGN-like spectra fail to reproduce the observed line ratios and upper limits, or an energy-budget argument showing the AGN is too faint. Absent that, the data support only the more modest statement that the WHAN diagnostics are consistent with a hard-ionizing source without requiring radial variation.
- [Abstract and §3.2.1/§4.1] The abstract states that the paper 'confirms the absence of [O III] λ5007 in the extended filaments,' but the data only provide a non-detection, with a 3σ upper limit computed from a single pixel: the brightest pixel in the small northern filament (cyan arrow in Fig. 4). A non-detection is not confirmation of absence, especially when the detection limit is defined from one pixel rather than from stacked or co-added spectra across the extended filaments. Since the reading of the [O III] upper limit is load-bearing for the conclusion that AGN photoionization is unimportant, the authors should either place (and present) spatially resolved upper limits along the filaments, generate a stacked limit, or soften the claim to 'do not detect [O III] in the extended filaments' and describe the corresponding upper limits explicitly.
- [§3.2.2] The WHAN classification used throughout §4.2 is partly definitional. Spaxels are classified as HEW (i.e., as requiring a 'highly energetic ionizing source') when they lie above W_Hα = 6 Å and to the right of log([N II]/Hα) = -0.4, and the subsequent interpretation treats this classification as evidence for a hard ionizer. But the diagnostic lines themselves are calibrated on galaxy-integrated spectra of star-forming galaxies and AGN (K03, K06, S06), and the paper acknowledges in §3.2 that these classification systems 'may fall short of diagnostic' for emission-line regions with more physical processes in play. The transfer of these cuts to low-density, 10^4 K cluster filaments—where collisional ionization, mixing, magnetic reconnection, and low ionization parameters dominate—is not established. The inference that a hard ionizing source is present is therefore vulnerable to circularity: the HEW category is defined by the same equivalent-width threshold that is then interpreted as indicating a hard ionizer. Independent checks, such as comparing observed line ratios against photoionization and collisional-ionization models (e.g., CLOUDY grids with varying U, density, and input spectra), are needed to demonstrate that the HEW classification corresponds to a genuinely hard ionizing mechanism in this environment.
- [§3.2.1 and §4.1] The statement that the [O III] upper bound in the filaments indicates 'that the ionization mechanism at play in the outer filaments is distinct from ionized gas regions in our galaxy or nearby AGN' goes beyond what the data show. The comparison relies on the position of a single upper-limit point relative to galaxy-integrated BPT loci, which are not appropriate benchmarks for spatially resolved, low-density, low-U gas. Moreover, the earlier claim in §4.1 that the radial decrease of [O III]/Hβ implies that 'the strength of the ionizing source decreases further from the center' conflates ionization parameter with the intrinsic hardness of the source; a constant SED with decreasing U produces the same observed trend. These interpretations should be reframed as possibilities rather than conclusions, unless accompanied by a model that distinguishes SED hardness from ionization parameter.
minor comments (5)
- [§4.2.4] The reference to the northern filament figure appears as 'Figure ??' in the text; the correct figure number must be inserted.
- [§4.2.1] The '2-dimensional Kolmogrov-Smirnoff test' should be 'Kolmogorov-Smirnov', and the authors should report the test statistic, p-value, and the number of spaxels in each region so that the statistical significance of the difference between the shock bar and the small northern filament can be evaluated.
- [Throughout] There are numerous typographical errors that should be corrected in a revision: 'Minkowki 1959' (→ Minkowski), 'refered' (→ referred), 'occuring' (→ occurring), 'theshocked' (→ the shocked), 'ioinzing' (→ ionizing) in the summary, 'pre-calibarated' (→ pre-calibrated), 'classification classification' (duplicated word in §3.2), and 'W e' (→ We) in §3.2.2.
- [Fig. 4 caption] The caption reads 'the cyan arrow represents the upper bound the brightest pixel in the small northern filament'; this should be 'the upper bound for the brightest pixel'.
- [§3.2.1] The sentence 'All points lie above the Kauffmann et al. 2003 line' is stated before the caveat that the literal BPT classifications are not definitive for this object; given the paper's own emphasis on not overinterpreting diagnostic lines, this phrasing should be softened to 'all points lie in the composite/AGN region of the diagram according to the K03 and K06 demarcations.'
Circularity Check
Observational analysis with externally calibrated diagnostics; the only mildly circular step is the WHAN/HEW classification itself, and it is not load-bearing for the independent [O III] and line-ratio evidence.
-
self definitional
[Section 3.2.2 (WHAN Diagram); conclusion applied in Section 4.2.4]
"Any spaxel above this line is generally classified as a HEW and any spaxel below this line is classified as a LEW. The distinction here comes from the fact that the equivalent width measures the ratio of the contributions of the highly energetic ionizer and the non-ionizing stellar component; therefore, the sHIS classification refers to a strong hard-ionizing agent while a wHIS refers to a weaker hard-ionizing agent."
The HEW label is defined by construction as indicating a strong hard-ionizing source, so reporting that most spaxels fall in the Seyfert/HEW region and then concluding that a hard-ionizing source is required is partly a restatement of the classification rather than an independent detection. The subsequent Section 4.2.4 claim that 'a uniformly distributed physical phenomenon that is a hard-ionizing source appears to be responsible' inherits the 'hard-ionizing source' component from that same definition. The circularity is mild because the paper repeatedly cautions against overinterpreting the cuts, and the independent evidence (non-detection of [O III] in extended filaments and the constant [N II]/Halpha ratio) does not reduce to the WHAN definitions.
full rationale
This is an observational analysis rather than a derivation from first principles, so most of the paper is naturally self-contained against external diagnostics. The BPT and WHAN cuts are imported from published galaxy-integrated calibrations (K03, K06, S06, Cid Fernandes et al.), not fitted to the NGC 1275 data, and the line fluxes are produced by a public fitting code, LUCI, with stated assumptions. There is no equation whose output is equivalent to its input and no fitted parameter that is later relabeled as a prediction. Self-citations to the authors' prior SITELLE kinematics and LUCI software are used for context and reduction, but they are not the load-bearing support for the central ionization claim. The one mildly self-definitional element is the WHAN/HEW classification itself: the category 'HEW' is defined as requiring a strong hard-ionizing agent, so the inference that such an agent exists partly restates the diagnostic definition. However, the paper's independent evidence, particularly the absence of [O III] in the extended filaments and the roughly constant [N II]/Halpha ratio along the northern filament, gives the central conclusion content beyond the tautological part. The skeptic concern that no radial WHAN gradient is also expected for low-ionization-parameter AGN photoionization is a legitimate scientific underdetermination, but it is not a circularity of the kind defined by the review criteria. Overall score 2 reflects one minor definitional component while the central observational result has independent support.
Assumptions & free parameters
free parameters (6)
- Spatial binning of 3x3 SITELLE pixels =
3x3 pixels (~340 pc; text incorrectly says 350 kpc)
- Flux masking threshold =
1×10^-17 erg s^-1 cm^-2 Å^-1
- SNR masking cut =
3
- Hβ mask based on Hα contours =
null
- Manual ds9 removal of noisy pixels =
null
- Single-pixel [O III] 3-sigma upper limit =
null
assumptions (5)
- domain assumption Line profile is a sinc function convolved with a Gaussian with instrument-defined widths (Equation 1).
- domain assumption Emission lines in the same filter are emitted by the same gas, so their velocities and dispersions are linked.
- domain assumption The High-Velocity System is cleanly separated in velocity, and its only contamination is [O III] 4959 overlapping [O III] 5007 of the LVS.
- domain assumption BPT and WHAN diagnostic boundaries calibrated on galaxy samples (K03, K06, S06) are applicable to low-density cluster filaments as indicators of energy per ionization.
- domain assumption Hβ emission follows Hα morphology, justifying masking Hβ with the Hα map.
Cite this review
Pith. "Pith review of Mapping the Filamentary Nebula of NGC 1275 with Multiwavelength SITELLE Observations." pith.science (2026). https://pith.science/paper/QCBIRVGT
@misc{pith2026250205406,
  author       = {Pith},
  title        = {Pith review of: Mapping the Filamentary Nebula of NGC 1275 with Multiwavelength SITELLE Observations},
  year         = {2026},
  howpublished = {\url{https://pith.science/paper/QCBIRVGT}},
  note         = {Machine review of arXiv:2502.05406}
}
abstract
The filamentary nebula encompassing the central galaxy of the Perseus Cluster, NGC 1275, is a complex structure extending dozens of kiloparsecs from NGC 1275. Decades of previous works have focused on establishing the primary formation and ionization mechanisms in different filaments. These studies have pointed to a lack of star formation in the majority of the filaments, the importance of magnetic fields and turbulence in several regions, and the role of interactions between the intercluster medium (ICM) and the cool gas in the filaments, as well as the role of interaction between the central radio source, 3C84, and the filaments. In this paper, we present multi-filter observations of the entire filamentary system that cover the optical bandpass, using the SITELLE instrument at the Canada-France-Hawai'i Telescope. Here, we use the data analysis software, \href{https://crhea93.github.io/LUCI/index.html}{\texttt{LUCI}}, to produce flux maps of the prominent emission lines present in the filters: \oii{}$\lambda$3726/3729, \oiii{}$\lambda$5007, H$\beta$, \nii{}$\lambda$6548, \nii{}$\lambda$6583, and H$\alpha$. We use these maps to produce BPT and WHAN diagrams to study the ionization mechanisms at play in each distinct region of the filamentary nebula. First, we confirm the absence of \oiii{}$\lambda$5007 in the extended filaments, although we detect this line in the central core, revealing a compact region where photoionization by the AGN might affect local conditions. Our findings corroborate previous claims that the ionization in the extended filaments could be caused by the cooling ICM via collisional excitation and/or mixing. Moreover, they support the conclusion that magnetic fields play an important role in the formation and continued existence of the filaments.
Figures


Figures from the paper (13 more)




Reference graph
Works this paper leans on
-
[1]
, " * write output.state after.block = add.period write newline
ENTRY address archivePrefix author booktitle chapter doi edition editor eprint howpublished institution journal key month number organization pages publisher school series title misctitle type volume year version url label extra.label sort.label short.list INTEGERS output.state before.all mid.sentence after.sentence after.block FUNCTION init.state.consts ...
-
[2]
write newline
" write newline "" before.all 'output.state := FUNCTION format.url url empty "" new.block "" url * "" * if FUNCTION format.eprint eprint empty "" archivePrefix empty "" archivePrefix "arXiv" = new.block " " eprint * " " * new.block " " eprint * " " * if if if FUNCTION format.doi doi empty "" " " doi * " " * if FUNCTION format.pid doi empty eprint empty ur...
-
[3]
thebibliography [1] 20pt to REFERENCES 6pt =0pt -12pt 10pt plus 3pt =0pt =0pt =1pt plus 1pt =0pt =0pt -12pt =13pt plus 1pt =20pt =13pt plus 1pt \@M =10000 =-1.0em =0pt =0pt 0pt =0pt =1.0em @enumiv\@empty 10000 10000 `\.\@m \@noitemerr \@latex@warning Empty `thebibliography' environment \@ifnextchar \@reference \@latexerr Missing key on reference command E...
work page Pith review arXiv 2017
-
[4]
2015, 19
Abadi, M., Barham, P., Chen, J., et al. 2015, 19
2015
-
[5]
Astropy Collaboration , Price-Whelan, A. M., Sipőcz, B. M., et al. 2018, The Astronomical Journal, 156, 123, 10.3847/1538-3881/aabc4f
-
[6]
Astropy Collaboration , Price-Whelan, A. M., Lim, P. L., et al. 2022, The Astrophysical Journal, 935, 167, 10.3847/1538-4357/ac7c74
-
[7]
Baldwin, J. A., Phillips, M. M., & Terlevich, R. 1981, PASP, 93, 5, 10.1086/130766
doi:10.1086/130766 1981
-
[8]
2013, Monthly Notices of the Royal Astronomical Society, 430, 3213, 10.1093/mnras/stt125
Barai, P., Viel, M., Borgani, S., et al. 2013, Monthly Notices of the Royal Astronomical Society, 430, 3213, 10.1093/mnras/stt125
Show all 86 references
-
[9]
B., & Sanchez, B
Beroiz, M., Cabral, J. B., & Sanchez, B. 2020, Astronomy and Computing, 32, 100384, 10.1016/j.ascom.2020.100384
2020
-
[10]
N., Anderson, M
Bregman, J. N., Anderson, M. E., Miller, M. J., et al. 2018, ApJ, 862, 3, 10.3847/1538-4357/aacafe
2018 doi
-
[11]
M., & Burbidge, G
Burbidge, E. M., & Burbidge, G. R. 1962, The Astrophysical Journal, 135, 694, 10.1086/147313
1962 doi
-
[13]
Canning, R. E. A., Ferland, G. J., Fabian, A. C., et al. 2016, Monthly Notices of the Royal Astronomical Society, 455, 3042, 10.1093/mnras/stv2390
2016 doi
-
[14]
2003, The Astrophysical Journal, 590, 225, 10.1086/374923
Churazov, E., Forman, W., Jones, C., & Böhringer, H. 2003, The Astrophysical Journal, 590, 225, 10.1086/374923
2003 doi
-
[16]
S., et al
Cid Fernandes, R., Stasińska, G., Schlickmann, M. S., et al. 2010, Monthly Notices of the Royal Astronomical Society, 403, 1036, 10.1111/j.1365-2966.2009.16185.x
2010
-
[17]
J., III, J
Conselice, C. J., III, J. S. G., & Wyse, R. F. G. 2001, The Astronomical Journal, 122, 2281, 10.1086/323534
2001 doi
-
[18]
2022, Monthly Notices of the Royal Astronomical Society, 512, 4136, 10.1093/mnras/stac544
Curti, M., Hayden-Pawson, C., Maiolino, R., et al. 2022, Monthly Notices of the Royal Astronomical Society, 512, 4136, 10.1093/mnras/stac544
2022 doi
-
[19]
L., Rich, J
Davies, R. L., Rich, J. A., Kewley, L. J., & Dopita, M. A. 2014, Monthly Notices of the Royal Astronomical Society, 439, 3835, 10.1093/mnras/stu234
2014 doi
-
[20]
M., Geha, M., Wetzel, A., & El-Badry, K
Dickey, C. M., Geha, M., Wetzel, A., & El-Badry, K. 2019, ApJ, 884, 180, 10.3847/1538-4357/ab3220
2019 doi
-
[21]
Donahue, M., & Voit, G. M. 1991, The Astrophysical Journal, 381, 361, 10.1086/170659
1991 doi
-
[23]
C., Johnstone, R
Fabian, A. C., Johnstone, R. M., Sanders, J. S., et al. 2008, Nature, 454, 968. https://go.gale.com/ps/i.do?p=AONE&sw=w&issn=00280836&v=2.1&it=r&id=GALE
2008
-
[24]
C., & Sanders, J
Fabian, A. C., & Sanders, J. S. 2006, Heating and cooling in the Perseus cluster core, 10.1007/978-3-540-73484-0_13
2006 doi
-
[25]
C., Sanders, J
Fabian, A. C., Sanders, J. S., Crawford, C. S., et al. 2003, Monthly Notices of the Royal Astronomical Society, 344, L48, 10.1046/j.1365-8711.2003.06856.x
2003
-
[26]
C., Sanders, J
Fabian, A. C., Sanders, J. S., Williams, R. J. R., et al. 2011, The energy source of the filaments around the giant galaxy NGC1275 , 10.1111/j.1365-2966.2011.19034.x
2011
-
[27]
C., Sanders, J
Fabian, A. C., Sanders, J. S., Ettori, S., et al. 2000, Chandra imaging of the complex X -ray core of the Perseus cluster, 10.1046/j.1365-8711.2000.03904.x
2000
-
[28]
1987, Monthly Notices of the Royal Astronomical Society, 225, 155, 10.1093/mnras/225.1.155
Fasano, G., & Franceschini, A. 1987, Monthly Notices of the Royal Astronomical Society, 225, 155, 10.1093/mnras/225.1.155
1987 doi
-
[29]
J., Fabian, A
Ferland, G. J., Fabian, A. C., Hatch, N. A., et al. 2009, Monthly Notices of the Royal Astronomical Society, 392, 1475, 10.1111/j.1365-2966.2008.14153.x
2009
-
[31]
Gaspari, M., Ruszkowski, M., & Oh, S. P. 2013, Monthly Notices of the Royal Astronomical Society, 432, 3401, 10.1093/mnras/stt692
2013 doi
-
[32]
B., et al
Gendron-Marsolais, M., Hlavacek-Larrondo, J., Martin, T. B., et al. 2018, Revealing the velocity structure of the filamentary nebula in NGC 1275 in its entirety, 10.1093/mnrasl/sly084
2018 doi
-
[33]
R., Millman, K
Harris, C. R., Millman, K. J., van der Walt, S. J., et al. 2020, Nature, 585, 357, 10.1038/s41586-020-2649-2
2020 doi
-
[35]
M., Baum, S
Heckman, T. M., Baum, S. A., van Breugel, W. J. M., & McCarthy, P. 1989, The Astrophysical Journal, 338, 48, 10.1086/167181
1989 doi
-
[36]
2016, Nature, 535, 117, 10.1038/nature18627
Hitomi Collaboration , Aharonian, F., Akamatsu, H., et al. 2016, Nature, 535, 117, 10.1038/nature18627
2016 doi
-
[37]
2018, Publications of the Astronomical Society of Japan, 70, 13, 10.1093/pasj/psx147
---. 2018, Publications of the Astronomical Society of Japan, 70, 13, 10.1093/pasj/psx147
2018 doi
-
[38]
Hunter, J. D. 2007, Computing in Science & Engineering, 9, 90, 10.1109/MCSE.2007.55
2007 doi
-
[39]
M., & Fabian, A
Johnstone, R. M., & Fabian, A. C. 1988, Monthly Notices of the Royal Astronomical Society, 233, 581, 10.1093/mnras/233.3.581
1988 doi
-
[40]
A., & Mandel, E
Joye, W. A., & Mandel, E. 2003, 295, 489. https://ui.adsabs.harvard.edu/abs/2003ASPC..295..489J
2003
-
[41]
M., Tremonti, C., et al
Kauffmann, G., Heckman, T. M., Tremonti, C., et al. 2003, Mon Not R Astron Soc, 346, 1055, 10.1111/j.1365-2966.2003.07154.x
2003
-
[42]
M., & Sargent, W
Kent, S. M., & Sargent, W. L. W. 1979, The Astrophysical Journal, 230, 667, 10.1086/157125
1979 doi
-
[43]
2001, Astrophysical Journal Supplement Series, 132, 37
Kewley, L., Heislerr, C., & Dopita, M. 2001, Astrophysical Journal Supplement Series, 132, 37
2001
-
[45]
2020, ApJ, 889, L1, 10.3847/2041-8213/ab65c7
Li, Y., Gendron-Marsolais, M.-L., Zhuravleva, I., et al. 2020, ApJ, 889, L1, 10.3847/2041-8213/ab65c7
2020 doi
-
[46]
2023, ndtest
Li, Z. 2023, ndtest. https://github.com/syrte/ndtest
2023
-
[47]
2008, ApJ, 672, 252, 10.1086/523664
Lim, J., Ao, Y., & Dinh-V-Trung. 2008, ApJ, 672, 252, 10.1086/523664
2008 doi
-
[48]
1970, The Astrophysical Journal Letters, 159, 10.1086/180500
Lynds, R. 1970, The Astrophysical Journal Letters, 159, 10.1086/180500
1970 doi
-
[49]
X., McQuinn, M., et al
Macquart, J.-P., Prochaska, J. X., McQuinn, M., et al. 2020, Nature, 581, 391, 10.1038/s41586-020-2300-2
2020 doi
-
[50]
P., Smith, G
Marrone, D. P., Smith, G. P., Okabe, N., et al. 2012, ApJ, 754, 119, 10.1088/0004-637X/754/2/119
2012 doi
-
[51]
2017, arXiv:1706.03230 [astro-ph]
Martin, T., & Drissen, L. 2017, arXiv:1706.03230 [astro-ph]. http://arxiv.org/abs/1706.03230
2017 arXiv
-
[52]
B., Prunet, S., & Drissen, L
Martin, T. B., Prunet, S., & Drissen, L. 2016, Mon. Not. R. Astron. Soc., 463, 4223, 10.1093/mnras/stw2315
2016 doi
-
[53]
McDonald, M., Veilleux, S., & Rupke, D. S. N. 2011, Optical Spectroscopy of Halpha Filaments in Cool Core Clusters : Kinematics , Reddening , and Sources of Ionization , 10.1088/0004-637X/746/2/153
2011 doi
-
[54]
R., Russell, H
McNamara, B. R., Russell, H. R., Nulsen, P. E. J., et al. 2016, ApJ, 830, 79, 10.3847/0004-637X/830/2/79
2016 doi
-
[55]
2014, ApJ, 785, 44, 10.1088/0004-637X/785/1/44
---. 2014, ApJ, 785, 44, 10.1088/0004-637X/785/1/44
2014 doi
-
[56]
1959, in Optical observations of nonthermal galactic radio sources, Vol
Minkowki, R. 1959, in Optical observations of nonthermal galactic radio sources, Vol. 9 (Paris: Cambridge University Press), 315--322. https://www.cambridge.org/core/journals/symposium-international-astronomical-union/article/optical-observations-of-nonthermal-galactic-radio-s...
1959
-
[57]
Mittal, R., Oonk, J. B. R., Ferland, G. J., et al. 2012, Herschel observations of extended atomic gas in the core of the Perseus cluster, 10.1111/j.1365-2966.2012.21891.x
2012
-
[58]
F., Holt, S
Mushotzky, R. F., Holt, S. S., Boldt, E. A., Serlemitsos, P. J., & Smith, B. W. 1981, The Astrophysical Journal, 244, L47, 10.1086/183477
1981 doi
-
[59]
2019, ALMA Sees the Heart of Perseus : Discovery of the Rotating Disk and Outflow of Cold Gas in NGC1275 , 10.5281/zenodo.3585406
Nagai, H. 2019, ALMA Sees the Heart of Perseus : Discovery of the Rotating Disk and Outflow of Cold Gas in NGC1275 , 10.5281/zenodo.3585406
2019 doi
-
[60]
2019, The Astrophysical Journal, 880, 112, 10.3847/1538-4357/ab288b
Oh, K., Ueda, Y., Akiyama, M., et al. 2019, The Astrophysical Journal, 880, 112, 10.3847/1538-4357/ab288b
2019 doi
-
[61]
Osterbrock, D. E. 1981, The Astrophysical Journal, 249, 462, 10.1086/159306
1981 doi
-
[62]
Peacock, J. A. 1983, Monthly Notices of the Royal Astronomical Society, 202, 615, 10.1093/mnras/202.3.615
1983 doi
-
[63]
2005, ApJ, 632, 821, 10.1086/444344
Pizzolato, F., & Soker, N. 2005, ApJ, 632, 821, 10.1086/444344
2005 doi
-
[64]
2021 a , Research Notes of the American Astronomical Society, 5, 276, 10.3847/2515-5172/ac3dfe
Rhea, C., Hlavacek-Larrondo, J., Rousseau-Nepton, L., & Prunet, S. 2021 a , Research Notes of the American Astronomical Society, 5, 276, 10.3847/2515-5172/ac3dfe
2021 doi
-
[65]
2021 b , Research Notes of the American Astronomical Society, 5, 208, 10.3847/2515-5172/ac2517
Rhea, C., Hlavacek-Larrondo, J., Rousseau-Nepton, L., Vigneron, B., & Guité, L.-S. 2021 b , Research Notes of the American Astronomical Society, 5, 208, 10.3847/2515-5172/ac2517
2021 doi
-
[66]
2020, The Astrophysical Journal, 901, 152, 10.3847/1538-4357/abb0e3
Rhea, C., Rousseau-Nepton, L., Prunet, S., Hlavacek-Larrondo, J., & Fabbro, S. 2020, The Astrophysical Journal, 901, 152, 10.3847/1538-4357/abb0e3
2020 doi
-
[67]
Rhea, C. L. 2020, X-tra Astronomy Tools . https://osf.io/vwcks/
2020
-
[68]
L., Rousseau-Nepton, L., Covington, J., et al
Rhea, C. L., Rousseau-Nepton, L., Covington, J., et al. 2021 c , crhea93/ LUCI : Luci Updates , Zenodo, 10.5281/zenodo.5730149
2021 doi
-
[69]
A., Storchi-Bergmann, T., Zakamska, N
Riffel, R. A., Storchi-Bergmann, T., Zakamska, N. L., & Riffel, R. 2020, Monthly Notices of the Royal Astronomical Society, 496, 4857, 10.1093/mnras/staa1922
2020 doi
-
[70]
P., Robert, C., et al
Rousseau-Nepton, L., Martin, R. P., Robert, C., et al. 2019, Monthly Notices of the Royal Astronomical Society, 489, 5530, 10.1093/mnras/stz2455
2019 doi
-
[71]
C., Ford, Jr., W
Rubin, V. C., Ford, Jr., W. K., Peterson, C. J., & Oort, J. H. 1977, The Astrophysical Journal, 211, 693, 10.1086/154979
1977 doi
-
[72]
M., Shields, J
Sabra, B. M., Shields, J. C., & Filippenko, A. V. 2000, The Astrophysical Journal, 545, 157, 10.1086/317793
2000 doi
-
[73]
2008, Cold gas in the Perseus cluster core: Excitation of molecular gas in filaments, 10.1051/0004-6361:200809493
Salomé, P., Combes, F., Revaz, Y., et al. 2008, Cold gas in the Perseus cluster core: Excitation of molecular gas in filaments, 10.1051/0004-6361:200809493
2008 doi
-
[74]
S., Fabian, A
Sanders, J. S., Fabian, A. C., Allen, S. W., & Schmidt, R. W. 2004, Monthly Notices of the Royal Astronomical Society, 349, 952, 10.1111/j.1365-2966.2004.07576.x
2004
-
[75]
J., Dopita, M
Scharwächter, J., McGregor, P. J., Dopita, M. A., & Beck, T. L. 2013, Monthly Notices of the Royal Astronomical Society, 429, 2315, 10.1093/mnras/sts502
2013 doi
-
[76]
W., Fabian, A
Schmidt, R. W., Fabian, A. C., & Sanders, J. S. 2002, Monthly Notices of the Royal Astronomical Society, 337, 71, 10.1046/j.1365-8711.2002.05804.x
2002
-
[77]
C., Mateus, A., Sodré, L., & Asari, N
Stasińska, G., Fernandes, R. C., Mateus, A., Sodré, L., & Asari, N. V. 2006, Monthly Notices of the Royal Astronomical Society, 371, 972, 10.1111/j.1365-2966.2006.10732.x
2006
-
[78]
C., Erb, D
Steidel, C. C., Erb, D. K., Shapley, A. E., et al. 2010, The Astrophysical Journal, 717, 289, 10.1088/0004-637X/717/1/289
2010 doi
-
[79]
2015, Monthly Notices of the Royal Astronomical Society, 448, 895, 10.1093/mnras/stu2762
Suresh, J., Bird, S., Vogelsberger, M., et al. 2015, Monthly Notices of the Royal Astronomical Society, 448, 895, 10.1093/mnras/stu2762
2015 doi
-
[80]
R., Combes, F., Oonk, J
Tremblay, G. R., Combes, F., Oonk, J. B. R., et al. 2018, The Astrophysical Journal, 865, 13, 10.3847/1538-4357/aad6dd
2018 doi
-
[81]
S., & Werk, J
Tumlinson, J., Peeples, M. S., & Werk, J. K. 2017, Annual Review of Astronomy and Astrophysics, 55, 389, 10.1146/annurev-astro-091916-055240
2017 doi
-
[82]
L., et al
Vale Asari, N., Wild, V., de Amorim, A. L., et al. 2020, Monthly Notices of the Royal Astronomical Society, 498, 4205, 10.1093/mnras/staa2557
2020 doi
-
[83]
Veilleux, S., & Osterbrock, D. E. 1987, The Astrophysical Journal Supplement Series, 63, 295, 10.1086/191166
1987 doi
-
[84]
L., et al
Vigneron, B., Hlavacek-Larrondo, J., Rhea, C. L., et al. 2024, ApJ, 962, 96, 10.3847/1538-4357/ad0fd8
2024 doi
-
[85]
E., et al
Virtanen, P., Gommers, R., Oliphant, T. E., et al. 2020, Nat Methods, 17, 261, 10.1038/s41592-019-0686-2
2020 doi
-
[86]
M., Bryan, G
Voit, G. M., Bryan, G. L., O’Shea, B. W., & Donahue, M. 2015, ApJ, 808, L30, 10.1088/2041-8205/808/1/L30
2015 doi
-
[87]
T., et al
Werner, N., Simionescu, A., Million, E. T., et al. 2010, Feedback under the microscope II : heating, gas uplift, and mixing in the nearest cluster core, 10.1111/j.1365-2966.2010.16755.x
2010
-
[88]
Werner, N., Oonk, J. B. R., Sun, M., et al. 2014, Monthly Notices of the Royal Astronomical Society, 439, 2291, 10.1093/mnras/stu006
2014 doi
-
[89]
J., Edge, A
Wilman, R. J., Edge, A. C., & Johnstone, R. M. 2005, Monthly Notices of the Royal Astronomical Society, 359, 755, 10.1111/j.1365-2966.2005.08956.x
2005
-
[90]
Wright, E. L. 2006, Publications of the Astronomical Society of the Pacific, 118, 1711, 10.1086/510102
2006 doi
-
[91]
P.-Y., Lim, J., Ohyama, Y., Chan, J
Yu, A. P.-Y., Lim, J., Ohyama, Y., Chan, J. C.-C., & Broadhurst, T. 2015, ApJ, 814, 101, 10.1088/0004-637X/814/2/101
2015 doi
-
[92]
2013, ApJ, 773, 16, 10.1088/0004-637X/773/1/16
Zhu, G., & Ménard, B. 2013, ApJ, 773, 16, 10.1088/0004-637X/773/1/16
2013 doi
Reviewed August 8, 2026 · model on record in the stance chip above.
Discussion (0). Continue with ORCID to comment.