Advanced Signal Reconstruction in Tunka-Rex with Matched Filtering and Deep Learning
Pith reviewed 2026-05-25 15:25 UTC · model grok-4.3
The pith
Matched filtering and autoencoder neural networks reconstruct Tunka-Rex radio pulses at lower signal-to-noise ratios than prior methods.
A machine-rendered reading of the paper's core claim, the machinery that carries it, and where it could break.
Core claim
Matched filtering using signal templates and an autoencoder neural network can extract the position and amplitude of short radio pulses from background-dominated traces recorded by Tunka-Rex, thereby lowering the detection threshold and increasing analysis efficiency for cosmic-ray air-shower events.
What carries the argument
Matched filtering with pulse templates combined with an autoencoder neural network that processes time-domain traces to recover signal parameters.
If this is right
- Detection threshold for Tunka-Rex cosmic-ray events is reduced.
- Analysis efficiency rises because more traces yield usable reconstructions.
- Signal parameters extracted at low signal-to-noise ratios become more reliable.
- A working example of deep neural network reconstruction is demonstrated on Tunka-Rex data.
Where Pith is reading between the lines
- The same reconstruction pipeline could be transferred to other sparse radio arrays to raise their collected event statistics.
- Real-time implementation of these filters might allow earlier rejection of noise-only triggers during data taking.
- Further tests on traces from different antenna spacings would show how much the gain depends on array geometry.
Load-bearing premise
The matched-filter templates and autoencoder can recover true pulse position and amplitude from noise-dominated traces without adding systematic offsets or distortions.
What would settle it
A test that injects simulated pulses of known amplitude and timing into real Tunka-Rex background traces at decreasing signal strengths and checks whether the reconstructed values remain unbiased relative to the injected inputs.
Figures


read the original abstract
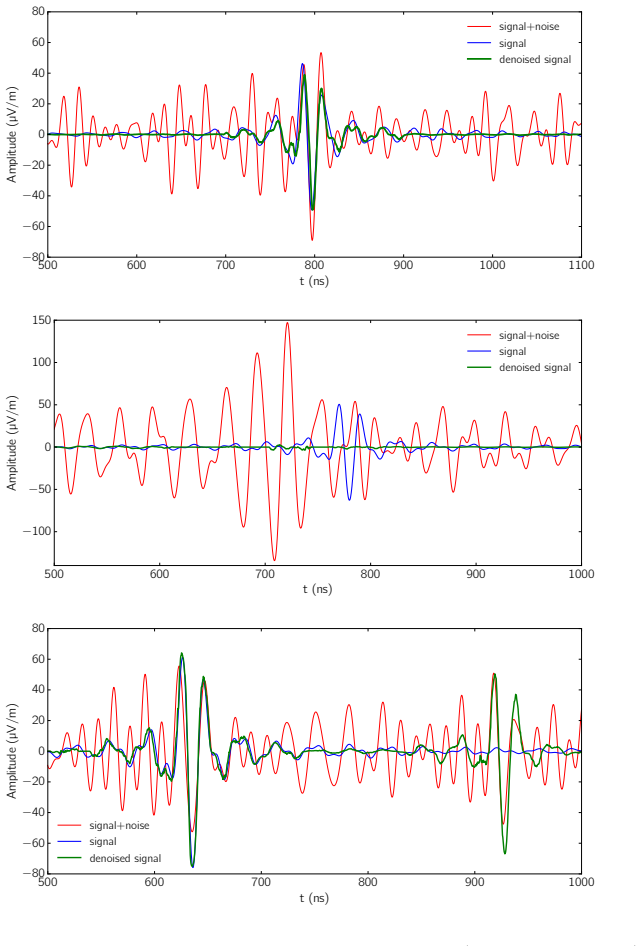
The Tunka Radio Extension (Tunka-Rex) is a digital antenna array operating in the frequency band of 30-80 MHz, measuring the radio emission of air-showers induced by ultra-high energy cosmic rays. Tunka-Rex is co-located with the TAIGA experiment in Siberia and consists of 63 antennas, 57 of them in a densely instrumented area of about 1km2. The signals from the air showers are short pulses, which have a duration of tens of nanoseconds and are recorded in traces of about 5{\mu}s length. The Tunka-Rex analysis of cosmic-ray events is based on the reconstruction of these signals, in particular, their positions in the traces and amplitudes. This reconstruction suffers at low signal-to-noise ratios, i.e. when the recorded traces are dominated by background. To lower the threshold of the detection and increase the efficiency, we apply advanced methods of signal reconstruction, namely matched filtering and deep neural networks with autoencoder architecture. In the present work we show the comparison between the signal reconstructions obtained with these techniques, and give an example of the first reconstruction of the Tunka-Rex signals obtained with a deep neural networks.
Editorial analysis
A structured set of objections, weighed in public.
Referee Report
Summary. The paper describes the Tunka-Rex radio array for cosmic-ray air-shower detection and applies matched filtering together with an autoencoder-based deep neural network to reconstruct pulse position and amplitude in background-dominated traces. It claims these techniques lower the detection threshold and increase analysis efficiency relative to standard methods, and presents a comparison of the reconstructions plus one example of DNN output on real data.
Significance. If the claimed improvement in low-SNR reconstruction holds without introducing uncontrolled bias, the work would enlarge the usable event sample for Tunka-Rex and similar sparse radio arrays, directly benefiting energy and composition studies of ultra-high-energy cosmic rays.
major comments (2)
- [Abstract] Abstract: the central claim that matched filtering and the autoencoder lower the detection threshold rests on the premise that both recover pulse parameters without systematic offsets larger than the statistical gain; no bias (mean residual vs. injected SNR), pull distributions, or efficiency curves versus SNR are reported for either method on simulated or real low-SNR events.
- [Abstract / methods description] The description of the DNN architecture and training does not specify the loss function, regularization, or validation procedure used to ensure that the network does not shift the reconstructed amplitude or timing at the lowest SNRs where the threshold reduction is claimed.
Simulated Author's Rebuttal
We thank the referee for the careful and constructive review. The comments correctly identify gaps in the quantitative validation of the reconstruction methods and in the description of the DNN training procedure. We address each point below and will revise the manuscript accordingly.
read point-by-point responses
-
Referee: [Abstract] Abstract: the central claim that matched filtering and the autoencoder lower the detection threshold rests on the premise that both recover pulse parameters without systematic offsets larger than the statistical gain; no bias (mean residual vs. injected SNR), pull distributions, or efficiency curves versus SNR are reported for either method on simulated or real low-SNR events.
Authors: We agree that explicit demonstration of negligible bias is required to substantiate the threshold-lowering claim. The current manuscript shows qualitative comparisons and one real-data example but does not contain bias plots, pull distributions, or efficiency curves versus SNR. In the revision we will add these metrics for both methods, computed on simulated traces with injected pulses across a range of SNRs. For real data we will explicitly note the absence of independent ground truth and limit claims to consistency checks with the standard reconstruction. revision: yes
-
Referee: [Abstract / methods description] The description of the DNN architecture and training does not specify the loss function, regularization, or validation procedure used to ensure that the network does not shift the reconstructed amplitude or timing at the lowest SNRs where the threshold reduction is claimed.
Authors: The referee is correct that these training details are missing. We will expand the methods section to state the loss function (mean-squared error on pulse amplitude and timing), regularization (dropout layers), and validation protocol (separate simulated training/validation/test sets with monitoring of mean residuals on the validation set at low SNR). These additions will document that no systematic offsets were introduced at the SNRs relevant to the claimed threshold improvement. revision: yes
Circularity Check
No circularity: methods applied to external data without self-referential derivation
full rationale
The paper applies matched filtering and autoencoder DNNs to Tunka-Rex traces for pulse reconstruction. No derivation chain, fitted-input predictions, self-citation load-bearing steps, or ansatz smuggling is present. The abstract and described comparisons treat the techniques as external tools applied to independent experimental data; efficiency claims rest on empirical comparison rather than any reduction to the paper's own inputs by construction. This is the expected non-finding for an applied-methods instrumentation paper.
Axiom & Free-Parameter Ledger
Reference graph
Works this paper leans on
-
[1]
Radio detection of Cosmic-Ray Air Showers and High-Energy Neutrinos,
Schr¨ oder, Frank G., “Radio detection of Cosmic-Ray Air Showers and High-Energy Neutrinos,” Prog. Part. Nucl. Phys. , vol. 93, pp. 1–68, 2017
work page 2017
-
[2]
Measurement of cosmic-ray air showers with the Tunka Radio Extension (Tunka-Rex),
P. A. Bezyazeekov et al. , “Measurement of cosmic-ray air showers with the Tunka Radio Extension (Tunka-Rex),” Nucl. Instrum. Meth. , vol. A802, pp. 89–96, 2015
work page 2015
-
[3]
The TAIGA experiment: From cosmic-ray to gamma-ray as- tronomy in the Tunka valley,
N. Budnev et al. , “The TAIGA experiment: From cosmic-ray to gamma-ray as- tronomy in the Tunka valley,”Nucl. Instrum. Meth. , vol. A845, pp. 330–333, 2017
work page 2017
-
[4]
Tunka Advanced Instrument for cosmic rays and Gamma As- tronomy,
D. Kostunin et al. , “Tunka Advanced Instrument for cosmic rays and Gamma As- tronomy,” in 18th International Baikal Summer School on Physics of Elementary Particles and Astrophysics: Exploring the Universe through multiple messengers (ISAPP-Baikal 2018) Bolshie Koty, Lake Baikal, Russia, July 12-21, 2018 , 2019
work page 2018
-
[5]
P. A. Bezyazeekov et al. , “Radio measurements of the energy and the depth of the shower maximum of cosmic-ray air showers by Tunka-Rex,” JCAP, vol. 1601, no. 01, p. 052, 2016
work page 2016
-
[6]
Reconstruction of cosmic ray air showers with Tunka- Rex data using template fitting of radio pulses,
P. A. Bezyazeekov et al. , “Reconstruction of cosmic ray air showers with Tunka- Rex data using template fitting of radio pulses,” Phys. Rev. , vol. D97, no. 12, p. 122004, 2018
work page 2018
-
[7]
Simulating radio emission from air showers with CoREAS,
T. Huege, M. Ludwig, and C. James, “Simulating radio emission from air showers with CoREAS,” AIP Conf.Proc., vol. 1535, p. 128, 2013
work page 2013
-
[8]
Representation learning: A review and new perspectives,
Y. Bengio, A. Courville, and P. Vincent, “Representation learning: A review and new perspectives,” IEEE Trans. Pattern Anal. Mach. Intell. , vol. 35, pp. 1798– 1828, Aug. 2013
work page 2013
-
[9]
Chollet, “keras.” https://github.com/fchollet/keras, 2015
F. Chollet, “keras.” https://github.com/fchollet/keras, 2015
work page 2015
-
[10]
TensorFlow: Large-scale machine learning on heterogeneous sys- tems,
M. Abadi et al. , “TensorFlow: Large-scale machine learning on heterogeneous sys- tems,” 2015. Software available from tensorflow.org
work page 2015
-
[11]
P. Abreu et al. , “Advanced functionality for radio analysis in the Offline soft- ware framework of the Pierre Auger Observatory,” Nucl.Instrum.Meth., vol. A635, pp. 92–102, 2011
work page 2011
-
[12]
Imporoving reconstrucion methods for radio measure- ments with Tunka-Rex,
P. A. Bezyazeekov et al. , “Imporoving reconstrucion methods for radio measure- ments with Tunka-Rex,” in 25th European Cosmic Ray Symposium (ECRS 2016) Turin, Italy, September 04-09, 2016, eConf C16-09-04.3 , 2017
work page 2016
-
[13]
Improved measurements of the energy and shower maximum of cosmic rays with Tunka-Rex,
D. Kostunin et al. , “Improved measurements of the energy and shower maximum of cosmic rays with Tunka-Rex,” PoS, vol. ICRC2017, p. 400, 2017
work page 2017
-
[14]
M. Erdmann, F. Schlter, and R. Smida, “Classification and Recovery of Radio Sig- nals from Cosmic Ray Induced Air Showers with Deep Learning,” JINST, vol. 14, no. 04, p. P04005, 2019
work page 2019
-
[15]
A. Beisenova et al., “Search for EAS radio-emission at the Tien-Shan shower instal- lation at a height of 3340 m above sea level,” EPJ Web Conf. , vol. 145, p. 11003, 2017
work page 2017
discussion (0)
Sign in with ORCID, Apple, or X to comment. Anyone can read and Pith papers without signing in.