REVIEW 3 major objections 4 minor 294 references
Six shared enrichment patterns reproduce 22-element abundances across 426 red giant stars.
Reviewed by Pith at T0; open to challenge. T0 means a machine referee read the full paper against a public rubric. the ladder, T0–T4 →
T0 review · deepseek-v4-flash
2026-08-01 08:45 UTC pith:QPDBJ7BF
load-bearing objection Solid new HARPS/Korg red-giant abundance catalogue worth refereeing, but the latent-model 'generative' claim overstates an in-sample NMF reconstruction and the abstract's 0.02 dex precision figure should not be read as accuracy. the 3 major comments →
HARPS Abundances with Korg I: 22 Element Abundances for 426 Red Giant Stars
The pith
A machine-rendered reading of the paper's core claim, the machinery that carries it, and where it could break.
Core claim
The central discovery is the collapse of 22 element abundances into a generative 6-parameter latent-variable model. Using non-negative matrix factorization, the abundances X are written as X = f × P, where P is a set of shared enrichment channels and f is the per-star fractional contribution; six channels reproduce the abundances of the 214 stars that have all 22 elements measured, with a median reduced chi-squared of about 6. This is presented as evidence that red-giant abundance space is low-dimensional, though the imperfect fit indicates that individual elements also encode higher-order information. The paper further claims that element-element gradients, measured relative to reference el
What carries the argument
The latent-variable factorization X = f × P (non-negative matrix factorization) is the central object that carries the low-dimensionality claim: it decomposes the 22 measured abundances into a small set of population-shared enrichment patterns, with per-star fractions, and the reduced chi-squared of its reconstruction is the paper's headline diagnostic. The second piece of machinery is Korg, a 1D LTE spectral-synthesis code that uses automatic differentiation to fit stellar parameters and line-by-line abundances to the HARPS spectra; this produces the catalogue values on which everything else depends. The third is the inter-element gradient analysis, fitting Δ[X/H]/Δ[ref/H] with an orthogona
Load-bearing premise
The catalogue's zero-points are accurate: the ~0.02 dex figure is repeat-observation precision, while systematic offsets of 0.1–0.25 dex due to 1D LTE modelling and atomic data are reported for several elements, and if those systematics are underestimated, the element gradients and the inferred six-channel structure are built on biased inputs.
What would settle it
Re-analyse a subset of these 426 stars with non-LTE and 3D model atmospheres, or with line lists whose oscillator strengths are independently measured; if the Na, Zn, Cr, and metallicity offsets disappear while the element-element trends shift by more than about 0.1 dex, the specific gradients and the latent channels would not be robust. Alternatively, fit the same six-channel factorization to an independent sample of main-sequence stars from the same instrument: if the median reduced chi-squared is far above 6, the low-dimensional claim is not universal.
If this is right
- If abundance space is truly six-dimensional, surveys can prioritize a sparse set of well-chosen elements (the paper highlights Ti, Fe, Zr, and Ba for their discriminating power) and still recover the bulk of the enrichment structure.
- The catalogue provides a benchmark set of red-giant abundances that can be used to train data-driven models and to cross-check the abundance scales of larger surveys.
- The inter-element gradients give empirical constraints on galactic chemical evolution models, including a direct indication that r-process material (Eu) is not produced in lockstep with a single nucleosynthetic family.
- The nine neutron-capture elements at ~0.02 dex internal precision add leverage on s-process and r-process yields that moderate-resolution surveys cannot provide.
- The six latent channels can be tentatively identified with physical sources (massive stars and Type II supernovae, low- and intermediate-mass AGB stars, Type Ia supernovae), allowing chemical evolution models to be tested pattern-by-pattern rather than element-by-element.
Where Pith is reading between the lines
- If the six-channel model is universal, the same six patterns should reproduce the abundances of an independent sample, such as the main-sequence stars the authors say they will analyse in the second paper of the series; failure there would mean the low-dimensional structure is specific to red giants or to this sample.
- The large gap between the formal parameter sensitivities (σ_log g ≈ 0.17–0.27 dex in Appendix B) and the tiny repeat-observation scatter implies that the catalogue is precise but its zero-points may drift; a non-LTE or 3D re-analysis of a subset could test whether the reported 0.1–0.25 dex offsets (Na, Zn, Cr, metallicity) are physical or modelling artifacts, and whether the six latent channels su
- The gradient analysis is restricted to the 214 stars with all 22 elements, a subsample concentrated in the thin disk; the inferred production efficiencies and the claim of multiple r-process sites may not extend to thick-disk or metal-poor populations, so extending the analysis would test the universality of the pattern.
- A concrete prediction of the multi-site r-process claim is that Eu should show residual scatter beyond what the alpha-element channels explain; comparing this residual against neutron-star-merger yield ratios in chemical evolution models would sharpen or refute the interpretation.
Editorial analysis
A structured set of objections, weighed in public.
Referee Report
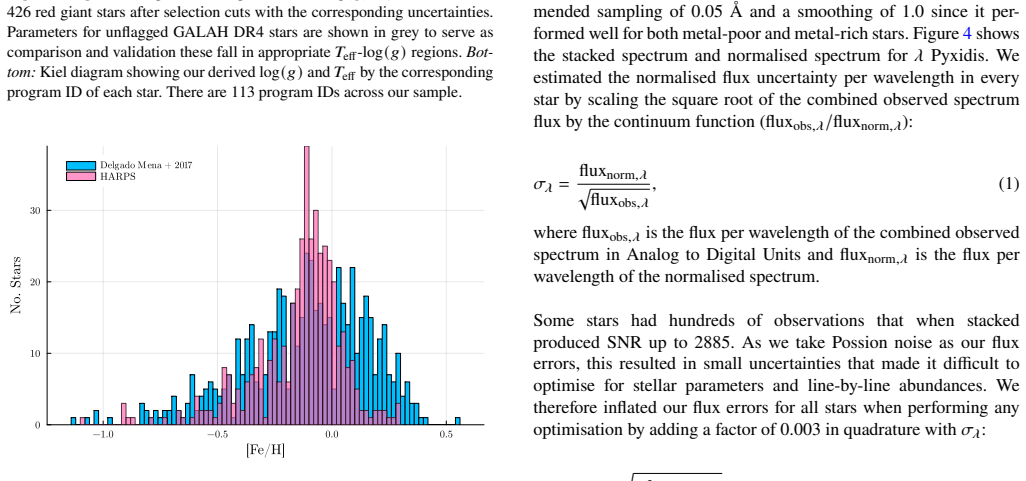
Summary. The paper presents a catalogue of stellar parameters and 22 element abundances for 426 red giants observed with HARPS, derived using the Korg spectral synthesis code. The authors describe their data selection, radial-velocity corrections, continuum normalisation, line-by-line abundance analysis, and uncertainty calibration via repeat observations. They compare their parameters and abundances with literature samples, report inter-element abundance gradients, and propose a non-negative matrix factorisation latent-variable model (Equation 6) in which 22 abundances are represented as a product of six shared patterns and per-star fractions. The central claims are that the catalogue achieves ~0.02 dex median internal precision and that the six-channel latent model 'accurately generates' the abundances with a median reduced chi-squared of 6, implying a low-dimensional chemical space.
Significance. If the catalogue is accurate at the claimed level, it would be a valuable high-resolution benchmark for red-giant chemical abundances, complementing lower-resolution surveys and providing a self-consistent set of measurements for 22 elements including nine neutron-capture species. The paper's strengths include the use of high-quality HARPS spectra, a transparent line-selection procedure, repeat-observation precision estimates, and extensive comparisons with literature samples. The latent-model analysis is also a useful demonstration that much of the variance in the abundance matrix can be compressed to a few components, although—as discussed below—the 'generative' claim is not supported by the analysis as presented.
major comments (3)
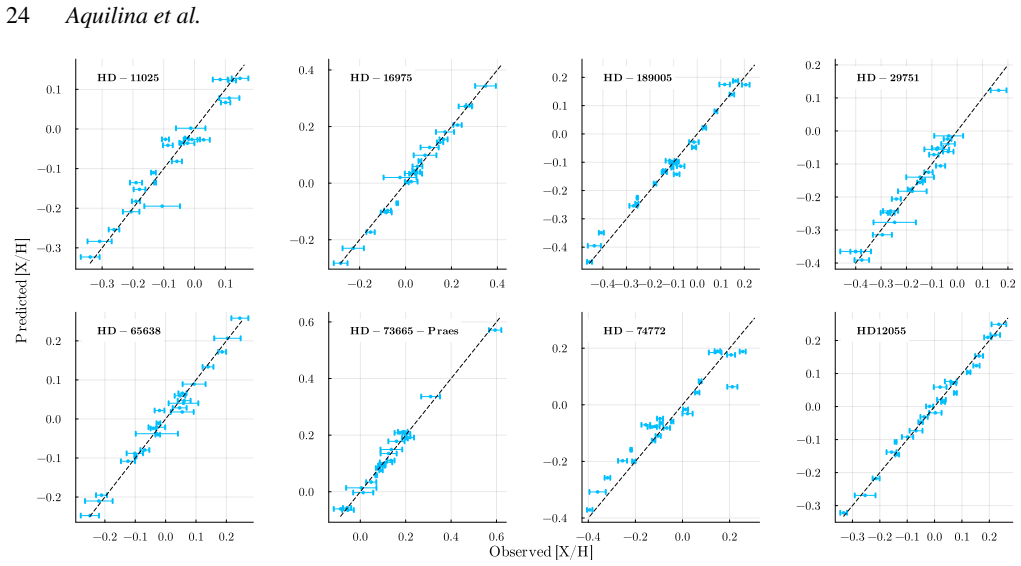
- [§4.2, Eq. (6), Fig. 22] The claim that the six-channel model 'accurately generates' the abundances is circular as stated. The matrices P and f in X = f×P are fitted by NMF to the same 214-star abundance matrix that Figure 22 calls 'predicted'. This is a rank-6 reconstruction of the input data, not an independent generative model. The optimal number of channels m = 6 is also selected using the in-sample reduced chi-squared. Moreover, the median reduced chi-squared of 5.8 is not small in absolute terms; it indicates that the model leaves substantial variance unexplained given the quoted tiny uncertainties. To support the 'generative' and 'low-dimensional subspace' claims, the authors should either perform out-of-sample validation (e.g., train on a subset of stars and evaluate on held-out stars) or explicitly reframe the analysis as a lossy dimensionality-reduction exercise.
- [§2.6, Appendix B, §3.4] The catalogue's headline precision (~0.02 dex from repeat observations) measures internal repeatability, not accuracy. The paper's own Appendix B reports formal parameter sensitivities of σ_log g = 0.17–0.27 dex and abundance sensitivities above 0.04 dex for many neutron-capture species (e.g., Nd II up to 0.37 dex in Table B2). Section 3.4 documents zero-point offsets of 0.1–0.25 dex for [Fe/H], Na, Zn, Cr, and Ni, attributed to 1D LTE and atomic data. These systematics propagate directly into the inter-element gradients (Figure 20) and into the latent model, because both are fit to the reported abundances under the assumption of small uncertainties. The abstract and conclusions should not present 0.02 dex as the relevant error for the science claims without a systematic-error budget. At minimum, the authors should quantify how reported gradients and latent-space structure change under t
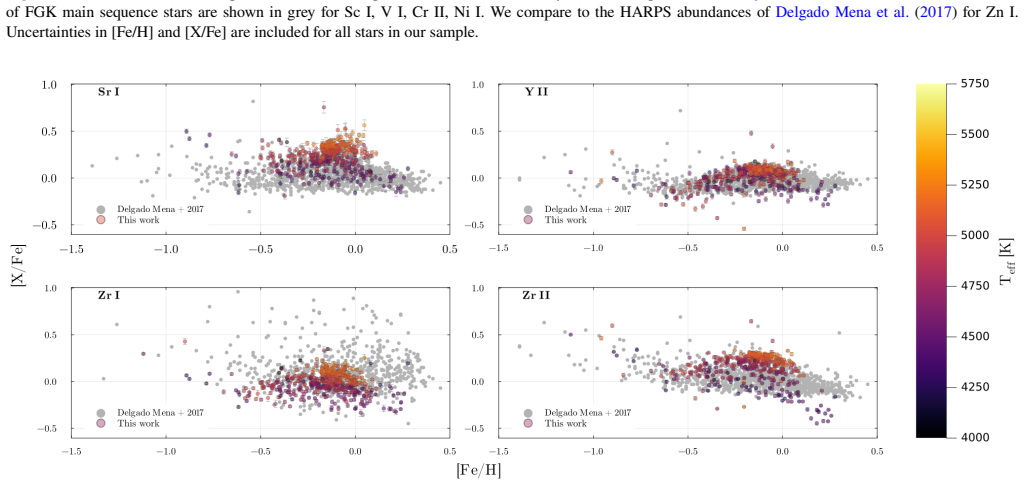
- [§4.1, Fig. 20] The inter-element gradients are derived with an orthogonal-distance regression that assumes the x- and y-axis uncertainties are uncorrelated. In this catalogue, both axes are [X/H] measurements from the same stars, same spectra, and same pipeline; the uncertainties are therefore strongly correlated (e.g., through the common stellar parameters and continuum normalisation). This can bias the reported slopes and make their uncertainties underestimated. A sensitivity test using correlated uncertainties, or at least a discussion of the expected sign and magnitude of the bias, is needed before the gradients can serve as quantitative nucleosynthetic constraints.
minor comments (4)
- [§3.1, Fig. 8 caption] The text says the median difference between [Fe/H] and [M/H] is 0.02 dex, while the Figure 8 caption says −0.01 dex. Please reconcile.
- [§2.6, Table 4] The text says elements with at least 5 lines are Ti I, V I, Fe I, and Y II, but the Table 4 caption includes Nd II. Table 1 lists only 2 Nd II lines. Correct the inconsistency.
- [§4.2, Fig. 23] The physical interpretation of the latent patterns is offered tentatively, which is appropriate, but the phrase 'non-physical signals' in channels 2 and 4 should be clarified: do the authors mean that the pattern has no obvious single nucleosynthetic origin, or that it is an artifact of the NMF algorithm?
- [§2.5.1, Table 1] For several elements only one or two lines are used. The per-star abundances for such elements should be flagged more prominently in the catalogue tables, since their line-to-line systematic errors cannot be assessed internally.
Circularity Check
The latent-model 'generation' is an in-sample NMF reconstruction of the same 214-star matrix; the six-channel generative claim reduces to a fit, while the catalogue itself is externally compared.
specific steps
-
fitted input called prediction
[Section 4.2 (Eq. 6, Figs 22–23); Abstract]
"We used the element abundances of the 214 stars with all elements measured to construct a latent model representation with non negative matrix factorisation described in Ness et al. (submitted). This parameterises the abundances for the 214 stars as X=f×P (6) ... The generated abundances from the latent model in Equation 6, obtained by multiplying the solved matrix P by matrix f for a selection of our HARPS stars, is displayed in Figure 22."
P and f are both solved from the same 214-star abundance matrix that is subsequently labelled 'generated'. The quoted median χ²_reduced=6 is the training residual of a rank-6 factorization of those exact data, with m=6 chosen from the in-sample χ². Hence 'this model accurately generates the abundances' is a restatement of the factorization used to fit the data, not an out-of-sample or independent prediction.
-
self citation load bearing
[Section 4.2 (choice of channel number; 'Ness et al. (submitted)')]
"In Ness et al. (submitted), they found that m=4 latent patterns generates 16 element abundances ... with an overall reduced χ²_mode ∼1.2 ... At m=6, the χ² value drops below 1 in their study, indicating that using more latent variables than m=5 leads to overfitting."
The paper's low-dimensionality claim rests on an unpublished manuscript with overlapping authorship (Ness), cited for the method and the overfitting threshold but not listed in the references, machine-checked, or externally reproduced. The present choice m=6 is then justified by the same in-sample χ² as the 'generation' test, so the central generative claim depends on an unverifiable self-citation chain for its framework.
full rationale
The catalogue construction (Sections 2–3) is not circular: parameters and abundances are externally compared (e.g., Adibekyan et al. 2012, 2015; Gaia benchmark stars; Delgado Mena et al. 2017), and the repeat-observation uncertainties are empirical scatter. The Appendix B scale-accuracy caveats (σ_logg = 0.17–0.27 dex; neutron-capture sensitivities >0.04 dex, Nd II to 0.37 dex) are a correctness/accuracy risk, not a circularity. The central circularity is the latent model in Section 4.2: equation (6) X=f×P is solved from the same 214-star matrix that is then called 'generated' (Figure 22), with m=6 selected from the in-sample reduced χ². The abstract's 'generative 6-parameter model accurately generates the abundances' therefore reduces to a rank-6 reconstruction of the input data, with no held-out or independent test. The framing also leans on an unpublished 'Ness et al. (submitted)' with overlapping authorship and no reference entry, so the low-dimensionality claim is not independently verifiable from the manuscript alone.
Axiom & Free-Parameter Ledger
free parameters (6)
- NMF latent patterns P (6×22) and per-star fractions f (214×6) =
6 channels; reduced χ² 6.8 (m=4) to 5.8 (m=6)
- Line-by-line abundance temperature-correction polynomials =
Second-order polynomial per line; shift Δx_i = x_i,ref − x_i,poly
- Flux error inflation floor =
0.003 added in quadrature
- NMF latent dimension m =
6
- Empirical SNR-uncertainty models =
Bins of width 30 (parameters) and 5 (lines); smoothed across 10 stars
- Sample and line selection thresholds =
SNR≥100, vsini<15 km/s, vmic<5 km/s, rms<0.1, |[X/Fe]|≤1, Mg I Teff<4750 K removed
axioms (8)
- domain assumption Korg's 1D LTE MARCS synthesis models the observed lines accurately enough for abundance zero-points.
- domain assumption Adopted GaiaESO/linemake atomic data (oscillator strengths, hyperfine splitting) are correct for the selected lines.
- domain assumption Lines of one element should follow the same abundance-temperature trend, so per-line offsets can be shifted onto a reference line.
- domain assumption Red giant surface abundances equal birth abundances for elements other than possibly Na, Al and Mg.
- domain assumption Inter-element abundance relations are linear over the sampled metallicity range.
- domain assumption The 214 stars with all 22 elements measured are representative for gradient and latent-model inference.
- domain assumption Non-negative matrix factorization channels correspond tentatively to physical enrichment sources.
- domain assumption Repeat-observation scatter is the appropriate uncertainty for model comparison.
read the original abstract
Large stellar surveys have revealed the global abundance structure of the Milky Way, but small high-fidelity spectral samples offer a critical complement of nucleosynthetic depth. We aim to access the encoded information in an ensemble of abundances by leveraging highest-quality spectra. We used HARPS spectra (R=115,000) to determine (Teff, log(g), [M/H], vmic and vsini) and 22 element abundances (Na, Mg, Al, Si, K, Ca, Sc, Ti, V, Cr, Fe, Ni, Zn, Sr, Y, Zr, Mo, Ba, La, Ce, Nd and Eu) for 426 red giant stars at a median internal precision of $\sim$0.02 dex evaluated from analysing repeat observations of a subset of stars. Stellar parameters and line-by-line abundances were obtained using the modern spectral synthesis code Korg -- the first time it has been used for HARPS. Comparisons with the literature reveal good overall agreement. A minor 0.1 dex offset in metallicity and specific discrepancies in individual element abundances are attributed to local thermal equilibrium assumptions and inaccuracies in atomic data. We show that 22 individual elements can be collapsed into a generative 6-parameter latent-variable model of shared enrichment patterns expressed in different per-star fractions; this model accurately generates the abundances with a median $\chi_{reduced}^2 = 6$. We report element gradients with respect to selected elements from different nucleosynthetic families. These gradients are a measure of inter-element production efficiencies and indicate multiple r-process production sites. Our analysis shows that abundances occupy a low-dimensional subspace, but joint (gradient-based) information encodes nucleosynthetic signatures. We have developed a Korg-pipeline to apply across evolutionary states on high-resolution spectra to provide our precision catalogue to serve as empirical constraints on chemical evolution and as a set of benchmark red giant abundance measurements.
Figures







Reference graph
Works this paper leans on
-
[1]
The Gaia-ESO Survey: Homogenisation of stellar parameters and elemental abundances. , keywords =. doi:10.1051/0004-6361/202345910 , archivePrefix =. 2304.07720 , primaryClass =
-
[2]
Astronomy & Astrophysics , author =
Partition functions and equilibrium constants for diatomic molecules and atoms of astrophysical interest , volume =. Astronomy & Astrophysics , author =. 2016 , pages =. doi:10.1051/0004-6361/201526961 , abstract =
-
[3]
The Journal of Chemical Physics , author =
Gaussian‐2 theory for molecular energies of first‐ and second‐row compounds , volume =. The Journal of Chemical Physics , author =. 1991 , pages =. doi:10.1063/1.460205 , language =
doi:10.1063/1.460205 1991
-
[4]
Revista Mexicana de Astronomia y Astrofisica , author =
Molecular. Revista Mexicana de Astronomia y Astrofisica , author =. 1992 , pages =. doi:1992RMxAA..23..151C , urldate =
1992
-
[6]
Astronomy & Astrophysics , author =
Carbon, oxygen, and iron abundances in disk and halo stars:. Astronomy & Astrophysics , author =. 2019 , pages =. doi:10.1051/0004-6361/201936265 , abstract =
-
[7]
Monthly Notices of the Royal Astronomical Society , author =
Detailed chemical compositions of planet-hosting stars:. Monthly Notices of the Royal Astronomical Society , author =. 2022 , pages =. doi:10.1093/mnras/stac1119 , abstract =
-
[8]
Astronomy & Astrophysics , author =
Stellar dating using chemical clocks and. Astronomy & Astrophysics , author =. 2022 , pages =. doi:10.1051/0004-6361/202141125 , number =
-
[9]
The Astrophysical Journal , author =
Detailed chemical abundances for a benchmark sample of. The Astrophysical Journal , author =. 2022 , pages =. doi:10.3847/1538-4357/ac4891 , number =
-
[10]
Cambresier, Y. and Rosenfeld, L. , year =. On the dissociation of molecules in the atmospheres of the stars of the main sequence , volume =. doi:10.1093/mnras/93.9.710 , journal =
-
[11]
Bond dissociation energies in simple molecules , volume =
Darwent, B deB , year =. Bond dissociation energies in simple molecules , volume =
-
[12]
Publications of the Astronomical Society of the Pacific , author =
Chroma+. Publications of the Astronomical Society of the Pacific , author =. 2021 , note =. doi:10.1088/1538-3873/ac0410 , abstract =
-
[13]
The Astrophysical Journal Supplement Series , author =
A set of partition functions and equilibrium constants for 300 diatomic molecules of astrophysical interest , volume =. The Astrophysical Journal Supplement Series , author =. 1984 , pages =. doi:10.1086/190980 , language =
-
[14]
The Astrophysical Journal , author =. 2010 , pages =. doi:10.1088/0004-637X/711/1/239 , language =
-
[15]
2013 , pages =
Revista Mexicana de Astronomia y Astrofisica , author =. 2013 , pages =
2013
-
[16]
Revista Mexicana de Astronomia y Astrofisica , author =
Analytic partition function for plasmas , volume =. Revista Mexicana de Astronomia y Astrofisica , author =. 2005 , pages =
2005
-
[17]
Astronomy & Astrophysics , author =
Refined diatomic partition functions , volume =. Astronomy & Astrophysics , author =. 1987 , pages =
1987
-
[18]
Astronomy & Astrophysics , author =
Partition functions:. Astronomy & Astrophysics , author =. 2016 , pages =. doi:10.1051/0004-6361/201527209 , abstract =
-
[19]
Journal of Quantitative Spectroscopy and Radiative Transfer , author =
Total internal partition sums for the. Journal of Quantitative Spectroscopy and Radiative Transfer , author =. 2021 , pages =. doi:10.1016/j.jqsrt.2021.107713 , language =
arXiv 2021
-
[20]
Astronomy & Astrophysics , author =
The partition functions of. Astronomy & Astrophysics , author =. 1988 , pages =
1988
-
[21]
Journal of Chemical Theory and Computation , author =
Theoretical. Journal of Chemical Theory and Computation , author =. 2009 , pages =. doi:10.1021/ct900391p , language =
-
[22]
Journal of Quantitative Spectroscopy and Radiative Transfer , author =
High-temperature partition functions, specific heats and spectral radiative properties of diatomic molecules with an improved calculation of energy levels , volume =. Journal of Quantitative Spectroscopy and Radiative Transfer , author =. 2018 , pages =. doi:10.1016/j.jqsrt.2018.02.004 , language =
-
[23]
The Journal of Chemical Physics , author =
Monte. The Journal of Chemical Physics , author =. 2014 , pages =. doi:10.1063/1.4866609 , language =
-
[24]
Journal of Chemical Theory and Computation , author =
Bond. Journal of Chemical Theory and Computation , author =. 2017 , pages =. doi:10.1021/acs.jctc.6b00970 , number =
-
[25]
Science in China Series G: Physics, Mechanics and Astronomy volume , author =
Accurate studies on dissociation energies of diatomic molecules , volume =. Science in China Series G: Physics, Mechanics and Astronomy volume , author =. 2007 , pages =. doi:10.1007/s11433-007-0065-3 , number =
-
[26]
Spectroscopy learning:. MethodsX , author =. 2020 , pages =. doi:10.1016/j.mex.2020.101127 , language =
arXiv 2020
-
[27]
Science China Physics, Mechanics & Astronomy , author =
Method for studying diatomic rovibrational spectra at a given vibrational state , volume =. Science China Physics, Mechanics & Astronomy , author =. 2019 , pages =. doi:10.1007/s11433-018-9311-3 , language =
-
[28]
The Journal of Chemical Physics , author =
Gaussian‐1 theory:. The Journal of Chemical Physics , author =. 1989 , pages =. doi:10.1063/1.456415 , language =
-
[30]
The Journal of Physical Chemistry , author =
Intrinsic. The Journal of Physical Chemistry , author =. 1995 , pages =. doi:10.1021/j100012a005 , language =
-
[31]
Accounts of Chemical Research , author =
Predissociation. Accounts of Chemical Research , author =. 2019 , pages =. doi:10.1021/acs.accounts.8b00526 , language =
-
[32]
The Astrophysical Journal , author =
Diatomic. The Astrophysical Journal , author =. 1963 , pages =. doi:10.1086/147685 , abstract =
-
[33]
The dissociation energies of
-
[34]
Journal of Molecular Spectroscopy , author =
Comparison of actual and linearly extrapolated dissociation energies of diatomic molecules , volume =. Journal of Molecular Spectroscopy , author =. 1971 , pages =. doi:10.1016/0022-2852(71)90254-2 , language =
-
[35]
The Journal of Chemical Physics , author =
Determination of. The Journal of Chemical Physics , author =. 1968 , pages =. doi:10.1063/1.1670082 , language =
-
[36]
Astronomy & Astrophysics , author =
Photodissociation and photoionisation of atoms and molecules of astrophysical interest , volume =. Astronomy & Astrophysics , author =. 2017 , pages =. doi:10.1051/0004-6361/201628742 , abstract =
-
[37]
Monthly Notices of the Royal Astronomical Society , author =
An investigation of. Monthly Notices of the Royal Astronomical Society , author =. 1991 , pages =. doi:10.1093/mnras/253.3.549 , number =
-
[38]
The Journal of Chemical Physics , author =
A comparison of techniques for predicting higher order correlation effects:. The Journal of Chemical Physics , author =. 1999 , pages =. doi:10.1063/1.479202 , language =
-
[39]
Reviews of Modern Physics , author =
Coupled-cluster theory in quantum chemistry , volume =. Reviews of Modern Physics , author =. 2007 , pages =. doi:10.1103/RevModPhys.79.291 , language =
-
[40]
The Journal of Physical Chemistry , author =
Theoretical. The Journal of Physical Chemistry , author =. 2001 , pages =. doi:10.1021/jp010309k , number =
-
[41]
A mathematical and computational review of. Molecular Physics , author =. 2007 , pages =. doi:10.1080/00268970701757875 , language =
-
[42]
The Journal of Chemical Physics , author =
Gaussian-3(. The Journal of Chemical Physics , author =. 1998 , pages =. doi:10.1063/1.477422 , number =
-
[43]
Wiley interdisciplinary reviews , author =
Møller-. Wiley interdisciplinary reviews , author =. 2011 , pages =. doi:10.1002/wcms.58 , number =
doi:10.1002/wcms.58 2011
-
[44]
The Journal of Chemical Physics , author =
Extension of. The Journal of Chemical Physics , author =. 2001 , pages =. doi:10.1063/1.1366337 , number =
-
[45]
The Journal of Physical Chemistry A , author =
The. The Journal of Physical Chemistry A , author =. 2021 , pages =. doi:10.1021/acs.jpca.1c02741 , language =
-
[46]
The Journal of Chemical Physics , author =
Gaussian-4 theory , volume =. The Journal of Chemical Physics , author =. 2007 , pages =. doi:10.1063/1.2436888 , language =
-
[47]
The Journal of Chemical Physics , author =
Gaussian-4 theory using reduced order perturbation theory , volume =. The Journal of Chemical Physics , author =. 2007 , pages =. doi:10.1063/1.2770701 , language =
-
[48]
Astronomy & Astrophysics , author =
Higher metal abundances do not solve the solar problem , volume =. Astronomy & Astrophysics , author =. 2023 , note =. doi:10.1051/0004-6361/202245448 , abstract =
-
[49]
and Phillips, Andrew C
Faber, Sandra M. and Phillips, Andrew C. and Kibrick, Robert I. and Alcott, Barry and Allen, Steven L. and Burrous, Jim and Cantrall, T. and Clarke, De and Coil, Alison L. and Cowley, David J. and Davis, Marc and Deich, William T. S. and Dietsch, Ken and Gilmore, David K. and Harper, Carol A. and Hilyard, David F. and Lewis, Jeffrey P. and McVeigh, Molly ...
2003
-
[50]
Publications of the Astronomical Society of Japan , author =. 2002 , pages =. doi:10.1093/pasj/54.6.819 , abstract =
-
[51]
Astronomy & Astrophysics , author =. 2011 , pages =. doi:10.1051/0004-6361/201015435 , abstract =
-
[52]
The Astronomical Journal , author =
The. The Astronomical Journal , author =. 2013 , note =. doi:10.1088/0004-6256/146/2/32 , abstract =
-
[53]
Bulletin of the American Astronomical Society , author =
State of the. Bulletin of the American Astronomical Society , author =. 2019 , pages =
2019
-
[54]
A higher-than-predicted measurement of iron opacity at solar interior temperatures , volume =. Nature , author =. 2015 , pages =. doi:10.1038/nature14048 , language =
-
[55]
The Journal of Chemical Physics , author =
An augmented coupled cluster method and its application to the first‐row homonuclear diatomics , volume =. The Journal of Chemical Physics , author =. 1985 , pages =. doi:10.1063/1.448718 , language =
-
[56]
Relation between spectroscopic constants with limited. Pramana , author =. 2005 , pages =. doi:10.1007/BF02705289 , number =
-
[57]
EPL (Europhysics Letters) , author =
Morse potential derived from first principles , volume =. EPL (Europhysics Letters) , author =. 2013 , note =. doi:10.1209/0295-5075/101/10009 , abstract =
-
[58]
Opacity calculations for stellar astrophysics , url =
Pain, Jean-Christophe and Gilleron, Franck , month = nov, year =. Opacity calculations for stellar astrophysics , url =. doi:10.5281/zenodo.1590773 , abstract =
-
[59]
The Astrophysical Journal , author =
Effects of. The Astrophysical Journal , author =. 2019 , pages =. doi:10.3847/1538-4357/aaf6b7 , abstract =
-
[60]
Astronomy & Astrophysics , author =
Line-by-line opacity stellar model atmospheres , volume =. Astronomy & Astrophysics , author =. 2004 , pages =. doi:10.1051/0004-6361:20034169 , abstract =
-
[61]
Astronomy & Astrophysics , author =
Microturbulent velocity from stellar spectra: a comparison between different approaches , volume =. Astronomy & Astrophysics , author =. 2011 , pages =. doi:10.1051/0004-6361/201015814 , abstract =
-
[62]
and Monier, R
Gebran, M. and Monier, R. and Royer, F. and Lobel, A. and Blomme, R. , month = dec, year =. Microturbulence in
-
[63]
Monthly Notices of the Royal Astronomical Society , author =
Non-. Monthly Notices of the Royal Astronomical Society , author =. 2012 , pages =. doi:10.1111/j.1365-2966.2012.21686.x , abstract =
arXiv 2012
-
[64]
Astronomy & Astrophysics , author =
Gaia. Astronomy & Astrophysics , author =. 2017 , note =. doi:10.1051/0004-6361/201629833 , abstract =
-
[65]
Astronomy & Astrophysics , author =
Opacity distribution functions for stellar spectra synthesis , volume =. Astronomy & Astrophysics , author =. 2019 , pages =. doi:10.1051/0004-6361/201935723 , abstract =
-
[66]
Astronomy & Astrophysics , author =
An accurate and self-consistent chemical abundance catalogue for the. Astronomy & Astrophysics , author =. 2016 , pages =. doi:10.1051/0004-6361/201628812 , abstract =
-
[67]
Monthly Notices of the Royal Astronomical Society , author =
Non-. Monthly Notices of the Royal Astronomical Society , author =. 2016 , note =. doi:10.1093/mnras/stw2077 , abstract =
-
[68]
Astronomy & Astrophysics , author =
-
[69]
The Astrophysical Journal , author =
Chemical. The Astrophysical Journal , author =. 2004 , pages =. doi:10.1086/381683 , abstract =
-
[70]
Monthly Notices of the Royal Astronomical Society , author =. 2019 , note =. doi:10.1093/mnras/stz2517 , abstract =
-
[71]
Monthly Notices of the Royal Astronomical Society , author =
A. Monthly Notices of the Royal Astronomical Society , author =. 2008 , note =. doi:10.1111/j.1365-2966.2008.13642.x , abstract =
arXiv 2008
-
[72]
Estimation of inaccuracies in oscillator strength calculations , volume =. Physica Scripta , author =. 1996 , pages =. doi:10.1088/0031-8949/1996/T65/014 , urldate =
-
[73]
Brooke, James S. A. and Bernath, Peter F. and Western, Colin M. and Sneden, Christopher and Afşar, Melike and Li, Gang and Gordon, Iouli E. , month = apr, year =. Line
-
[74]
Journal of Quantitative Spectroscopy and Radiative Transfer , author =
Line strengths of rovibrational and rotational transitions in the. Journal of Quantitative Spectroscopy and Radiative Transfer , author =. 2016 , pages =. doi:10.1016/j.jqsrt.2015.07.021 , abstract =
-
[75]
Physical Review Letters , author =
New. Physical Review Letters , author =. 2022 , note =. doi:10.1103/PhysRevLett.129.245001 , abstract =
-
[76]
Canadian Journal of Physics , author =
Oscillator. Canadian Journal of Physics , author =. 2011 , note =. doi:10.1139/p11-030 , abstract =
doi:10.1139/p11-030 2011
-
[77]
Canadian Journal of Physics , author =
Laboratory measurements of oscillator strengths and their astrophysical applications1 1. Canadian Journal of Physics , author =. 2011 , pages =. doi:10.1139/p11-044 , number =
-
[78]
EAS Publications Series , author =
Oscillator. EAS Publications Series , author =. 2010 , pages =. doi:10.1051/eas/1043007 , abstract =
arXiv 2010
-
[79]
Journal of Physics B: Atomic, Molecular and Optical Physics , author =
Landé g-factors along the sixth row of the periodic table , volume =. Journal of Physics B: Atomic, Molecular and Optical Physics , author =. 2010 , pages =. doi:10.1088/0953-4075/43/7/074010 , number =
-
[80]
The Astrophysical Journal , author =
Atomic. The Astrophysical Journal , author =. 2021 , pages =. doi:10.3847/1538-4357/ac2cca , abstract =
-
[81]
Journal of Quantitative Spectroscopy and Radiative Transfer , author =. 2019 , pages =. doi:10.1016/j.jqsrt.2019.106639 , language =
arXiv 2019
-
[82]
Astronomy & Geophysics , author =
Annie. Astronomy & Geophysics , author =. 2016 , pages =. doi:10.1093/astrogeo/atw096 , language =
discussion (0)
Sign in with ORCID, Apple, or X to comment. Anyone can read and Pith papers without signing in.