REVIEW 3 major objections 5 minor 44 references
Signature of jamming under steady shear in dense particulate suspensions
T0 review · 3 major / 5 minor · reviewed 2026-08-14 · deepseek-v4-flash
Pith's one-line read Steady-state flow curves alone can locate the shear-jamming boundary in dense suspensions.
desk verdict Nice idea, underdetermined fit: the WC prediction of σ_SJ is a four-parameter curve through four points per particle size, so the method is not yet validated. read the letter →
The pith
A machine-rendered reading of the paper's core claim, the machinery that carries it, and where it could break.
The reading
What carries the argument
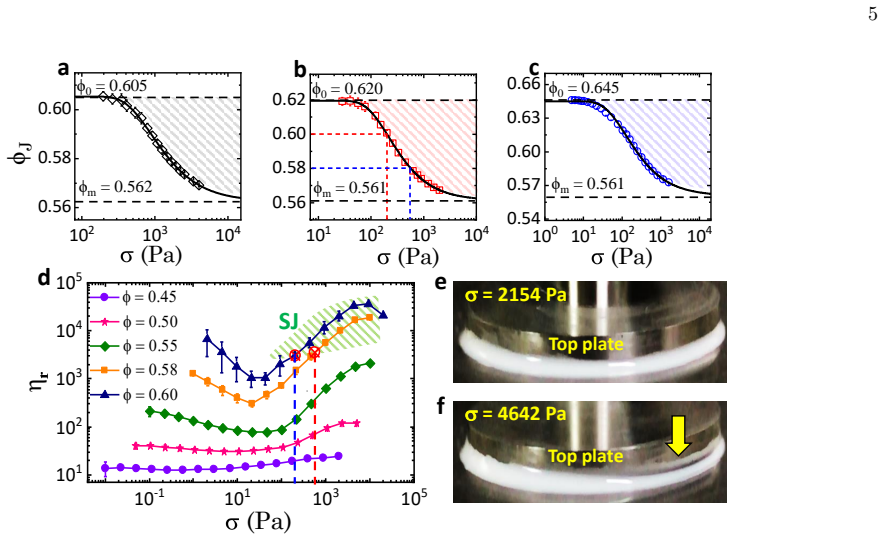
The load-bearing object is the stress-dependent jamming packing fraction phi_J($\sigma$) from the Wyart-Cates model, phi_J($\sigma$) = f($\sigma$) phi_m + [1 - f($\sigma$)] phi_0, where f($\sigma$) is the fraction of frictional particle contacts, taken as a stretched exponential exp(-($\sigma$*/$\sigma$)^$\beta$). The Krieger-Dougherty relation eta_r = (1 - phi/phi_J)^(-2) is fitted to low-phi data at each stress to extract phi_J($\sigma$), and shear jamming is identified at the crossing phi = phi_J($\sigma$). The work of this machinery is to convert ordinary viscosity measurements into a prediction of the stress at which a suspension of given packing fraction becomes a jammed solid.
What would settle it
Run the same PS/PEG suspensions through an independent transient stress protocol, or image the bulk (not just the boundary) for internal crack and shear-band formation, and compare the measured sigma_SJ(phi) with the steady-flow prediction at phi = 0.58 and 0.60; a mismatch larger than experimental error would falsify the claim that steady flow curves alone locate the SJ boundary.
Extended reading notes
Core claim
The paper's central claim is that shear jamming leaves a quantitative signature in steady-state flow curves, despite the jammed state itself being unable to sustain steady flow. At fixed applied stress, viscosity as a function of volume fraction follows the Krieger-Dougherty relation eta_r = (1 - phi/phi_J)^(-2) for phi <= 0.55, but at high stress and high volume fraction the measured viscosity falls below the KD prediction; the paper interprets this shortfall as weakening of the sample by flow-induced failures of a solid-like shear-jammed state. Fitting the Wyart-Cates form phi_J($\sigma$) = f($\sigma$) phi_m + [1 - f($\sigma$)] phi_0 with f($\sigma$) = exp(-($\sigma$* / $\sigma$)^$\beta$) to the extracted jamming fractions, the onset stress for shear jamming is defined by phi = phi_J(sigma_SJ). The claim is supported by the decrease of sigma_SJ with increasing phi, matching transient studies, and by optical imaging that shows sample detachment and edge fracture deep inside the predicted SJ regime.
Load-bearing premise
The load-bearing premise is that the Krieger-Dougherty formula fitted to the lower packing fractions (phi = 0.45-0.55) remains the correct baseline at higher phi, so the shortfall at phi = 0.58 and 0.60 is a physical consequence of shear-jamming failures rather than an artifact of the fitting range, wall slip, edge fracture, or breakdown of the formula itself.
Editorial extensions
If this is right
- For a fixed packing fraction, sigma_SJ can be obtained from steady-state rheology alone, avoiding the need for transient or oscillatory protocols.
- sigma_SJ decreases as phi increases, matching the trend reported in transient shear-jamming experiments.
- The fitted phi_m ~ 0.56 across all particle sizes, near random loose packing, indicates that stress-induced frictional contacts control the jamming onset.
- phi_0 approaches random close packing (about 0.64) for the largest particles and drops for smaller ones, a size dependence the paper attributes to residual surface interactions.
- Because the same data also give the shear-thickening onset stress sigma_0 and the stress scale sigma*, one set of flow curves yields both the thickening and the jamming phase boundaries.
Reading between the lines
- A testable extension, which the paper notes is left for future work, is to compare its steady-flow sigma_SJ with values from transient stress responses or bulk imaging that can see interior failures; agreement would close the loop, and disagreement would pinpoint where the steady-flow signature misreads.
- The method, if it holds, should be able to map the entire SJ boundary in the (sigma, phi) plane rather than just individual points; for phi just above phi_m the predicted sigma_SJ should rise steeply, a prediction that could be checked with the same flow-curve data.
- Because the KD baseline is fitted below phi_rlp, the method implicitly assumes the same diverging viscosity law holds into the jammed regime; applying the analysis to systems with attractions or non-spherical particles would test how general the shortfall signature is.
Signed reviews
Editorial analysis
A structured set of objections, weighed in public.
Referee Report
Summary. The manuscript reports steady-state rheology of polystyrene/ polyethylene glycol suspensions at volume fractions φ = 0.45–0.60 for three particle sizes. The authors fit viscosity-versus-φ data at fixed stress to the Krieger–Dougherty (KD) relation over 0.45 ≤ φ ≤ 0.55, obtaining a stress-dependent jamming fraction φJ(σ); at φ = 0.58 and 0.60 and high stress, the measured viscosities fall systematically below the KD fit. These φJ(σ) values are then fitted to the Wyart–Cates relation φJ(σ) = f(σ)φm + [1 − f(σ)]φ0 with f(σ) = exp[−(σ*/σ)^β], and the onset stress for shear jamming is defined as the stress σSJ(φ) at which φ = φJ(σ). The paper reports that σSJ decreases with increasing φ, in qualitative agreement with prior transient measurements, and supports the picture with optical imaging showing macroscopic sample detachment and edge fracture at high stress.
Significance. If the proposed method were validated, it would be a useful advance: shear jamming is normally distinguished from discontinuous shear thickening by transient stress-response protocols, and a steady-state criterion would simplify the characterization of dense suspensions. The paper has concrete strengths: systematic rheology over three particle sizes; checks of waiting-time dependence, reversibility, and geometry reported in the SI (Fig. S1); a partial check of the KD fitting-range dependence (Fig. S2); and direct imaging of edge fracture at high stress (Fig. 3e,f). The internal consistency φm ≈ φrlp ≈ 0.56 in all three systems is also suggestive. However, the central quantitative claim is not yet established: the Wyart–Cates fit that converts φJ(σ) into σSJ has too few constraints, and alternative explanations of the KD shortfall (wall slip, edge fracture, breakdown of the KD form at high φ) are not excluded. The authors are explicit that direct comparison with transient shear-jamming measurements remains future work, which is a key missing test.
major comments (3)
- [Section III, Fig. 3] The Wyart–Cates fit is underdetermined. For each particle size, φJ(σ) is obtained at only four stress values (for d = 1.21 µm: 28, 200, 448, and 2000 Pa), while Eq. (1) with f(σ) = exp[−(σ*/σ)^β] contains four free parameters (φ0, φm, σ*, β). A four-parameter curve through four points has zero degrees of freedom, so the reported 'excellent agreement' in Fig. 3a–c is an interpolation rather than a validation. The paper should report the number of independent stress levels, parameter uncertainties or covariance, and a goodness-of-fit or cross-validation statistic; without this, the extracted σSJ values are not independent predictions but outputs of an unconstrained fit.
- [Section III, Figs. 2 and S2] The interpretation of the KD shortfall at φ = 0.58 and 0.60 as a signature of shear-jamming failure is not uniquely supported. The KD baseline is fitted only over 0.45 ≤ φ ≤ 0.55, and the SI (Fig. S2) checks the wider range 0.4–0.55 only for σ = 28, 200, and 448 Pa, not for the 2000 Pa point used in Fig. 2b. The manuscript itself notes sample protrusion from the plates at high shear rates; wall slip, edge fracture, or breakdown of the KD functional form at high φ could produce the same apparent viscosity shortfall without implying shear jamming. The optical imaging (Fig. 3e,f) detects only macroscopic brittle failure and the conclusions explicitly state that no failure is visible just beyond the predicted σSJ. A direct comparison with transient stress measurements on the same suspensions, or a control experiment varying geometry and gap, is needed to rule out these confounds.
- [Section III, Conclusions] The term 'prediction' overstates what is demonstrated. The σSJ values are read from the WC curve whose parameters are fitted to the same steady-state data from which φJ(σ) was extracted, so the agreement with the qualitative trend from transient measurements (refs. 28, 31) is a postdiction, not an independent validation. The paper should either validate σSJ against transient shear-jamming measurements on the same suspensions, or reframe σSJ as a consistency check and provide a concrete falsifiable prediction, such as a hold-out stress level or a predicted shear-rate discontinuity, that could be tested in future work.
minor comments (5)
- [Section III, Eq. (1) and Fig. 3] The stretched-exponential form f(σ) = exp[−(σ*/σ)^β] is adopted from the literature, but the paper does not report the fit residuals or parameter bounds for β, σ*, φ0, and φm; adding a table of fitted values with uncertainties would greatly improve reproducibility.
- [SI, Fig. S4] The claim σ* ∼ 1/d² is presented alongside the empirical fit σ*(d) = A/d² + B with B = 65.89 Pa, which is not a pure inverse-square law; the role of the constant offset should be discussed or the claim should be softened to 'approximately consistent with σ* ∼ 1/d² plus a constant.'
- [Section II, Experimental] Minor typographical and formatting issues: 'Sayantan majumdar' should be capitalized, '2o' should be '2°', and the SI abbreviation is used inconsistently as 'S.I.' and 'SI'; these do not affect the science.
- [Section III, Fig. 3d] The shaded 'SJ' region in Fig. 3d is model-derived and could be confused with measured data; the caption should state explicitly that the shaded region is the phase boundary obtained from the WC fit, and the numeric values of σSJ for φ = 0.58 and 0.60 should be given.
- [References] Reference [39] is a commercial web page; the residual-interaction discussion should cite a peer-reviewed source, and reference [31] should be updated to its published version if available.
Circularity Check
Predicted shear-jamming onset is the inverse of the fitted Wyart--Cates curve, so the central claim reduces to a fit.
-
self definitional
[Sec. III (Results and Discussion), around Eq. (1) and Fig. 3b/3d]
"For a given φ, the onset stress for shear jamming (σ_SJ) is determined from the stress value σ for which, φ = φJ(σ) (shown in Fig. 3b by dashed vertical lines for φ = 0.58 and 0.6)."
The φJ(σ) on the right-hand side is not an independently measured shear-jamming boundary; it is the jamming fraction obtained in this paper by fitting the Krieger-Dougherty relation to the same steady-state ηr(φ) curves (restricted to φ ≤ 0.55) and then fitting those extracted values to the Wyart-Cates model, Eq. (1), with four free parameters. Setting φ = φJ(σ) and solving for σ is therefore not a prediction from an independent observable but an inversion of the fitted curve. The paper even concedes that optical imaging sees no failure just beyond σ_SJ, so the onset has no separate operational definition. The claim that steady-state flow curves locate the SJ onset holds by construction: the onset is defined as the divergence point of the fitted viscosity model.
-
fitted input called prediction
[Fig. 2 and Fig. 3a-3c; main text after 'we got an excellent agreement']
"The solid lines in Figs. 3a, 3b and 3c indicate the fits of WC Model to the experimental data, where we got an excellent agreement."
For each particle size, the paper displays four φJ(σ) values (e.g., σ = 28, 200, 448 and 2000 Pa for d = 1.21 µm), while Eq. (1) with f(σ) = exp[-(σ*/σ)^β] has four free parameters φ0, φm, σ*, β. The fit is therefore exactly determined with zero degrees of freedom. The 'excellent agreement' is an interpolation through the fitted points, not a test of the WC form, and the σ_SJ values subsequently read from this curve are outputs of that same exactly determined fit. These numbers are fitted parameters renamed as 'predicted onset stresses'; they contain no information beyond the KD/WC inputs used to create them.
full rationale
The paper contains genuine empirical content: the steady-state viscosity curves are measured, and the systematic deviation from the Krieger-Dougherty relation at high φ and σ is a real observation. However, the central claimed prediction—the shear-jamming onset σ_SJ—is not derived from an independent measurement or benchmark. It is defined as the solution of φ = φJ(σ), where φJ(σ) is itself obtained by first fitting KD to the same steady-state data and then fitting the four-parameter Wyart-Cates form to those extracted φJ values. Inverting this fitted curve to produce σ_SJ makes the 'prediction' a mathematical restatement of the fit. The WC model and stretched-exponential f(σ) are adopted from the literature (external citations, not self-citations), so the model form is an ansatz rather than a derived result. Self-citations to prior transient-rheology work support the qualitative trend σ_SJ decreasing with φ, but they are not the load-bearing circular step. The aggravating factor is that, at the displayed stress levels, the WC fit appears exactly determined, making the stated 'excellent agreement' vacuous as a validation. The paper explicitly defers comparison with transient measurements to future work ('comparison of the predicted value of σSJ from our steady state measurements with that obtained from transient measurements or directly by more sophisticated optical/non-optical imaging techniques probing sample failures, remain an interesting future challenge'). Thus the central claim reduces substantially to a fit, warranting a partial circularity score of 6 rather than a higher score, because the underlying flow-curve data and KD-deviation analysis are not themselves circular.
Assumptions & free parameters
free parameters (5)
- phi_J (KD fit parameter) =
varies with sigma; e.g., 0.619 at sigma=28 Pa for d=1.21 um
- phi_0 =
0.645, 0.620, 0.605 for d=0.59, 1.21, 2.76 um
- phi_m =
~0.561-0.562
- sigma* =
stress scale, ~1/d^2; e.g., about 265.58/d^2 + 65.89 Pa
- beta =
1.19, 0.99, 0.74 for the three sizes
assumptions (5)
- domain assumption KD relation eta_r = (1 - phi/phi_J)^-2 holds for the suspension at each stress over the fitting range.
- ad hoc to paper phi_J(sigma) = f(sigma) phi_m + (1 - f(sigma)) phi_0 with f(sigma) = exp(-(sigma*/sigma)^beta) describes the stress dependence of the jamming fraction.
- domain assumption Shear induced jamming does not occur below phi_rlp ~ 0.55, so the KD fit over phi in [0.45, 0.55] is safe.
- domain assumption Each flow-curve point is a steady state measurement.
- domain assumption Shear thickening and jamming are driven by stress-induced frictional contacts.
Cite this review
Pith. "Pith review of Signature of jamming under steady shear in dense particulate suspensions." pith.science (2026). https://pith.science/paper/QPTUFRTR
@misc{pith2026190807183,
  author       = {Pith},
  title        = {Pith review of: Signature of jamming under steady shear in dense particulate suspensions},
  year         = {2026},
  howpublished = {\url{https://pith.science/paper/QPTUFRTR}},
  note         = {Machine review of arXiv:1908.07183}
}
abstract
Under an increasing applied shear stress ($\sigma$), viscosity of many dense particulate suspensions increases drastically beyond a stress onset ($\sigma_0$), a phenomenon known as discontinuous shear-thickening (DST). Recent studies point out that some suspensions can transform into a stress induced solid-like shear jammed (SJ) state at high particle volume fraction ($\phi$). SJ state develops a finite yield stress and hence is distinct from a shear-thickened state. Here, we study the steady state shear-thickening behaviour of dense suspensions formed by dispersing colloidal polystyrene particles (PS) in polyethylene glycol (PEG). We find that for small $\sigma$ values the viscosity of the suspensions as a function of $\phi$ can be well described by Krieger-Dougherty (KD) relation. However, for higher values of $\sigma$ ($>> \sigma_0$), KD relation systematically overestimates the measured viscosity, particularly for higher $\phi$ values. This systematic deviation can be rationalized by the weakening of the sample due to flow induced failures of the solid-like SJ state. Using Wyart-Cates model, we propose a method to predict the SJ onset from the steady state rheology measurements. Our results are further supported by in-situ optical imaging of the sample boundary under shear.
Figures


Reference graph
Works this paper leans on
- [1]
-
[2]
A. Fall, F. Bertrand, D. Hautemayou, C. Meziere, P. Moucheront, A. Lemaitre, and G. Ovarlez, Phys. Rev. Lett. 114, 098301 (2015)
work page 2015
- [3]
-
[4]
H. A. Barnes, J. Rheol. 33, 329 (1989)
work page 1989
- [5]
- [6]
-
[7]
B. J. Maranzano, and N. J. Wagner, J. Rheol. 45, 1205 (2001)
work page 2001
-
[8]
A. Fall, N. Huang, F. Bertrand, G. Ovarlez, and D. Bonn, Phys. Rev. Lett. 100, 018301 (2008)
2008
Show all 44 references
-
[9]
Q. Xu, S. Majumdar, E. Brown, and H. M. Jaeger, EPL (Europhysics Letters) 107, 68004 (2014)
2014
-
[10]
B. M. Guy, M. Hermes and W. C. K. Poon, Phy. Rev. Lett. 115, 088304 (2015)
2015
-
[11]
J. R. Royer, D. L. Blair, and S. D. Hudson, Phys. Rev. Lett. 116, 188301 (2016)
2016
-
[12]
Comtet, G
J. Comtet, G. Chatte, A. Nigues, L. Bocquet, A. Siria, and A. Colin, Nat. Commun. 8, 15633 (2017)
2017
-
[13]
N. J. Wagner, and J. F. Brady, Phys. Today 62, 27 (2009)
2009
-
[14]
Singh, R
A. Singh, R. Mari, M. M. Denn and J. F. Morris, J. Rheol. 62, 405 (2018)
2018
-
[15]
Y. Lee, E. Wetzel, and J. Wagner, J. Mater. Sci. 38, 2825 (2003)
2003
-
[16]
Majumdar, B
A. Majumdar, B. Singh Butola, and A. Srivastava, Materials and Design 46, 191 (2013)
2013
-
[17]
K. Lin, H. Liu, M. Wei, A. Zhou, and F. Bu, Smart Mater. Struct. 28, 025007 (2019)
2019
-
[18]
J. Qin, G. Zhang, and X. Shi, J. Dispers. Sci. Technol. 38, 935 (2017)
2017
-
[19]
C. E. Chu, J. A. Groman, H. L. Sieber, J. G. Miller, R. J. Okamoto, and J. I. Katz, arXiv:1405.7233v1 (2014)
2014 arXiv
-
[20]
Majumdar, R
S. Majumdar, R. Krishnaswamy, and A. K. Sood, Proc. Natl. Acad. Sci. U. S. A. 108(22), 8996 (2011)
2011
-
[21]
Brown and H
E. Brown and H. M. Jaeger, Reports on Progress in Physics 77, 046602 (2014)
2014
-
[22]
Fernandez, R
N. Fernandez, R. Mani, D. Rinaldi, D. Kadau, M. Mosquet, H. Lombois-Burger, J. Cayer-Barrioz, H. J. Herrmann, N. D. Spencer, and L. Isa, Phys. Rev. Lett. 111, 108301 (2013)
2013
-
[23]
N. Y. C. Lin, B. M. Guy, M. Hermes, C. Ness, J. Sun, W. C. Poon, and I. Cohen, Phy. Rev. Lett. 115, 228304 (2015)
2015
-
[24]
Clavaud, A
C. Clavaud, A. Berut, B. Metzger, and Y. Forterre, Proc. Natl. Acad. Sci.(USA) 114, 5147 (2017)
2017
-
[25]
R. Seto, R. Mari, J. F. Morris, and M. M. Denn, Phys. Rev. Lett. 111, 218301 (2013)
2013
-
[26]
R. Mari, R. Seto, J. F. Morris, and M. M. Denn, J. Rheol 58, 1693 (2014)
2014
-
[27]
Smith, R
M. Smith, R. Besseling, M. Cates, and V. Bertola, Nature Communications 1, 114 (2010)
2010
-
[28]
I. R. Peters, S. Majumdar and H. M. Jaeger, Nature 532, 214 (2016)
2016
-
[29]
Majumdar, I
S. Majumdar, I. R. Peters, E. Han, and H. M. Jaeger, Phys. Rev. E 95, 012603 (2017)
2017
-
[30]
N. M. James, E. Han, R. A. Lopez De La Cruz, J. Jureller and H. M. Jaeger, Nat. Mat. 17, 965 (2018)
2018
-
[31]
E. Han, N. M. James and H. M. Jaeger, arXiv:1810.11887v1 (2018)
2018 arXiv
-
[32]
Wyart, and M
M. Wyart, and M. E. Cates, Phy. Rev. Lett. 114, 098302 (2014)
2014
-
[33]
I. M. Krieger, and T. J. Dougherty, Trans. Soc. Rheol. 3, 137 (1957)
1957
-
[34]
Nicolas, E
A. Nicolas, E. E. Fererro, K. Martens, and J-L. Barrat, Rev. Mod. Phys. 90, 045006 (2018)
2018
-
[35]
Howell, R
D. Howell, R. P. Behringer, andC. Veje, Phys. Rev. Lett. 82, 5241 (1999)
1999
-
[36]
C. S. O’Harn, S. A. Langer, A. J. Liu, and S. R. Nagel, Phys. Rev. Lett. 86, 111 (2001)
2001
-
[37]
M Guy, C
M. M Guy, C. Ness, M. Hermes, L. J. Sawiak, J. Sun, W. C. Poon, arXiv:1901.02066v1 (2019)
2019 arXiv
-
[38]
L. E. Silbert, Soft Matter 6, 2918 (2010). 7
2010
-
[39]
https://wiki.anton-paar.com/en/the-influence-of-particles-on-suspension-rheology/
-
[40]
B. J. Maranzano, and N. J. Wagner, J. Chem. Phys. 114, 10514 (2001)
2001
-
[41]
Brown, N
E. Brown, N. A. Forman, C. S. Orellana, H. Zhang B. W. Maynor D. E Betts J. M. DeSimone and H. M. Jaeger, Nat. Mat. 9, 220 (2010). 8 Supplementary Information: Signature of jamming under steady shear in dense particulate suspensions Movie description In-situ deformation of the...
2010
-
[42]
D. Wang, B. Yu, H. L. Cong, Y. Z. Wang, Q. Wu, and J. L. Wang, Integr Ferroelectr 147(1), 41 (2013)
2013
-
[43]
A. J. Paine, W. Luymes, and J. Mcnulty, Integr Ferroelectr 23, 3104 (1990)
1990
-
[44]
Y. S. Cho, C. H. Shin, and S. Han, Nanoscale Res. Lett. 11, 46 (2016). 10 100 101 102 103 101 102 103 100 101 102 103 100 101 102 103 s (Pa)s (Pa) 10s to 0.5s h suspension (Pa.s) s (Pa) 20s to 1s 60s to 3s Parallel Plate Geometry a b c 100 101 102 103 104101 102 103 100 101 10...
2016
Reviewed August 14, 2026 · model on record in the stance chip above.
Discussion (0). Continue with ORCID to comment.