REVIEW 3 major objections 5 minor 53 references
Coherent signal detection in the statistical polarization regime enables high-resolution nanoscale NMR spectroscopy
T0 review · 3 major / 5 minor · reviewed 2026-08-10 · deepseek-v4-flash
Pith's one-line read Coherent NMR from hyperpolarized nanoscale liquid samples achieves 5 to 6 hertz linewidths and resolves 10 hertz scalar couplings, overcoming diffusional broadening.
desk verdict First experimental demonstration of coherent nanoscale NV-NMR on liquid samples with single-digit hertz resolution; the main claim holds up, but the statistical-polarization averaging is not quantified in the arXiv version. read the letter →
The pith
A machine-rendered reading of the paper's core claim, the machinery that carries it, and where it could break.
The reading
The authors use a diamond with nitrogen-vacancy (NV) centers just 4.5 nanometers below the surface. They hyperpolarize the liquid sample, water or trimethyl phosphate, using Overhauser dynamic nuclear polarization, which aligns more spins than the weak magnetic field alone. They then apply a radiofrequency pulse to create a coherent precession of the nuclear spins. The NV centers, acting as an ensemble of nanoscale magnetometers, record this precession. The key idea is that when the sample is uniformly polarized, molecules diffusing into and out of the detection volume carry the same polarization, so the net signal stays stable and the spectral line remains sharp.
They observe linewidths of about 5 to 6 hertz, and for trimethyl phosphate they resolve the 10 hertz scalar coupling between phosphorus and hydrogen. Statistical polarization noise, which is much larger, is argued to average out because it is random from one NV to another. The result is a three-order-of-magnitude improvement in resolution for non-viscous nanoscale samples.
Extended reading notes
Core claim
The paper's load-bearing assertion is that detecting coherent signals from a uniformly polarized nanoscale sample, with polarization enhanced beyond thermal levels, overcomes diffusional broadening and enables single-digit hertz spectral resolution and scalar coupling resolution (abstract). If true, coherent NV-NMR detection works in the statistical polarization regime without sample confinement.
Load-bearing premise
The assumption that the NV ensemble and CASR readout average out the large statistical polarization noise, leaving a clean coherent signal. This is stated in the Experimental Results section: 'due to the NV ensemble and NV detection scheme (CASR), non-coherent signals are averaged out.' The main text provides no quantitative model or direct control showing that the residual statistical noise is negligible compared to the coherent signal in the nanoscale detection volume. If this averaging is incomplete, the observed narrow lines could be contaminated or the quoted SNR and sensitivity would be optimistic.
Editorial analysis
A structured set of objections, weighed in public.
Referee Report
Summary. The paper reports NV-center NMR spectra from liquid water and trimethyl phosphate at the nanoscale, with claimed linewidths of about 5–6 Hz and resolved scalar coupling in TMP. The authors argue that detecting coherent signals from a uniformly hyperpolarized sample, rather than relying on statistical polarization, removes diffusion-induced line broadening even when the detection volume contains only a few thousand nuclear spins. The main evidence consists of qualitative single-spin diffusion simulations and experimental CASR-detected spectra, with calibration and control experiments deferred to a supplementary document. The authors also estimate a proton spin number sensitivity of about 20 fmol Hz^-1/2 based on 3e4 NV detection volumes.
Significance. If the central claim holds, this is a substantial advance: coherent NV-NMR spectroscopy with single-digit hertz resolution at the nanometer scale, without sample confinement, would open the way to chemical resolution at interfaces, surfaces, and potentially single molecules. The paper has clear strengths: the idea is physically well motivated, the experimental spectra in Fig. 3 are qualitatively consistent with the claimed linewidth and coupling resolution, and the calibration inputs (ODNP enhancement, geometry factor) are taken from prior work rather than fitted to the new data, so the demonstration is not circular. However, the full verification is not contained in the main text: the key statement that NV-ensemble and CASR averaging eliminates statistical polarization noise is not quantified, the simulations do not produce frequency-domain spectra, and the controls are only in the unavailable supplementary material. The result is plausible and important but not yet fully supported.
major comments (3)
- [Experimental Results] The load-bearing assertion 'due to the NV ensemble and NV detection scheme (CASR), non-coherent signals are averaged out' is not quantified. For a nanoscale detection volume with N on the order of 10^3 protons, statistical polarization exceeds the ODNP-enhanced polarization by orders of magnitude, so cancellation relies on the number of independent NV volumes and the number of averages. The paper gives no estimate of the residual incoherent variance after averaging over roughly 3e4 volumes and 400 acquisitions, and the main text presents no direct control showing that the narrow Lorentzians in Fig. 3 are free of an incoherent contribution. This also affects the quoted sensitivity of ~20 fmol Hz^-1/2, which would be optimistic if any statistical background remains. Please provide either a quantitative calculation of the residual variance or a control experiment without hyperpolarization, and report the associated uncertainties.
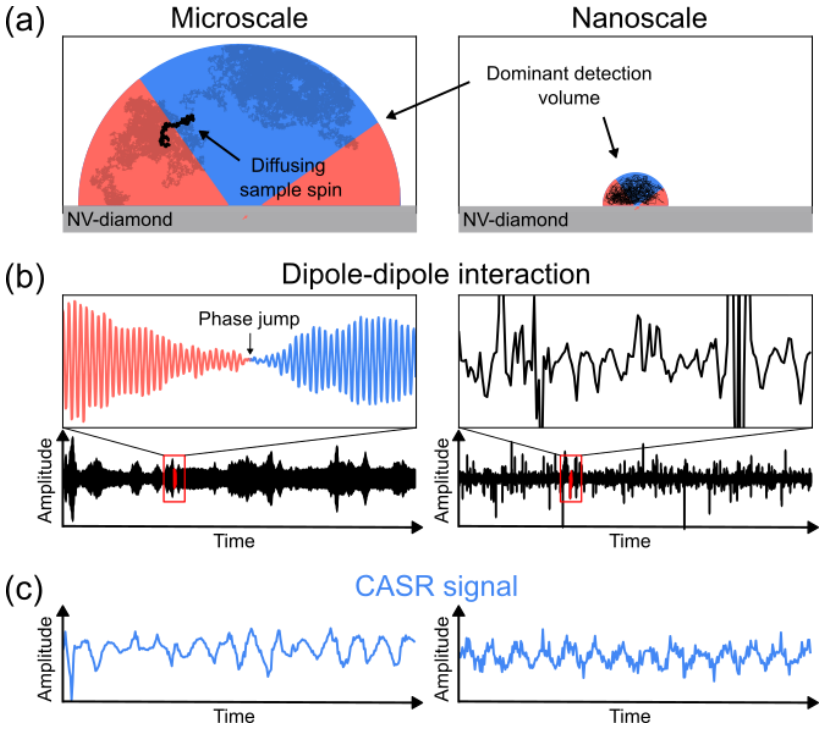
- [Simulations, Fig. 2] The simulations display single-spin time traces and CASR signals but do not report simulated frequency-domain spectra, linewidths, or signal-to-noise ratios. The central diffusion argument is stated as: 'Averaging either over time or through multiple sample spins or NVs, the phase and amplitude variations average out, minimizing differences in signal shape between the nano- and microscale regime.' This is not demonstrated by the presented data. Please add simulated spectra for the nanoscale geometry with realistic diffusion coefficients, spin numbers, and CASR demodulation (for example, with and without fast diffusion), to show explicitly that the linewidth remains in the single-digit hertz range after ensemble averaging.
- [Experimental Methods and Results; Supplementary references] The main text repeatedly defers essential verification to the supplementary material: calibration of ODNP (SM 1), proof that the detected signal comes from hyperpolarized water (SM 2), comparison with microscale spectra (SM 3), and discussion of limitations (SM 5). The arXiv posting does not include this supplementary material, so the main text, as posted, does not contain enough evidence to verify the central experimental claim independently. For the journal submission, either provide the supplementary material or incorporate the key controls and uncertainty analysis into the main text; without them the claim that the 5–6 Hz lines originate from coherent hyperpolarized water NMR cannot be fully assessed.
minor comments (5)
- [Fig. 3] No error bars or repeatability estimates are reported for the linewidths, SNR values, or the scalar-coupling constant; please provide typical uncertainties from repeated measurements or fits.
- [Eq. (1)] The notation for the sample-spin orientation vector, written as \( \vec H_1(t) \), is not explicitly defined; please clarify its relation to the equatorial-plane initial condition and to the Larmor precession.
- [Fig. 2 caption and Simulations] The caption states that the right nanoscale panel is scaled up for visualization; please state whether the simulation parameters (diffusion coefficient, detection radius, Larmor frequency) correspond to the experimental values (4.5 nm depth, 84 mT) or are only illustrative.
- [Main text] There are several typographical errors: 'over comes' in the abstract, 'nanos cale' in the first paragraph, and 'cooper coils' in Experimental Methods; please correct them.
- [References] References 4 and 5 are incomplete as formatted, lacking full journal metadata; please unify the reference style according to the journal guidelines.
Circularity Check
No significant circularity: the central experimental result is an observed spectrum, not a quantity forced by fitted parameters or by self-citation.
full rationale
The claimed derivation chain is: (i) a classical dipole simulation showing that fast diffusion modulates the single-spin coupling but that averaging over time, spins, or NVs restores the signal shape; and (ii) direct measurements of water and trimethylphosphate yielding ~5-6 Hz linewidths and ~10 Hz scalar coupling. The experimental spectra are not derived from fitted parameters: Lorentzian fits are used only to report measured linewidths, and the SNR/sensitivity numbers are stated as estimates from measured data and stated NV counts. The self-cited inputs (ODNP enhancement ~200 from Ref. 13, geometry factor from Ref. 8) are calibration or external inputs from prior published experiments; they are not predicted from this paper's data, and the central observation of narrow lines does not reduce to them. The statement that 'non-coherent signals are averaged out' by the NV ensemble and CASR is an assumption about noise rejection rather than a circular derivation; it may be a support or completeness limitation, but it is not a step in which a prediction equals its input by construction. No equation in the paper is shown to be equivalent to another by definition, and no fitted parameter is renamed as a prediction. References to SM 1-5 indicate omitted supplementary material in the posted text, but absence of that material is not circularity. Accordingly, no specific circular step meets the evidence bar.
Assumptions & free parameters
assumptions (6)
- standard math The classical magnetic dipole-dipole interaction model (Eq. 1) describes the coupling between the sample spins and the NV center.
- domain assumption The geometry factor, which states that the NMR signal amplitude from a uniformly polarized sample is independent of NV depth for a fixed geometry, is valid.
- domain assumption The Overhauser dynamic nuclear polarization enhancement of water with TEMPOL is approximately 200 at the operating field.
- domain assumption The CASR protocol faithfully converts the oscillating NMR signal into an optical signal with an aliased frequency.
- domain assumption Statistical polarization of the spin bath scales as 1/sqrt(N) and dominates over thermal polarization for small N.
- domain assumption The ensemble of NV centers and the CASR detection scheme average out stochastic, non-coherent signals.
Cite this review
Pith. "Pith review of Coherent signal detection in the statistical polarization regime enables high-resolution nanoscale NMR spectroscopy." pith.science (2026). https://pith.science/paper/QZPMXGRO
@misc{pith2026250102093,
  author       = {Pith},
  title        = {Pith review of: Coherent signal detection in the statistical polarization regime enables high-resolution nanoscale NMR spectroscopy},
  year         = {2026},
  howpublished = {\url{https://pith.science/paper/QZPMXGRO}},
  note         = {Machine review of arXiv:2501.02093}
}
read the original abstract
Nitrogen-vacancy (NV) centers in diamond have emerged as quantum sensors capable of detecting nuclear magnetic resonance (NMR) signals at unprecedented length scales, ranging from picoliter sample volumes down to single spins at the diamond surface. While high-resolution (few hertz) NV-NMR spectroscopy has been demonstrated at the micrometer scale, it has remained elusive at the nanometer scale. In this regime, only the detection of statistical polarization has been achieved, limiting spectral resolution due to molecular diffusion in liquid samples. Here, we demonstrate that detecting coherent signals from a uniformly polarized nanoscale sample, where polarization is enhanced beyond thermal levels, successfully overcomes this limitation, enabling single-digit hertz spectral resolution and the capacity to resolve scalar couplings. These results pave the way for high-resolution nanoscale NMR spectroscopy at interfaces, surfaces, and potentially even single molecules.
Figures

Reference graph
Works this paper leans on
-
[1]
Doherty, M. W. et al. The nitrogen-vacancy colour centre in diamond. Physics Reports 528, 1–45 (2013)
2013
-
[2]
Schirhagl, R., Chang, K., Loretz, M. & Degen, C. L. Nitrogen-Vacancy Centers in Diamond: Nanoscale Sensors for Physics and Biology. Annu. Rev. Phys. Chem. 65, 83–105 (2014)
work page 2014
-
[3]
Du, J., Shi, F., Kong, X., Jelezko, F. & Wrachtrup, J. Single-molecule scale magnetic resonance spectroscopy using quantum diamond sensors. Rev. Mod. Phys. 96, 025001 (2024)
work page 2024
-
[4]
Allert, R. D., Briegel, K. D. & Bucher, D. B. Advances in nano- and microscale NMR spectroscopy using diamond quantum sensors. Chem. Commun. 10.1039.D2CC01546C (2022) doi:10.1039/D2CC01546C
-
[5]
Rizzato, R., von Grafenstein, N. R. & Bucher, D. B. Quantum sensors in diamonds for magnetic resonance spectroscopy: Current applications and future prospects. Applied Physics Letters 123, 260502 (2023)
work page 2023
-
[6]
L., Reinhard, F
Degen, C. L., Reinhard, F. & Cappellaro, P. Quantum sensing. Rev. Mod. Phys. 89, 035002 (2017)
2017
-
[7]
Levine, E. V. et al. Principles and techniques of the quantum diamond microscope. Nanophotonics 8, 1945–1973 (2019)
2019
-
[8]
Bruckmaier, F., Briegel, K. D. & Bucher, D. B. Geometry dependence of micron-scale NMR signals on NV-diamond chips. Journal of Magnetic Resonance Open 8, 100023 (2021)
work page 2021
Show all 53 references
-
[9]
Aslam, N. et al. Nanoscale nuclear magnetic resonance with chemical resolution. Science 357, 67–71 (2017)
2017
-
[10]
Staudacher, T. et al. Probing molecular dynamics at the nanoscale via an individual paramagnetic centre. Nat Commun 6, 8527 (2015)
2015
-
[11]
Mamin, H. J. et al. Nanoscale Nuclear Magnetic Resonance with a Nitrogen-Vacancy Spin Sensor. Science 339, 557–560 (2013)
2013
-
[12]
Glenn, D. R. et al. High-resolution magnetic resonance spectroscopy using a solid-state spin sensor. Nature 555, 351–354 (2018)
2018
-
[13]
B., Glenn, D
Bucher, D. B., Glenn, D. R., Park, H., Lukin, M. D. & Walsworth, R. L. Hyperpolarization - Enhanced NMR Spectroscopy with Femtomole Sensitivity Using Quantum Defects in Diamond. Phys. Rev. X 10, 021053 (2020)
2020
-
[14]
Arunkumar, N. et al. Micron-Scale NV-NMR Spectroscopy with Signal Amplification by Reversible Exchange. PRX Quantum 2, 010305 (2021)
2021
-
[15]
Smits, J. et al. Two-dimensional nuclear magnetic resonance spectroscopy with a microfluidic diamond quantum sensor. Science Advances 5, (2019). 9
2019
-
[16]
Silani, Y. et al. Nuclear quadrupole resonance spectroscopy with a femtotesla diamond magnetometer. Science Advances 9, eadh3189 (2023)
2023
-
[17]
Bruckmaier, F. et al. Imaging local diffusion in microstructures using NV-based pulsed field gradient NMR. Science Advances 9, eadh3484 (2023)
2023
- [18]
-
[19]
R., Allert, R
Neuling, N. R., Allert, R. D. & Bucher, D. B. Prospects of single-cell nuclear magnetic resonance spectroscopy with quantum sensors. Current Opinion in Biotechnology 83, 102975 (2023)
2023
-
[20]
Allert, R. D. et al. Microfluidic quantum sensing platform for lab-on-a-chip applications. Lab Chip 22, 4831–4840 (2022)
2022
-
[21]
M., Cujia, K
Boss, J. M., Cujia, K. S., Zopes, J. & Degen, C. L. Quantum sensing with arbitrary frequency resolution. Science 356, 837–840 (2017)
2017
-
[22]
Schmitt, S. et al. Submillihertz magnetic spectroscopy performed with a nanoscale quantum sensor. Science 356, 832–837 (2017)
2017
-
[23]
Staudacher, T. et al. Nuclear Magnetic Resonance Spectroscopy on a (5-Nanometer) 3 Sample Volume. Science 339, 561–563 (2013)
2013
-
[24]
Lovchinsky, I. et al. Magnetic resonance spectroscopy of an atomically thin material using a single-spin qubit. Science 355, 503–507 (2017)
2017
-
[25]
Lovchinsky, I. et al. Nuclear magnetic resonance detection and spectroscopy of single proteins using quantum logic. Science 351, 836–841 (2016)
2016
-
[26]
Abendroth, J. M. et al. Single-Nitrogen–Vacancy NMR of Amine-Functionalized Diamond Surfaces. Nano Lett. 22, 7294–7303 (2022)
2022
-
[27]
DeVience, S. J. et al. Nanoscale NMR spectroscopy and imaging of multiple nuclear species. Nature Nanotech 10, 129–134 (2015)
2015
-
[28]
Liu, K. S. et al. Surface NMR using quantum sensors in diamond. Proceedings of the National Academy of Sciences 119, e2111607119 (2022)
2022
-
[29]
C., Hanashima, S., Iwasaki, T
Ishiwata, H., Watanabe, H. C., Hanashima, S., Iwasaki, T. & Hatano, M. Label ‐Free Phase Change Detection of Lipid Bilayers Using Nanoscale Diamond Magnetometry. Adv Quantum Tech 2000106 (2021) doi:10.1002/qute.202000106
2021 doi
-
[30]
Kehayias, P. et al. Solution nuclear magnetic resonance spectroscopy on a nanostructured diamond chip. Nat Commun 8, 188 (2017)
2017
-
[31]
& Wrachtrup, J
Ziem, F., Garsi, M., Fedder, H. & Wrachtrup, J. Quantitative nanoscale MRI with a wide field of view. Scientific Reports 9, 12166 (2019)
2019
-
[32]
Müller, C. et al. Nuclear magnetic resonance spectroscopy with single spin sensitivity. Nat Commun 5, 4703 (2014)
2014
-
[33]
Sushkov, A. O. et al. Magnetic Resonance Detection of Individual Proton Spins Using Quantum Reporters. Phys. Rev. Lett. 113, 197601 (2014)
2014
-
[34]
Meriles, C. A. et al. Imaging mesoscopic nuclear spin noise with a diamond magnetometer. The Journal of Chemical Physics 133, 124105 (2010)
2010
-
[35]
E., Cadeddu, D., Xue, F., Peddibhotla, P
Herzog, B. E., Cadeddu, D., Xue, F., Peddibhotla, P. & Poggio, M. Boundary between the thermal and statistical polarization regimes in a nuclear spin ensemble. Appl. Phys. Lett. 105, 043112 (2014)
2014
-
[36]
Tabatabaei, S. et al. Large-enhancement nanoscale dynamic nuclear polarization near a silicon nanowire surface. Science Advances 10, eado9059 (2024)
2024
-
[37]
Staudenmaier, N. et al. Optimal Sensing Protocol for Statistically Polarized Nano-NMR with NV Centers. Phys. Rev. Lett. 131, 150801 (2023)
2023
-
[38]
Laraoui, A. et al. High-resolution correlation spectroscopy of 13C spins near a nitrogen-vacancy centre in diamond. Nat Commun 4, 1651 (2013)
2013
-
[39]
& Retzker, A
Oviedo-Casado, S., Rotem, A., Nigmatullin, R., Prior, J. & Retzker, A. Correlated noise in Brownian motion allows for super resolution. Sci Rep 10, 19691 (2020)
2020
-
[40]
Staudenmaier, N. et al. Power-law scaling of correlations in statistically polarised nano-NMR. npj Quantum Information 8, 120 (2022)
2022
-
[41]
& Retzker, A
Cohen, D., Nigmatullin, R., Eldar, M. & Retzker, A. Confined Nano-NMR Spectroscopy Using NV Centers. Advanced Quantum Technologies 3, 2000019 (2020)
2020
-
[42]
Liu, K. S. et al. Using Metal–Organic Frameworks to Confine Liquid Samples for Nanoscale NV- NMR. Nano Lett. 22, 9876–9882 (2022)
2022
-
[43]
Schwartz, I. et al. Blueprint for nanoscale NMR. Sci Rep 9, 6938 (2019)
2019
-
[44]
Wickenbrock, A. et al. High homogeneity permanent magnet for diamond magnetometry. Journal of Magnetic Resonance 322, 106867 (2021). 10
2021
-
[45]
Bucher, D. B. et al. Quantum diamond spectrometer for nanoscale NMR and ESR spectroscopy. Nat Protoc 14, 2707–2747 (2019)
2019
-
[46]
Overhauser, A. W. Polarization of Nuclei in Metals. Phys. Rev. 92, 411–415 (1953)
1953
-
[47]
Emmerich, T. et al. Nanofluidics. Nat Rev Methods Primers 4, 1–18 (2024)
2024
-
[48]
E., Emsley, L
Reif, B., Ashbrook, S. E., Emsley, L. & Hong, M. Solid-state NMR spectroscopy. Nat Rev Methods Primers 1, 2 (2021)
2021
-
[49]
Eills, J. et al. Spin Hyperpolarization in Modern Magnetic Resonance. Chem. Rev. 123, 1417– 1551 (2023)
2023
-
[50]
Holzgrafe, J. et al. Nanoscale NMR Spectroscopy Using Nanodiamond Quantum Sensors. Phys. Rev. Applied 13, 044004 (2020)
2020
-
[51]
Rovny, J. et al. Nanoscale diamond quantum sensors for many-body physics. Nat Rev Phys 1–16 (2024) doi:10.1038/s42254-024-00775-4
2024 doi
-
[52]
Rondin, L. et al. Nanoscale magnetic field mapping with a single spin scanning probe magnetometer. Applied Physics Letters 100, 153118 (2012)
2012
-
[53]
Maletinsky, P. et al. A robust scanning diamond sensor for nanoscale imaging with single nitrogen-vacancy centres. Nature Nanotech 7, 320–324 (2012)
2012
Reviewed August 10, 2026 · model on record in the stance chip above.
Discussion (0). Continue with ORCID to comment.