REVIEW 2 major objections 7 minor 58 references
FlowSense: A Natural Language Interface for Visual Data Exploration within a Dataflow System
T0 review · 2 major / 7 minor · reviewed 2026-08-14 · deepseek-v4-flash
Pith's one-line read FlowSense enables natural language construction and editing of dataflow diagrams in VisFlow, covering most diagram-editing operations for visual data exploration.
desk verdict A genuinely new NLI design for dataflow systems with an honest but uncontrolled evaluation; the causal usability claim overreaches the experiment. read the letter →
The pith
A machine-rendered reading of the paper's core claim, the machinery that carries it, and where it could break.
The reading
What carries the argument
The central mechanism is the semantic parser with special utterance tagging and special utterance placeholders. Special utterances—column names, node labels, node types, and dataset names—are recognized on the fly, highlighted with consistent colors in the input box, and represented in grammar rules by generic placeholders such as ⟨column⟩. This lets the roughly 500-rule grammar work across datasets and diagrams without new rules. A query-pattern completion step fills missing source nodes, target nodes, and port specifications using default values and a focus-score heuristic based on click activeness and mouse distance, and the parser resolves syntactic ambiguity by learning a small weight vector over derivation rules.
What would settle it
Conduct a controlled experiment in which two matched groups perform the same three analytical tasks after identical tutorials, one group using only VisFlow and the other using VisFlow with FlowSense. If the FlowSense group shows no meaningful advantage in completion time, answer accuracy, or perceived usability, the paper's usability claim would be contradicted.
Extended reading notes
Core claim
The paper's central claim is that a natural language interface can support the majority of dataflow diagram editing operations in VisFlow. FlowSense maps English queries onto six categories of VisFlow functions—visualizing, visual encoding, filtering and extremum finding, subset manipulation, highlighting, and linking—using a grammar-based semantic parser. The parser tags special utterances (column names, node labels, node types, dataset names) in real time and replaces them with placeholders in grammar rules, which makes the grammar independent of the loaded dataset and the current diagram. The paper reports a 68.5% raw query acceptance rate (76.9% after fixing implementation bugs) from a 17-participant user study, and presents this, together with a domain-expert case study on NYC traffic speed data, as evidence that FlowSense improves VisFlow's usability and simplifies diagram construction.
Load-bearing premise
The load-bearing premise is that participants' success and positive ratings in the user study come from FlowSense itself, rather than from the tutorials they completed first or from the simplicity of the tasks, yet no control condition used VisFlow alone on the same tasks.
Editorial extensions
If this is right
- Users with no prior VisFlow experience can build sophisticated linked visualizations, such as comparing two neighborhoods' traffic-speed changes, using plain-English commands.
- A single natural language query can trigger multiple VisFlow functions at once, so actions that previously required a sequence of drag-and-drop steps become batch operations.
- The special-utterance-placeholder design means the grammar can be ported to a new dataset or dataflow diagram without writing new rules, as long as the system's underlying modules remain the same.
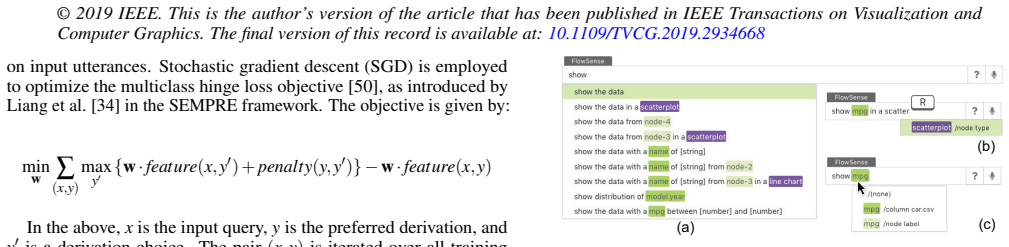
- Real-time tagging and auto-completion give users a live view of what the parser understands, which helps prevent and correct misinterpretations before a query is executed.
- The same architecture could be applied to other dataflow systems whose components can be identified as modular data- or diagram-dependent entities.
Reading between the lines
- The six-way function taxonomy (visualize, encode, filter/extremum, manipulate subsets, highlight, link) could serve as a reusable task model for natural language interfaces in other visualization workbenches, beyond dataflow systems.
- The focus-score heuristic for implicit query completion could be adapted to predict the user's intended target node in any diagram-editing interface, not just for natural language input.
- The failure analysis suggests that adding a query-repair component—one that proposes minimal edits to rejected utterances—would directly improve the acceptance rate; the query log categories 'rephrased' and 'composite' are the most promising targets.
- The reported 76.9% improved acceptance ceiling indicates that grammar-based approaches may plateau without an external knowledge base for concept equivalence (e.g., 'degree' = 'HighestLevelOfEducation'), so future systems might combine placeholder-based grammars with learned synonym or entailment models.
Signed reviews
Editorial analysis
A structured set of objections, weighed in public.
Referee Report
Summary. The paper proposes FlowSense, a natural language interface for the VisFlow dataflow visualization system. FlowSense uses a semantic parser with a grammar of roughly 500 rules, runtime special-utterance placeholders for dataset and diagram entities, real-time tagging feedback, query and token auto-completion, and a focus-score heuristic for implicit query completion. The authors evaluate the system with a case study on a traffic speed analysis task and a user study with 17 participants who completed three analytical tasks; they also analyze 649 logged NL queries, reporting acceptance rates and a breakdown of failure categories. The central claims are that FlowSense supports NL queries for the majority of VisFlow diagram editing operations and that it improves DFVS usability and simplifies diagram construction (Sections 1 and 7).
Significance. If the claims are valid, the paper is a useful contribution to natural language interfaces for visual data exploration. It is among the first to address a dataflow context, and the special-utterance placeholder design is a pragmatic way to keep the grammar independent of datasets and diagrams. The evaluation is transparent: the authors provide an open-source repository, a detailed query log analysis with failure categories, and an honest discussion of limitations. The machine-checked grammar tests and the clear reporting of acceptance rates before and after retrospective fixes are also strengths. However, the causal usability claim is weakened by the absence of a VisFlow-only control condition and by the encouraged-but-not-enforced use of FlowSense in the task phase. The paper therefore needs a revised framing of its contributions and, ideally, additional evidence to support the causal attribution.
major comments (2)
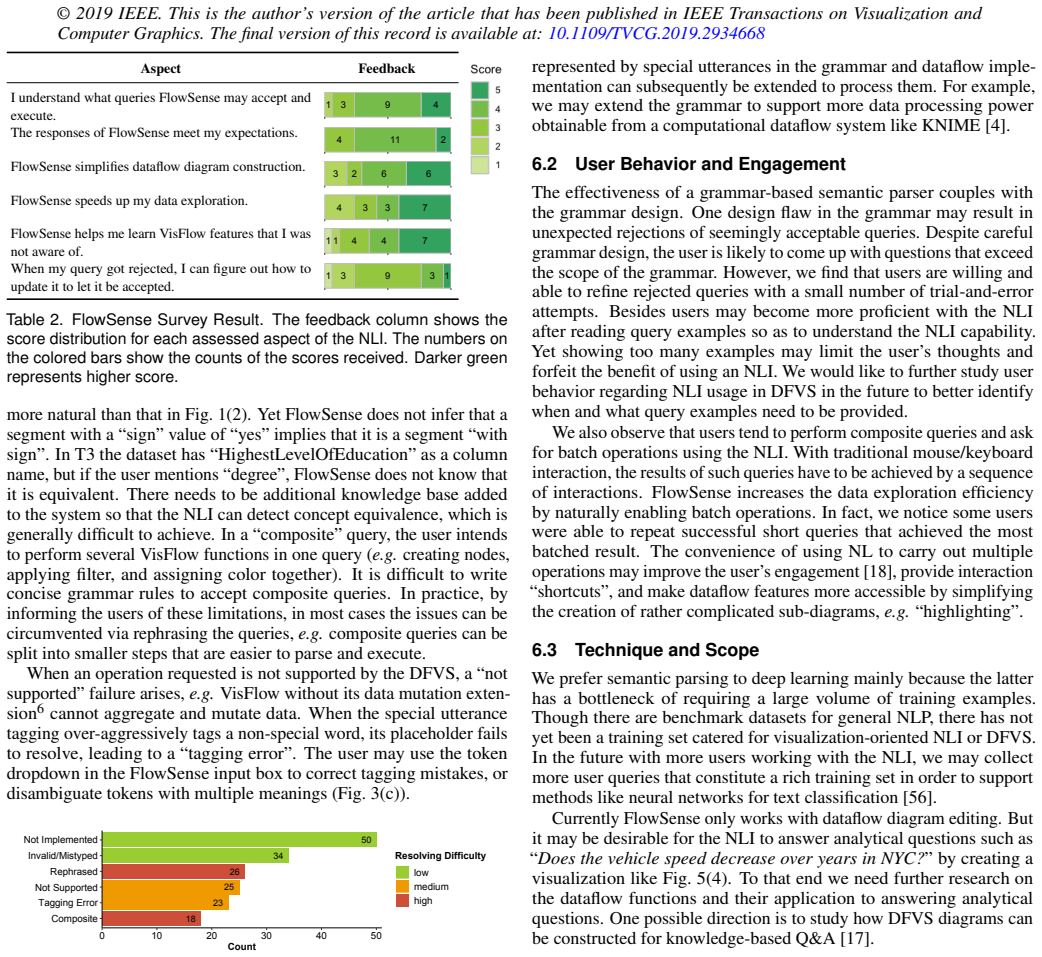
- [Section 5.2.1 and Section 5.2.4] The experimental design does not support the causal claim that FlowSense "improves the DFVS usability and simplifies diagram construction" (Sections 1 and 7). All 17 participants completed a VisFlow tutorial and then a FlowSense tutorial before the task phase, and the task phase allowed mixed usage of VisFlow and FlowSense, with FlowSense usage "encouraged" but "not enforced." There was no control condition in which participants used only VisFlow for the same tasks. Consequently, task completion success, completion times, and the Likert feedback in Table 2 (which asked users to compare FlowSense-assisted usage against their earlier tutorial-phase experience) are all confounded with tutorial exposure, practice, and novelty effects. To support the causal attribution, the authors need either a between-subjects or counterbalanced design with a VisFlow-only condition, or at minimum a logging analysis showing the extent of FlowSense usage and an association between usage and outcomes.
- [Section 5.2.5] The reported "improved acceptance rate" of 76.911% is a post-hoc projection based on retrospectively resolving 34 "not implemented" queries and 18 software bugs during analysis, not a rate observed with actual users in the study. The paper should present this value clearly as an estimate of potential performance after unshipped fixes, and should place the observed acceptance rate (68.455% after excluding invalid/mistyped queries) as the primary quantitative result for the system as evaluated. As written, the juxtaposition of the two rates may overstate the performance of the prototype that participants actually used.
minor comments (7)
- [Section 3.3.2] The ambiguity-resolution training uses fewer than twenty examples, but the paper does not report how well this training disambiguates the parser in practice. Consider adding a small evaluation or at least a qualitative indication of the reduction in parser ambiguity.
- [Section 4.3.2] The focus score parameters (α=2, β=5, γ=500) are asserted to "achieve good result" without a sensitivity analysis or a justification of the chosen values. Since these are hand-set thresholds, a brief robustness discussion would strengthen the reproducibility of the system.
- [Section 5.2.5] The acceptance rate calculation is presented in a way that may confuse readers: 421 accepted out of 649 total queries becomes 68.455% after excluding 34 invalid/mistyped queries. Please state the denominators explicitly in one formula or table.
- [Table 2] The Likert-scale results are given only as count distributions. Adding means and standard deviations (or another summary statistic) would help readers interpret the results, and the absence of significance testing should be acknowledged in the text.
- [Section 5.2.2] The three analytical tasks are described only briefly in the main text; more complete task statements (e.g., exact questions asked of participants) would improve reproducibility. Some details appear in the appendix, but the main text does not point to them.
- [Section 3.1] The claim that FlowSense supports "the majority of dataflow diagram editing operations" is not quantified against a defined universe of operations. The six function categories are derived from 60 sample diagrams, but the paper does not report what fraction of possible VisFlow operations these categories cover. Please define the scope more precisely.
- [Appendix C] The sentence "3 participants have prior experience with VisFlow, who may yet formally evaluate it through task completion" is unclear and should be rephrased.
Circularity Check
No circularity: FlowSense's grammar, parser tuning, and user-study evaluation are independent of the claims; the usability conclusion is an empirical inference, not a construction.
full rationale
I walked the paper's derivation chain and found no step in which a claimed result is equivalent by construction to its inputs, or in which a fitted parameter is renamed as a prediction. The grammar is hand-designed by the authors, but the central usability claims are evaluated with participant-generated queries in a formal user study, not with the authors' own examples or with the small ambiguity-training set (fewer than twenty examples). The training set is explicitly used only to disambiguate derivations, and the user study uses a different dataset (SDE Test) and tasks, so the evaluation data are not the training data. The hand-set parameters mentioned in the paper (k=2 or 3, Levenshtein ratio threshold 0.2, and α=2, β=5, γ=500 for the focus score) are implementation choices that are not used to derive the paper's main contributions; they are reported as design decisions and are not presented as validated predictions. The VisFlow functions in Table 1 are derived from an empirical sample of 60 recorded VisFlow diagrams, and FlowSense then implements those functions; this is a requirements-driven engineering process, not a self-definitional reduction. The claim that FlowSense supports 'the majority of dataflow diagram editing operations in VisFlow' is supported by this sample plus the user study's query log (421 of 649 queries accepted), so it is an empirical assertion rather than a tautology. The self-citations to the authors' prior VisFlow work are used to describe the host system and data source, not to justify the novelty or correctness of FlowSense's grammar, parser, or evaluation. The user study lacks a VisFlow-only control condition, which weakens the causal attribution of the usability improvement, but this is a study-design validity concern, not a circularity of the kind enumerated in the review criteria. No uniqueness theorem is imported from the authors, no known result is merely renamed, and no ansatz is smuggled in via citation. Therefore, the paper is not circular.
Assumptions & free parameters
free parameters (3)
- Levenshtein distance ratio threshold =
0.2
- k-gram length =
2 or 3
- Focus score parameters =
alpha=2, beta=5, gamma=500
assumptions (3)
- domain assumption The six VisFlow function categories (visualizing, encoding, filtering, subset manipulation, highlighting, linking) cover the fundamental low-level visual analysis activities.
- domain assumption Special utterance placeholders make the parsing grammar independent of datasets, diagrams, and analytical tasks.
- domain assumption The sample diagram set of 60 diagrams by 16 VisFlow users is representative of VisFlow usage scenarios.
Cite this review
Pith. "Pith review of FlowSense: A Natural Language Interface for Visual Data Exploration within a Dataflow System." pith.science (2026). https://pith.science/paper/R3IMINZK
@misc{pith2026190800681,
  author       = {Pith},
  title        = {Pith review of: FlowSense: A Natural Language Interface for Visual Data Exploration within a Dataflow System},
  year         = {2026},
  howpublished = {\url{https://pith.science/paper/R3IMINZK}},
  note         = {Machine review of arXiv:1908.00681}
}
read the original abstract
Dataflow visualization systems enable flexible visual data exploration by allowing the user to construct a dataflow diagram that composes query and visualization modules to specify system functionality. However learning dataflow diagram usage presents overhead that often discourages the user. In this work we design FlowSense, a natural language interface for dataflow visualization systems that utilizes state-of-the-art natural language processing techniques to assist dataflow diagram construction. FlowSense employs a semantic parser with special utterance tagging and special utterance placeholders to generalize to different datasets and dataflow diagrams. It explicitly presents recognized dataset and diagram special utterances to the user for dataflow context awareness. With FlowSense the user can expand and adjust dataflow diagrams more conveniently via plain English. We apply FlowSense to the VisFlow subset-flow visualization system to enhance its usability. We evaluate FlowSense by one case study with domain experts on a real-world data analysis problem and a formal user study.
Figures


Figures from the paper (4 more)



Reference graph
Works this paper leans on
- [1]
-
[2]
https://www.ibm.com/products/ spss-modeler/
IBM SPSS Modeler. https://www.ibm.com/products/ spss-modeler/
-
[3]
https://www.ibm.com/watson-analytics
IBM Watson Analytics. https://www.ibm.com/watson-analytics
- [4]
- [5]
- [6]
- [7]
- [8]
Show all 58 references
-
[9]
http://www.nyc.gov/html/tlc/html/about/ trip_record_data.shtml
TLC trip records. http://www.nyc.gov/html/tlc/html/about/ trip_record_data.shtml
-
[10]
http://www.wolframalpha.com/
Wolfram Alpha. http://www.wolframalpha.com/
-
[11]
Allahyari, S
M. Allahyari, S. A. Pouriyeh, M. Assefi, S. Safaei, E. D. Trippe, J. B. Gutierrez, and K. Kochut. A brief survey of text mining: Classification, clustering and extraction techniques. In Proc. KDD Bigdas, 2017
2017
-
[12]
R. Amar, J. Eagan, and J. Stasko. Low-level components of analytic activity in information visualization. In IEEE Symposium on Information Visualization (InfoVis’05), pages 111–117, 2005
2005
-
[13]
Androutsopoulos, G
I. Androutsopoulos, G. D. Ritchie, and P. Thanisch. Natural language interfaces to databases – an introduction. Natural Language Engineering, 1(1):29–81, 1995
1995
-
[14]
Batini, E
C. Batini, E. Nardelli, and R. Tamassia. A layout algorithm for data flow diagrams. IEEE Trans. Software Engineering, 12(4):538–546, 1986
1986
-
[15]
Bavoil, S
L. Bavoil, S. P. Callahan, C. E. Scheidegger, H. T. V o, P. Crossno, C. T. Silva, and J. Freire. VisTrails: Enabling interactive multiple-view vi- sualizations. In Proc. IEEE Visualization Conference, pages 135–142, 2005
2005
-
[16]
Berant, A
J. Berant, A. Chou, R. Frostig, and P. Liang. Semantic parsing on Freebase from question-answer pairs. In Proc. Empirical Methods in Natural Language Processing (EMNLP’13), pages 1533–1544, 2013
2013
-
[17]
Clark, J
P. Clark, J. Thompson, and B. Porter. A knowledge-based approach to question-answering. In Proc. AAAI Fall Symposium on Question- Answering Systems, pages 43–51, 1999
1999
-
[18]
P. R. Cohen. The role of natural language in a multimodal interface. In Proc. 5th Annual ACM Symposium on User Interface Software and Technology (UIST’92), pages 143–149, 1992
1992
-
[19]
K. Cox, R. E. Grinter, S. L. Hibino, Lalita, J. Jagadeesan, and D. Mantilla. A multi-modal natural language interface to an information visualisation environment. International Journal of Speech Technology, 4:297–314, 2001
2001
-
[20]
L. Deng. A tutorial survey of architectures, algorithms, and applications for deep learning. APSIPA Trans. Signal and Information Processing, 3, 2014
2014
-
[21]
Dhamdhere, K
K. Dhamdhere, K. McCurley, M. Sundararajan, Q. Yan, and R. Nahmias. Analyza: Exploring data with conversation. In Proc. 22nd International Conference on Intelligent User Interfaces, pages 493–504, 2017
2017
-
[22]
E. Fast, B. Chen, J. Mendelsohn, J. Bassen, and M. S. Bernstein. Iris: A conversational agent for complex tasks. In Proc. CHI Conference on Human Factors in Computing Systems (CHI’18), 2018
2018
-
[23]
Fellbaum
C. Fellbaum. WordNet: An Electronic Lexical Database. MIT Press, 1998
1998
-
[24]
Freire, C
J. Freire, C. T. Silva, S. P. Callahan, E. Santos, C. E. Scheidegger, and H. T. V o. Managing rapidly-evolving scientific workflows. InProc. Prove- nance and Annotation of Data: International Provenance and Annotation Workshop, pages 10–18, 2006
2006
-
[25]
T. Gao, M. Dontcheva, E. Adar, Z. Liu, and K. G. Karahalios. DataTone: managing ambiguity in natural language interfaces for data visualiza- tion. In Proc. 28th Annual Symposium on User Interface Software and Technology (UIST’15), pages 489–500, 2015
2015
-
[26]
Goodfellow, Y
I. Goodfellow, Y . Bengio, and A. Courville.Deep Learning. MIT press, 2016
2016
-
[27]
Grammel, M
L. Grammel, M. Tory, and M. A. Storey. How information visualization novices construct visualizations. IEEE Trans. Visualization and Computer Graphics, 16(6):943–952, 2010
2010
-
[28]
P. E. Haeberli. ConMan: A visual programming language for interactive graphics. ACM SigGraph Computer Graphics, 22(4):103–111, 1988
1988
-
[29]
Hoque, V
E. Hoque, V . Setlur, M. Tory, and I. Dykeman. Applying pragmatics principles for interaction with visual analytics. IEEE Trans. Visualization and Computer Graphics, 24(1):309–318, 2018
2018
-
[30]
Javed and N
W. Javed and N. Elmqvist. ExPlates: Spatializing interactive analysis to scaffold visual exploration. Computer Graphics Forum, 32(2):441–450, 2013
2013
-
[31]
Kumar, J
A. Kumar, J. Aurisano, B. D. Eugenio, A. Johnson, A. Gonzalez, and J. Leigh. Towards a dialogue system that supports rich visualizations of data. In Proc. 17th Annual Meeting of the Special Interest Group on Discourse and Dialogue, 2016
2016
-
[32]
V . I. Levenshtein. Binary codes capable of correcting deletions, insertions and reversals. Soviet Physics Doklady, 10:707, 1966
1966
-
[33]
Y . Li, H. Yang, and H. V . Jagadish. NaLIX: A generic natural language search environment for XML data. ACM Trans. Database Systems, 32(4), 2007
2007
-
[34]
Liang and C
P. Liang and C. Potts. Bringing machine learning and compositional semantics together. Annual Review of Linguistics, 1:355–376, 2014
2014
-
[35]
Mackinlay, P
J. Mackinlay, P. Hanrahan, and C. Stolte. Show Me: Automatic pre- sentation for visual analysis. IEEE Trans. Visualization and Computer Graphics, 13(6):1137–1144, 2007
2007
-
[36]
C. D. Manning, M. Surdeanu, J. Bauer, J. Finkel, P. Inc, S. J. Bethard, and D. Mcclosky. The Stanford CoreNLP natural language processing toolkit. In Proc. 52nd Annual Meeting of the Association for Computational Lin- guistics (ACL’14): System Demonstrations, pages 55–60, 2014
2014
-
[37]
Meyer-Spradow, T
J. Meyer-Spradow, T. Ropinski, J. Mensmann, and K. Hinrichs. V oreen: A rapid-prototyping environment for ray-casting-based volume visualiza- tions. IEEE Computer Graphics and Applications, 29(6):6–13, 2009
2009
-
[38]
G. Navarro. A guided tour to approximate string matching. ACM Comput- ing Surveys, 33(1):31–88, 2001
2001
-
[39]
S. G. Parker and C. R. Johnson. SCIRun: A scientific programming environment for computational steering. In Proc. ACM/IEEE Conference on Supercomputing, 1995
1995
-
[40]
Pasupat and P
P. Pasupat and P. Liang. Compositional semantic parsing on semi- structured tables. In Proc. Annual Meeting of the Association for Compu- tational Linguistics (ACL’15), 2015
2015
-
[41]
J. Poco, H. Doraiswamy, H. T. V o, J. L. D. Comba, J. Freire, and C. T. Silva. Exploring traffic dynamics in urban environments using vector- valued functions. Computer Graphics Forum, 34(3):161–170, 2015
2015
-
[42]
J. C. Roberts. Waltz - an exploratory visualization tool for volume data, using multiform abstract displays. In Proc. SPIE Visual Data Exploration and Analysis V, volume 3298, pages 112–122, 1998
1998
-
[43]
J. C. Roberts. On encouraging coupled views for visualization exploration. In Proc. SPIE Visual Data Exploration and Analysis VI , volume 3643, pages 14–24, 1999
1999
-
[44]
Setlur, S
V . Setlur, S. E. Battersby, M. Tory, R. Gossweiler, and A. X. Chang. Eviza: A natural language interface for visual analysis. In Proc. 29th Annual Symposium on User Interface Software and Technology (UIST’16), pages 365–377, 2016
2016
-
[45]
Shneiderman
B. Shneiderman. The eyes have it: A task by data type taxonomy for in- formation visualizations. In Proc. IEEE Symposium on Visual Languages, pages 336–343, 1996
1996
-
[46]
M. Sipser. Introduction to the Theory of Computation. Cengage Learning, 3rd edition, 2012
2012
-
[47]
Srinivasan and J
A. Srinivasan and J. Stasko. Orko: Facilitating multimodal interaction for visual exploration and analysis of networks. IEEE Trans. Visualization and Computer Graphics, 24(1):511–521, 2018
2018
-
[48]
Srinivasan and J
A. Srinivasan and J. T. Stasko. Natural language interfaces for data analysis with visualization: Considering what has and could be asked. In Eurographics Conference on Visualization (EuroVis’17 short paper), 2017
2017
-
[49]
Y . Sun, J. Leigh, A. Johnson, and S. Lee. Articulate: A semi-automated model for translating natural language queries into meaningful visualiza- tions. In Proc. 10th International Conference on Smart Graphics, pages 184–195, 2010
2010
-
[50]
Taskar, C
B. Taskar, C. Guestrin, and D. Koller. Max-margin markov networks. MIT Press, 2003
2003
-
[51]
Upson, J
C. Upson, J. Faulhaber, T.A., D. Kamins, D. Laidlaw, D. Schlegel, J. Vroom, R. Gurwitz, and A. van Dam. The application visualization system: a computational environment for scientific visualization. IEEE Computer Graphics and Applications, 9(4):30–42, 1989
1989
-
[52]
Y . Wang, J. Berant, and P. Liang. Building a semantic parser overnight. In Proc. Annual Meeting of the Association for Computational Linguistics (ACL’15), 2015
2015
-
[53]
Wolstencroft, R
K. Wolstencroft, R. Haines, D. Fellows, A. R. Williams, D. Withers, S. Owen, S. Soiland-Reyes, I. Dunlop, A. Nenadic, P. Fisher, J. Bhagat, K. Belhajjame, F. Bacall, A. Hardisty, A. N. de la Hidalga, M. P. B. Vargas, S. Sufi, and C. A. Goble. The Taverna workflow suite: designin...
2013
-
[54]
Wu and M
Z. Wu and M. Palmer. Verbs semantics and lexical selection. InProc. 32nd Annual Meeting on Association for Computational Linguistics (ACL’94), pages 133–138, 1994
1994
-
[55]
P. Yin, Z. Lu, H. Li, and B. Kao. Neural Enquirer: Learning to query tables with natural language. In Proc. International Joint Conference on Artificial Intelligence (IJCAI’16), 2016
2016
-
[56]
Young, D
T. Young, D. Hazarika, S. Poria, and E. Cambria. Recent trends in deep learning based natural language processing. IEEE Computational Intelli- gence Magazine, 13(3):55–75, 2018
2018
-
[57]
Yu and C
B. Yu and C. T. Silva. VisFlow – Web-based visualization framework for tabular data with a subset flow model. IEEE Trans. Visualization and Computer Graphics, 23(1):251–260, 2017
2017
-
[58]
unanswered
V . Zhong, C. Xiong, and R. Socher. Seq2SQL: Generating structured queries from natural language using reinforcement learning. CoRR, abs/1709.00103, 2017. 11 FlowSense: A Natural Language Interface for Visual Data Exploration within a Dataflow System (Appendix) A FlowSense Gram...
2017 arXiv
Reviewed August 14, 2026 · model on record in the stance chip above.
Discussion (0). Continue with ORCID to comment.