REVIEW 3 major objections 5 minor 51 references
Exploring the behavior of vanadium under high-pressure and high-temperature conditions
T0 review · 3 major / 5 minor · reviewed 2026-08-14 · deepseek-v4-flash
Pith's one-line read Combining x-ray diffraction melting points, laser-heating temperature plateaus, and density-functional-theory calculations, this paper fixes the melting curve of vanadium and shows that the older diamond-cell laser-speckle curve tracked…
desk verdict First solid experimental V melting curve, but the missing error bars on temperature mean you can't verify the claimed agreement with DFT. read the letter →
The pith
A machine-rendered reading of the paper's core claim, the machinery that carries it, and where it could break.
The reading
What carries the argument
The central machinery is the agreement among three independent melting probes on one sample geometry: (1) synchrotron X-ray diffraction, where melting appears as loss of Bragg peaks and a rise in background; (2) the laser-heating temperature-plateau criterion, where the sample temperature stops rising when the absorbed power goes into melting; and (3) the Z-method DFT calculation, in which a constant-volume supercell is heated and the melting point appears as a jump in temperature-pressure behavior. The quantitative result that carries the argument is the Simon–Glatzel form $T_M(K) = 2183(1+P/32)^{0.46}$, a standard two-parameter empirical melting-curve relation. A second structural mechanism is the phonon-driven bcc-to-rhombohedral distortion that appears at room-temperature compression and is undone by heating, evidence that phonon–phonon scattering stabilizes bcc at high temperature.
What would settle it
In a fresh laser-heated diamond-anvil-cell run at 64 GPa, detect first melting with a technique that does not rely on x-ray peak loss or the temperature plateau, for example in situ x-ray radiography or a liquid diffraction signal, and compare the onset temperature with the predicted roughly 3600 K. If melting instead appears near the older speckle-based curve, about 1000 K lower, the paper's reinterpretation of the older curve as recrystallization would be wrong.
Extended reading notes
Core claim
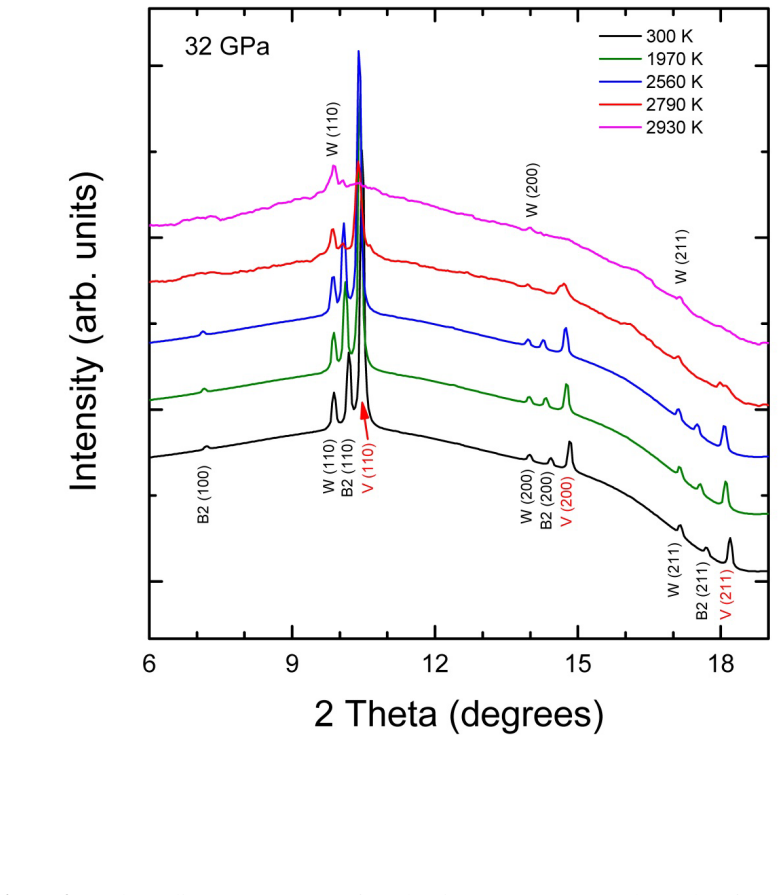
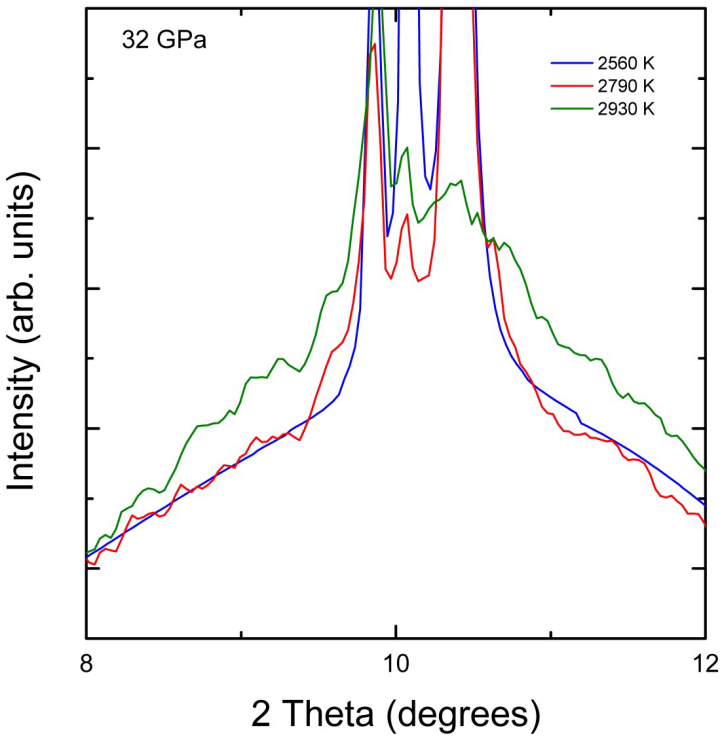
The paper claims that the melting curve of vanadium is now pinned down, because two experimental melting diagnostics and a parameter-free DFT calculation give mutually consistent melting points. In the experiments, melting was identified both by the sudden disappearance of the vanadium diffraction peaks and by the saturation of emitted thermal radiation with increasing laser power; the two diagnostics agreed within error at every pressure tested. The DFT calculations, using the Z method on a 432-atom cell, extend the curve from the experimental range to 390 GPa, where melting occurs at 6870 ± 160 K. The combined data are fit by the Simon–Glatzel equation $T_M(K) = 2183(1+P/32)^{0.46}$ (P in GPa), and this curve runs parallel to the DFT points within about 200 K. The paper also asserts that the bcc-to-rhombohedral transition is reversible at high temperature: heating a rhombohedral sample above roughly 1560–1700 K restores the bcc phase, consistent with a nearly flat phase boundary.
Load-bearing premise
Every measured melting point inherits the accuracy of the pressure and temperature metrology inside the laser-heated diamond-anvil cell; a systematic temperature offset in the gray-body emission fits, or a systematic pressure error from the NaCl, MgO, and tungsten equations of state, would shift the whole fitted curve.
Editorial extensions
If this is right
- At 80 GPa, vanadium melts at roughly 3900 K by the new curve, about 1000 K higher than the old laser-speckle diamond-cell value.
- At 200 GPa, the melting temperature is about 2000 K lower than the shock-wave-inferred value, and the measured Hugoniot temperatures reported there are also higher than the calculated Hugoniot.
- The bcc-to-rhombohedral phase transition is reversible with temperature: samples that transform to rhombohedral at room-temperature compression return to bcc when heated above 1560–1700 K.
- The experimental Simon–Glatzel fit and the DFT Z-method melting points remain parallel to at least 390 GPa, with at most 200 K difference, so the same form can be used to estimate melting temperatures at pressures beyond the experimental range.
- A new pressure–volume–temperature equation of state, fit from data up to 120 GPa and 2800 K, gives $V_0 = 13.91(3)$ Å$^3$, $K_0 = 152(4)$ GPa, and $K_0' = 5.4(4)$.
Reading between the lines
- If the disappearance of laser-speckle contrast marks recrystallization rather than melting in vanadium, the same diagnostic reinterpretation may apply to other transition metals whose static melting curves were measured with speckle methods, so those curves could be systematically low.
- The near-parallelism of the experimental Simon–Glatzel curve and the DFT Z-method curve provides a clean benchmark for testing exchange-correlation functionals on liquid bcc metals at megabar pressures.
- The reversal of the rhombohedral distortion at high temperature suggests that dynamic-compression experiments on vanadium, which are usually interpreted with room-temperature structures, will encounter the bcc phase in Hugoniot states, affecting the interpretation of sound-speed melting points.
Signed reviews
Editorial analysis
A structured set of objections, weighed in public.
Referee Report
Summary. The paper reports a combined experimental and theoretical study of the melting curve, structural phase behavior, and equation of state of vanadium up to 120 GPa and about 3750 K. Melting points are determined by synchrotron powder XRD (disappearance of V diffraction peaks) at 27, 32, 53, and 64 GPa and by temperature-plateau observations at 40, 58, and 85 GPa. These are supplemented by DFT Z-method calculations at six volumes, giving melting points up to 390 GPa and 6870 K. The authors propose a Simon-Glatzel melting curve T_M = 2183(1+P/32)^0.46, claim mutual consistency between the two experimental diagnostics and with the DFT results, and discuss the discrepancy with older speckle-DAC and shock-wave melting curves. They also report the bcc-to-rhombohedral phase boundary and a high-P-T equation of state.
Significance. If the results hold, the paper resolves a long-standing controversy for vanadium: it places the melting curve roughly 1000 K above the old speckle-DAC curve at 80 GPa and about 2000 K below the shock-wave curve at 200 GPa, with independent ab initio support. The combination of two experimental melting diagnostics and DFT calculations is a strength, as is the new high-P-T EOS and the identification of the old speckle melting curve with recrystallization. The central claim of an 'accurate' melting curve, however, depends on experimental temperatures for which no uncertainties are given, so the quantitative conclusion is not currently verifiable.
major comments (3)
- [Section 2 (Methods) and Section 3 (Results and discussion)] No experimental error bars are reported for any of the seven melting temperatures. The temperatures are obtained from gray-body fits to thermal emission (Ref. 23) with no discussion of systematic uncertainties from axial/radial gradients, emissivity, or the different heating geometries (double-side for XRD runs, single-side for plateau runs). The claim that experiments and calculations 'agree within error bars' is therefore not checkable. Please provide per-point uncertainties (including systematic contributions) and show explicitly how the Simon-Glatzel parameters in the fitted equation change under these uncertainties.
- [Section 3 (results and discussion)] The paper does not provide a table listing the seven melting points, their pressures, the diagnostic used (XRD disappearance, temperature plateau, or both), and the associated uncertainties. For the 32 GPa run, both XRD disappearance and a temperature plateau are described; for the X-ray runs at 27, 53, and 64 GPa, it is unclear whether both criteria were observed or only peak disappearance. A per-point breakdown is needed so the claimed consistency between the two experimental methods can be assessed.
- [Section 3, comparison with DFT] The extrapolated experimental curve is said to run parallel to the DFT melting curve with a maximum difference of 200 K, 'comparable with error bars of experiments and calculations.' The DFT points have stated errors (125-160 K), but the experimental errors are not defined. Please provide a quantitative residual analysis (e.g., the difference between the DFT points and the fitted Simon-Glatzel curve at each pressure) and clarify whether the fit is to the seven experimental points only, or includes the DFT points as well.
minor comments (5)
- [Figure 5 caption] The caption states 'The results at 1000 K were taken from Ref. 43,' but the text refers to the 1000 K isotherm of Crichton et al. (Ref. 46). The citation should be corrected to Ref. [46].
- [Reference list] Reference [47] appears as '[47 F. Birch' with a missing closing bracket; it should be formatted consistently with the other references.
- [Abstract and Section 3] The abstract claims experiments 'up to 120 GPa and 4000 K,' but the highest temperature reported for vanadium in the text is 3750 K at 120 GPa. Please clarify whether any experiment reached 4000 K or adjust the abstract.
- [Section 3, initial slope comparison] The initial slope of the Simon-Glatzel curve (31.4 K/GPa) is compared with 32.6 K/GPa from isobaric-heating measurements (Ref. 41). Specify the pressure range of those measurements so the comparison is meaningful.
- [Figure 4] Figure 4 is dense with many data sets; adding error bars to the experimental melting points and a table of the numerical values would make the figure and the central claim easier to evaluate.
Circularity Check
No significant circularity: the melting curve is an explicit fit to independent experimental anchors, and the DFT Z-method calculations are ab initio with no experimental melting input.
full rationale
The paper's central melting curve is an experimental determination: XRD disappearance at 27, 32, 53, 64 GPa and thermal-plateau points at 40, 58, 85 GPa are direct measurements, and the Simon-Glatzel equation is explicitly a fit to those points (Section 3). The DFT Z-method melting points are computed from VASP/PBE QMD simulations with a 432-atom cell; no experimental melting temperature is used to set or adjust any simulation parameter, and the error estimates come from the simulation's own temperature increments. The only author-overlapping citation relevant to the calculation is Ref. [28] for the Z-method implementation, but that is a methodological citation to a published method, not an input that constrains the resulting vanadium melting curve, so it does not make the claim circular. Agreement between the two independent channels is a comparison, not a construction. The reported lack of explicit experimental temperature error bars and possible systematic emissivity/gradient effects are legitimate correctness and metrology concerns, but they do not constitute a derivation that reduces to its own inputs.
Assumptions & free parameters
free parameters (10)
- Simon-Glatzel T0 =
2183 K
- Simon-Glatzel P0 =
32 GPa
- Simon-Glatzel exponent =
0.46
- Birch-Murnaghan V0 =
13.91(3) A^3
- Birch-Murnaghan K0 =
152(4) GPa
- Birch-Murnaghan K0' =
5.4(4)
- Birch-Murnaghan K0'' =
0.0477(3) GPa^-1
- Thermal EOS alpha0 =
4.6(6)e-5 K^-1
- Thermal EOS alpha1 =
-1.2(5)e-8 K^-2
- Thermal EOS dK/dT =
-0.011(1) GPa/K
assumptions (5)
- domain assumption Pressure is accurately determined from the EOS of NaCl, MgO, and tungsten (Refs. 20, 21) with cross-agreement better than 2 GPa.
- domain assumption Disappearance of V diffraction peaks and the temperature plateau both indicate true melting of vanadium.
- domain assumption The bcc-rhombohedral transition is first order, so the Clausius-Clapeyron relation can be used to infer a quasi-horizontal phase boundary.
- domain assumption PBE exchange-correlation and the Z-method molecular dynamics give accurate melting temperatures for vanadium.
- domain assumption Thermal emission spectra yield accurate sample temperatures without correction for emissivity, gradients, or wavelength-dependent effects.
Cite this review
Pith. "Pith review of Exploring the behavior of vanadium under high-pressure and high-temperature conditions." pith.science (2026). https://pith.science/paper/R3JPXT7W
@misc{pith2026190805166,
  author       = {Pith},
  title        = {Pith review of: Exploring the behavior of vanadium under high-pressure and high-temperature conditions},
  year         = {2026},
  howpublished = {\url{https://pith.science/paper/R3JPXT7W}},
  note         = {Machine review of arXiv:1908.05166}
}
read the original abstract
We report a combined experimental and theoretical study of the melting curve and the structural behavior of vanadium under extreme pressure and temperature. We performed powder x-ray diffraction experiments up to 120 GPa and 4000 K, determining the phase boundary of the bcc-to-rhombohedral transition and melting temperatures at different pressures. Melting temperatures have also been established from the observation of temperature plateaus during laser heating, and the results from the density-functional theory calculations. Results obtained from our experiments and calculations are fully consistent and lead to an accurate determination of the melting curve of vanadium. These results are discussed in comparison with previous studies. The melting temperatures determined in this study are higher than those previously obtained using the speckle method, but also considerably lower than those obtained from shock-wave experiments and linear muffin-tin orbital calculations. Finally, a high-pressure high-temperature equation of state up to 120 GPa and 2800 K has also been determined.
Figures

Figures from the paper (2 more)


Reference graph
Works this paper leans on
-
[1]
D. Errandonea, B. Schwager, R. Ditz, C. Gessmann, R. Boehler, and M. Ross, Phys. Rev. B 63, 132104 (2001)
work page 2001
-
[2]
S. Anzellini1, A. Dewaele, M. Mezouar, P. Loubeyre, and G. Morard, Science 340, 464 (2013)
work page 2013
-
[3]
R. Boehler, D. Santamaría -Pérez, D. Errandonea, and M. Mezouar, J. Phys.: Conf. Ser. 121, 022018 (2008)
work page 2008
-
[4]
T. Sun, J. P. Brodholt, Y. Li, and L. Vočadlo, Phys. Rev. B 98, 224301 (2018)
work page 2018
-
[5]
D. Errandonea, M. Somayazulu, D. Hausermann, and H. K. Mao, J. Phys.: Condensed Matter 15, 7635 (2003)
work page 2003
-
[6]
A. Dewaele, M. Mezouar, N. Guignot, and P. Loubeyre, Phys. Rev. Lett. 104, 255701 (2010)
work page 2010
-
[7]
L. Burakovsky, S. P. Chen, D. L. Preston, A. B. Belonoshko, A. Rosengren, A. S. Mikhaylushkin, S. I. Simak, and J. A. Moriarty, Phys. Rev. Lett. 104, 255702 (2010)
work page 2010
-
[8]
D. Santamaría-Pérez, M. Ross, D. Errandonea, G. D. Mukherjee, M. Mezouar, and R. Boehler, J Chem Phys. 130, 124509 (2009)
work page 2009
Show all 51 references
-
[9]
Hrubiak, Y
R. Hrubiak, Y. Meng, and G. Shen, Nature Communications 8, 14562 (2017)
2017
-
[10]
Cazorla, M
C. Cazorla, M. J. Gillan, S. Taioli, D. Alfè, J. Chem. Phys. 126, 194502 (2007)
2007
-
[11]
C. J. Wu, P. Söderlind, J. N. Glosli, and J. E. Klepeis, Nature Materials 8, 223 (2009)
2009
-
[12]
Errandonea, Nature Materials 10, 170 (2009)
D. Errandonea, Nature Materials 10, 170 (2009)
2009
-
[13]
M. Ross, D. Errandonea, and R. Boehler, Phys. Rev. B 76, 184118 (2007)
2007
-
[14]
Belonoshko, L
A. Belonoshko, L. Burakovsky, S. P. Chen, B. Johansson, A. S. Mikhaylushkin, D. L. Preston, S. I. Simak, and D. C. Swift, Phys. Rev. Lett. 100, 135701 (2008)
2008
-
[15]
Landa, P
A. Landa, P. Söderlind, and L. Yang, Phys. Rev. B 89, 020101(R) (2014)
2014
-
[16]
C. Dai, X. G. Jin, X. M. Zhou, J. Liu, and J. Hu, J. Phys. D: Appl. Phys. 34, 3064 (2001)
2001
-
[17]
Y. Ding, R. Ahuja, J. Shu, J. P. Chow, W. Luo, and H. K. Mao, Phys. Rev. Lett. 98 , 085502 (2007)
2007
-
[18]
Jenei, H
Z. Jenei, H. P. Liermann, H. Cynn, J. H. P. Klepeis, B. J. Baer, and W. J . Evans, Phys Rev B. 83, 054101 (2011)
2011
-
[19]
Y. X. Wang, Q. Wu, X. R. Chen, H. Y. Geng, Scientific Reports 6, 32419 (2016)
2016
-
[20]
P. I. Dorogokupets and A. Dewaele, High Press. Res. 27, 431 (2007)
2007
-
[21]
K. D. Litasov, P. N. Gavryushkin1, P. I. Dorogokupets, I. S. Sharygin1, A. Shatskiy, Y. Fei, S. V. Rashchenko, Y. V. Seryotkin, Y. Higo, K. Funakoshi, and E. Ohtani, J. Appl. Phys. 113, 133505 (2013). 14
2013
-
[22]
Schultz, M
E. Schultz, M. Mezouar, W. Crichton, S. Bauchau, G. Blattmann, D. Andrault, G. Fiquet, R. Boehler, N. Rambert, B. Sitaud, and P. Loubeyre, High. Press. Res. 25, 71 (2005)
2005
-
[23]
G. Shen, M. I. Rivers, Y. B. Wang, and S. R. Sutton, Rev. Sci. Instrum. 72, 1273 (2001)
2001
-
[24]
Kraus and G
W. Kraus and G. Nolze, J. Appl. Cryst. 29, 301 (1996)
1996
-
[25]
Errandonea, Phys
D. Errandonea, Phys. Rev. B 87, 054108 (2013)
2013
-
[26]
Dewaele, M
A. Dewaele, M. Torrent, P. Loubeyre. and M. Mezouar, Phys. Rev. B 78, 104102 (2008)
2008
-
[27]
C. K. Singh, B. K. Pande, and A. K. Pandey, AIP Conference Proceedings 1953, 130002 (2018)
2018
-
[28]
Burakovsky, N
L. Burakovsky, N. Burakovsky, M. J. Cawkwell, D. L. Preston, D. Errandonea, and S. I. Simak Phys. Rev. B 94, 094112 (2016)
2016
-
[29]
Errandonea, J
D. Errandonea, J. Phys. Chem. Sol. 70, 1117 (2009)
2009
-
[30]
V. B. Prakapenka, G. Shen, and L. S. Dubrovinsky, High Temp. High Press. 35, 2 (2003)
2003
-
[31]
Antonangeli, D
D. Antonangeli, D. L. Farber, A. Bosak, C. M. Aracne, D. G. Ruddle, and M. Krisch, Scientific Reports 6, 31887 (2016)
2016
-
[32]
P. D. Bogdanoff, B. Fultz, J. L. Robertson, and L. Crow, Phys. Rev. B 65, 014303 (2001)
2001
-
[33]
Boehler, M
R. Boehler, M. Ross, and D. B. Boercker, Phys. Rev. Lett. 78, 4589 (1997)
1997
-
[34]
O. T. Lord, I. G. Wood, D. P. Dobson, L. Vočadlo, W. Wang, A. R. Thomson, E. Wann, G. Morard, M. Mezouar, and M. J. Walter, Earth Planet. Sci. Lett. 408, 226 (2014)
2014
-
[35]
Dewaele, M
A. Dewaele, M. Mezouar, N. Guignot, and P. Loubeyre, Phys. Rev. B 76, 144106 (2007)
2007
-
[36]
Anzellini, V
S. Anzellini, V. Monteseguro, E. Bandiello, A. Dewaele, L. Burakovsky, and D. Errandonea, Scientific Report 9 (2019), in press
2019
-
[37]
R. G. McQueen and S. P. Marsh, J. Appl. Phys. 31, 1253 (1960)
1960
-
[38]
J. M. Foster, A. J. Comley, G. S. Case, P. Avraam, S. D. Rothman, A. Higginbotham, E. K. R. Floyd, E. T. Gumbrell, J. J. D. Luis, D. McGonegle, N. T. Park, L. J. Peacock, C. P. Poulter, M. J. Suggit, and J. S. Wark, J. Appl. Phys. 122, 023517 (2017)
2017
-
[39]
Errandonea, J
D. Errandonea, J. Appl. Phys. 108, 033517 (2010)
2010
-
[40]
F. E. Simon and G. Glatzel, Z. Anorg. Chem. 178, 309 (1929)
1929
-
[41]
G. R. Gathers, J. W. Shaner, R. S. Hixson and D. A. Young, High T - High P 11, 653 (1979)
1979
-
[42]
Jarmakani, B
H. Jarmakani, B. Maddox, C. T. Wei, D. Kalantar, and M. A. Meyers, Ac ta Mater. 58, 4604 (2010)
2010
-
[43]
S. I. Ashitkov, P. S. Komarov, E. V. Struleva, M. B. Agranat, and G. I. Kanel, JETP Letters 101, 276 (2015)
2015
-
[44]
Ohta and M
Y. Ohta and M. Shimizu, Physica B 154, 113 (1988)
1988
-
[45]
Burakovsky, D
L. Burakovsky, D. L. Preston and R. R. Silbar, J. Appl. Phys. 88, 6294 (2000). 15
2000
-
[46]
W. A. Crichton, J. Guignard, E. Bailey, D. P. Dobson, S. A. Hunt, and A. R. Thomson, High Press. Res. 36, 16 (2016). [47 F. Birch, J. Geophys. Res. 83, 1257 (1978)
2016
-
[48]
Errandonea, Ch
D. Errandonea, Ch. Ferrer -Roca, D. Martinez -Garcia, A. Segura, O. Gomis, A. Munoz, P. Rodriguez-Hernandez, J. Lopez-Solano, S. Alconchel, F. Sapina, Phys. Rev. B 82, 174105 (2010)
2010
-
[49]
Errandonea, A
D. Errandonea, A. Muñoz, and J. Gonzalez-Platas, J. Appl. Phys. 115, 216101 (2014)
2014
-
[50]
R. J. Angel, J. Gonzalez-Platas, and A. Alvaro, Z. Kristallogr. 229, 405 (2014)
2014
-
[51]
Anzellini, D
S. Anzellini, D. Errandonea, S. G. MacLeod, P. Botella, D. Daisenberger, J. M. De’Ath, J. Gonzalez-Platas, J. Ibáñez, M. I. McMahon, K. A. Munro, C. Popescu, J. Ruiz -Fuertes, and C. W. Wilson, Phys. Rev. Mat. 2, 083608 (2018)
2018
-
[52]
Errandonea, S
D. Errandonea, S. G. MacLeod, J. Ruiz -Fuertes, L. Burakovsky, M. I. McMahon, C. W. Wilson, J. Ibañez, D. Daisenberger, and C. Popescu, J. Phys.: Condens. Matter 30, 295402 (2018). 16 Figure 1: (Color online) XRD patterns at selected pressures and temperatures (indicated in th...
2018
Reviewed August 14, 2026 · model on record in the stance chip above.
Discussion (0). Continue with ORCID to comment.