REVIEW 3 major objections 5 minor 50 references
T1, T2, and complex permittivities of hydrogels, paramagnetic salt solutions, and oils at 0.35, 1.5, and 3 Tesla
T0 review · 3 major / 5 minor · reviewed 2026-08-12 · deepseek-v4-flash
Pith's one-line read Measurements of T1, T2, and complex permittivity for common MRI phantom materials at 0.35, 1.5, and 3 T support specific material recommendations for phantom builders.
desk verdict Useful multi-field phantom-material reference, solid on T1/T2, but the low-frequency permittivity extrapolation needs validation before the recipe tables are used uncritically. read the letter →
The pith
A machine-rendered reading of the paper's core claim, the machinery that carries it, and where it could break.
The reading
What carries the argument
The machinery is the measurement and fitting protocol: inversion-recovery EPI for T1, CPMG multi-spin-echo for T2, and open-ended coaxial-probe permittivity sweeps run through a Cole-Cole relaxation fit to extract the static dielectric constant $\varepsilon_s$ and static electrical conductivity $\sigma_s$. Linear fits of relaxation rate $R_n = R_{n,0} + r_n[C]$ versus concentration convert raw relaxation times into relaxivities, and a power law $T_1(B_0) = A\,B_0^C$ is used to interpolate 0.55 T and extrapolate 7 T values.
What would settle it
Measure the same samples with a dielectric probe rated below 14 MHz, or with time-domain reflectometry, and compare the independently obtained $\varepsilon_s$ and $\sigma_s$ with the extrapolated values in Tables 3-15; disagreement beyond the reported uncertainties would overturn the permittivity claims. A second check is the paper's own observation in Figure 1 that the 7 T extrapolated $R_1$ at 5% w/w Miller's LB agar falls below the 4% w/w value: measuring $T_1$ at 7 T across all concentrations would show how often the power-law extrapolation fails.
Extended reading notes
Core claim
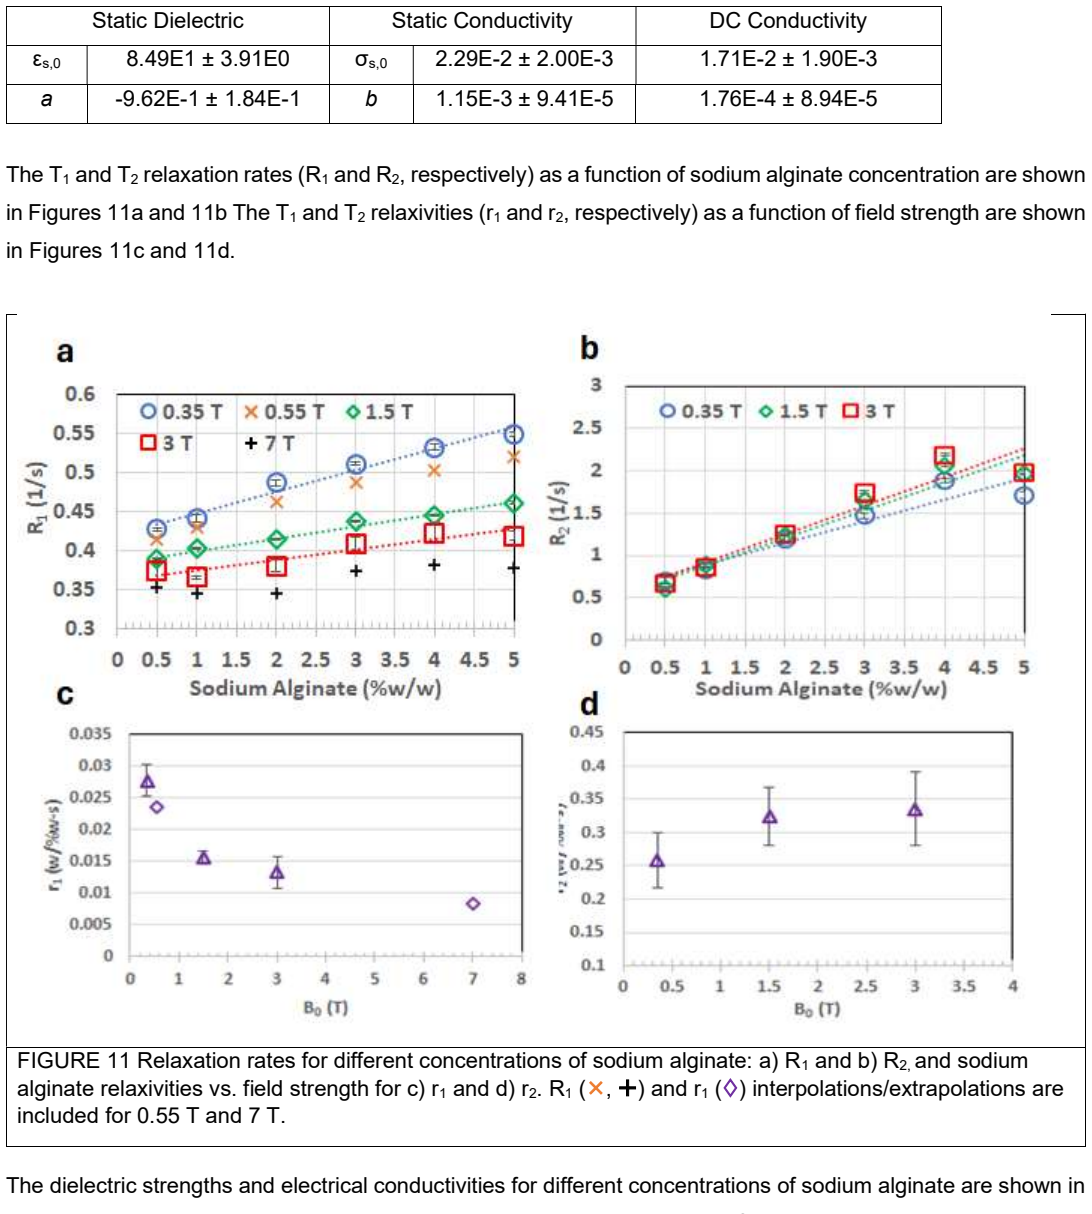
The paper's claim is that these measurements form a reliable, internally consistent dataset for common MRI phantom constituents across clinically relevant field strengths, with concentration sweeps wide enough to extract relaxivities and conductivity slopes. On its own terms, the important findings are that T1 decreased with increasing concentration except for PEG; that the T1 and T2 relaxivities of PEG, PVP, sodium polyacrylate, and deionized water did not vary significantly with field strength; that the T2 relaxivities of gelatin and sodium alginate did not vary significantly; and that the common assumption that T1 rises or r1 falls with field strength fails for several samples. The authors further conclude that sodium alginate, Miller's LB agar, and xanthan gum are good hydrogel candidates, Mn(NO3)2 has the highest relaxivities, and all three oils are good low-dielectric (epsilon_s < 10) phantom materials with low conductivities.
Load-bearing premise
The load-bearing premise is that dielectric-probe readings taken down to 14 MHz, far below the probe's rated 200 MHz lower limit, can be extrapolated through a Cole-Cole fit into accurate static dielectric constants and conductivities; the paper's own Figure 1 note says one 7 T relaxation extrapolation is false, which shows the wider extrapolation chain can break.
Editorial extensions
If this is right
- Concentration-tuning recipes become practical: Mn(NO3)2 changes T1 and T2 at sub-millimolar concentrations, while CuSO4 and NiCl2 need higher concentrations to reach the same relaxation rates.
- For PEG, PVP, and sodium polyacrylate, the field-independent relaxivities mean a recipe calibrated at one clinical field should transfer to another without re-measurement.
- The oils' low dielectric constants (epsilon_s < 10) and low conductivities make them suitable for high-field phantom compartments where dielectric artifacts must be minimized.
- Because conductivity rises linearly with concentration for most hydrogels and salts, RF-heating and SAR phantoms can be tuned by concentration; PEG and PVP are the exceptions.
- The 0.55 T and 7 T values are offered as starting points, with the paper itself warning that some extrapolations (for example, 5% w/w Miller's LB agar at 7 T) are not trustworthy.
Reading between the lines
- Because the dielectric probe is rated only down to 200 MHz, the 14 MHz and static permittivity values rest on model extrapolation; a direct low-frequency measurement would tell whether the reported $\varepsilon_s$ and $\sigma_s$ are accurate.
- The paper characterizes single or duplex materials only, so combined phantoms (gel plus paramagnetic salt) may behave differently since electrolytes can affect gelling; combined recipes need direct validation before adoption.
- If the field independence of PEG, PVP, and sodium polyacrylate relaxivities extends beyond 3 T, those polymers could become transferable phantom standards at ultra-high field, but the 7 T numbers here are extrapolations, not measurements.
- A natural test is to build a multi-compartment phantom from the recommended materials and image it at 0.55 T and 7 T; those results would extend or correct the interpolation and extrapolation tables.
Editorial analysis
A structured set of objections, weighed in public.
Referee Report
Summary. The paper reports T1, T2, and complex permittivity measurements for a panel of MRI phantom constituents—seven hydrogels, three paramagnetic salt solutions, and three oils—at 0.35, 1.5, and 3 T, with concentrations varied per material. T1 and T2 were acquired with standard IR-EPI and CPMG sequences at the three field strengths and fitted to monoexponential models; relaxivities are obtained from linear concentration fits. Complex permittivities were measured with coaxial dielectric probes over roughly 14 MHz to 1–1.5 GHz and fitted to a Cole-Cole model to extract static dielectric constants and static conductivities. The authors use a power law in B0 to interpolate T1 to 0.55 T and extrapolate to 7 T, and they draw practical conclusions about which materials are suitable as MRI phantom components, including that sodium alginate, Miller's LB agar, and xanthan gum are good hydrogel candidates, Mn(NO3)2 has the highest relaxivities, and the three oils are suitable low-dielectric materials.
Significance. If the dataset is reliable, it fills a practical gap: phantom builders currently need to assemble relaxation times, relaxivities, and permittivities from scattered sources or from studies at a single field strength. The paper's direct, multi-field comparison of common, inexpensive, commercially available phantom materials, with reported fit uncertainties, is potentially useful for QA phantom design in MR-guided radiotherapy (0.35 T), clinical imaging (1.5 and 3 T), and low-field/high-field applications. The study is also a useful reminder that simple field-strength scaling assumptions for T1 and relaxivity do not hold for every material; several reported deviations, such as r2 decreasing with field for CuSO4 and r1 rising for NiCl2, are falsifiable observations that can guide future modeling. The T1/T2 measurements are the strongest part because they are direct measurements at the target field strengths, use standard sequences, and include comparisons to earlier work for CuSO4, NiCl2, and sodium alginate.
major comments (3)
- [Methods, Permittivities paragraph] The two instrument specification statements are internally inconsistent, and this matters because the low-frequency credibility of the results is at stake. The text first says the Agilent E4991A impedance analyzer has a rated range of 10 MHz to 3 GHz, then later says the 85070E/E5061A network analyzer combination is rated for 200 MHz to 20 GHz. No cross-check between the two configurations on the same samples is reported, so the reader cannot tell which configuration, if any, supports the 14 MHz lower bound claimed for the measurements. Please clarify which analyzer was used for which samples, report the manufacturer's rated frequency range for each configuration, and provide a direct comparison measurement between the two setups over a common frequency band.
- [Figure 1 caption and Table 3] The 7 T extrapolation is shown to be nonphysical for Miller's LB agar within the paper itself. The Figure 1 caption notes that the extrapolated R1 at 7 T for 5% w/w is lower than R1 for 4% w/w, so the power-law extrapolation of Eq. (3) reverses the monotonic concentration ordering at 7 T. Since T1 interpolation/extrapolation is presented as a deliverable in the Highlights and is used to compute r1 values, the authors should either restrict the claimed validity of Eq. (3) to the measured range or provide a criterion for when the power-law extrapolation is reliable; as written, the paper acknowledges a counterexample to its own extrapolation procedure for one of the recommended hydrogels.
- [Eq. (3) and relaxivity r1 values] The 0.55 T and 7 T r1 values are not independent predictions. Equation (3), with two free parameters A and C, is fitted to exactly three measured field strengths (0.35, 1.5, 3 T), leaving zero degrees of freedom; the 0.55 T interpolation and the 7 T extrapolation are deterministic transformations of the three measured points, and the quoted r1 uncertainties do not propagate the fit uncertainty or the model-form uncertainty. This should be stated explicitly wherever interpolated/extrapolated r1 values appear, and the error bars on those values should be presented as lower bounds or omitted.
minor comments (5)
- [Methods, Hydrogels paragraph] Polyethylene glycol 8000 is described with molecular weight 62.07 g/mol, which is the molecular weight of the ethylene glycol monomer, not PEG 8000; the correct nominal molecular weight should be on the order of 8000 g/mol. Please correct the value or the label.
- [Abstract and Introduction] The abstract contains an unbalanced parenthesis: 'low dielectric (εs<10) phantoms for high field applications) but with low conductivities.' Please remove the extra closing parenthesis.
- [Table 14] For deionized water, the reported T2 values are 2051.72 ms at 0.35 T, 1755.22 ms at 1.5 T, and 2422.19 ms at 3 T; a non-monotonic field dependence of T2 for pure water is unexpected and deserves a brief comment on possible measurement or fitting effects, since T2 of free water is generally expected to be nearly field-independent.
- [Tables 3–13] Several table captions state 'measured at room temperature 20°C' while the Methods report 21°C for relaxation and 21.5°C for DC conductivity; please harmonize the temperature notation so readers can reproduce the measurements.
- [Data Availability] The Data Availability statement says data may be provided upon request. Given the paper's goal of serving as a reference dataset, depositing the raw T1/T2 fits and permittivity spectra (e.g., in a repository) would substantially increase the utility and verifiability of the tables.
Circularity Check
No circularity: the paper reports directly measured relaxation and permittivity data, and its interpolations/extrapolations are transparently labeled rather than presented as independent predictions.
full rationale
The paper is a measurement study rather than a derivation. T1 and T2 are acquired directly at 0.35, 1.5, and 3 T with inversion-recovery and CPMG sequences, and the reported values in Tables 3-14 are the fitted outputs of those measurements. The 0.55 T and 7 T values are explicitly produced by fitting Eq. (3) to the three measured field strengths and are labeled as interpolations/extrapolations; the paper even notes in Figure 1 that the Miller's LB agar 7 T extrapolation produces a nonphysical inversion, so it does not hide the fitted nature of these numbers. The complex permittivity analysis uses a standard Cole-Cole fit, and the static conductivity is obtained from the imaginary permittivity via Eq. (4) in a conventional manner; no fitted parameter is renamed as an independent prediction. The only self-citation is reference 23 (Gach 2019), used among several standard references for the Cole-Cole fitting approach; it is not load-bearing because the fitting model, the calibration procedure, and all target values in this paper are independently presented and measured here. The extrapolation of permittivities below the dielectric probe's rated 200 MHz lower bound is a genuine metrological limitation and should be checked against low-frequency instrumentation, but it is an openly stated extrapolation, not a circular step that equates an output with an input. No step in the paper's chain reduces by construction to its own assumptions or to an unverified self-citation, so the circularity score is 0.
Assumptions & free parameters
free parameters (4)
- Power-law prefactor A and exponent C for T1(B0) interpolation/extrapolation (Eq 3) =
not reported per material
- Linear relaxivity slopes r1 and r2 (Eq 7) =
reported in Tables 3-13 per material and field strength
- Linear permittivity/conductivity slopes a and b and intercepts (Eqs 5-6) =
reported in Tables 3-13
- Cole-Cole model parameters (epsilon_s, relaxation time, width, sigma_s) =
static epsilon_s and sigma_s reported; other parameters not shown
assumptions (4)
- domain assumption T1 follows a power law in field strength, T1(B0)=A B0^C (Eq 3)
- domain assumption Relaxation rate is linear in concentration, R_n = R_n0 + r_n [C] (Eq 7)
- domain assumption Cole-Cole model with extrapolation below the probe rated range yields valid static epsilon_s and sigma_s
- domain assumption Single preparation per concentration and single-slice acquisition are representative
Cite this review
Pith. "Pith review of T1, T2, and complex permittivities of hydrogels, paramagnetic salt solutions, and oils at 0.35, 1.5, and 3 Tesla." pith.science (2026). https://pith.science/paper/RAULO5KV
@misc{pith2026260811117,
  author       = {Pith},
  title        = {Pith review of: T1, T2, and complex permittivities of hydrogels, paramagnetic salt solutions, and oils at 0.35, 1.5, and 3 Tesla},
  year         = {2026},
  howpublished = {\url{https://pith.science/paper/RAULO5KV}},
  note         = {Machine review of arXiv:2608.11117}
}
read the original abstract
Approach: The T1, T2, and complex permittivities of candidate MRI phantom constituents (hydrogels, paramagnetic electrolytes, and oils) were measured at different magnetic field strengths and concentrations. Data: T1 decreased with increasing concentration except for PEG. The T1 and T2 relaxivities of polyethylene glycol (PEG), polyvinylpyrrolidone (PVP), sodium polyacrylate, and deionized water did not significantly vary with field strength. The T2 relaxivities of gelatin and sodium alginate did not significantly vary with field strength. All of the hydrogels and paramagnetic electrolyte solutions had high static dielectrics (e.g., {\epsilon}s~70) similar to water. The static electrical conductivities of Miller's LB agar, gelatin, PVA, sodium alginate, sodium polyacrylate, xanthan gum, CuSO4, NiCl2, and Mn(NO3)2 rose with concentration. However, the conductivities of PEG and PVP did not rise with concentration. Conclusions: Sodium polyacrylate, PVP, and PEG hydrogels are challenging for generating consistent phantoms. Sodium alginate, Miller's LB agar, and xanthan gum were good hydrogel candidates. Mn(NO3)2 had the highest relaxivities of the tested samples. All three oils (canola, castor, and grapeseed) are good candidates for low dielectric ({\epsilon}s<10) phantoms for high field applications) but with low conductivities.
Figures


Figures from the paper (2 more)


Reference graph
Works this paper leans on
-
[1]
A large variety of commercial MRI phantoms are available
INTRODUCTION Phantoms are an essential tool for MRI quality assurance (QA). A large variety of commercial MRI phantoms are available. However, commercial phantoms can be expensive especially for MRI facilities with limited funding. Home-built phantoms may be satisfactory for many applications and their materials may be cheap. The design of a phantom requi...
-
[2]
METHODS Relaxation times and relaxivities were measured at 21°C for three field strengths: 0.35 T (ViewRay MRIdian MRI-Linac, VB19), 1.5 T (Philips Ingenia MRI, V5.7), and 3 T (Siemens mMR PET-MRI, VE11P). T 1 was measured using an inversion recovery (IR) echo planar imaging (EPI) sequence with 26-30 variable inversion times (TIs) ranging from 21 ms to 5 ...
work page 2000
-
[3]
RESULTS Data plots of the relaxation rates, relaxivities, static dielectrics, static electrical conductivities, and DC conductivities are provided in Figures 1-23. Error bars represent uncertainties in nonlinear fits for T1 and T2 relaxation rates (R1 and R2, respectively) vs. concentration, and linear fits for T1 and T2 relaxivities (r1 or r2, respective...
-
[4]
The relaxation times, relaxivities, and permittivity measurements for gelatin are summarized in Table 4. FIGURE 4 Static dielectric constant εs (, left axis), static electrical conductivity σs () and DC conductivity σDC from the conductivity meter (Δ) are shown for different concentrations of gelatin in water. σs and σDC were highly correlated (r=0.966)...
-
[5]
CONCLUSIONS In principle, T 1 of tissue should increase with field strength while T2 should not vary with field strength.28,29 However, the T1 of NiCl2 did not rise with field strength. We observed T2 decreasing with increasing field strength in PEG, PVA, sodium polyacrylate, and Mn(NO3)2. T2 increased with field strength in CuSO4. T 1 relaxivities (r1) m...
-
[6]
Principles of Nuclear Magnetic Resonance Spectroscopy
Callaghan PT. Principles of Nuclear Magnetic Resonance Spectroscopy. Oxford: Clarendon Press; 1993
work page 1993
-
[7]
Bottomley PA, Hardy CJ, Argersinger RE, Allen-Moore G. A review of 1H nuclear magnetic resonance relaxation in pathology: are T1 and T2 diagnostic? Med Phys. 1987;14(1):1-37
work page 1987
-
[8]
Horkay F, Tasaki I, Basser PJ. Effect of monovalent-divalent cation exchange on the swelling of polyacrylate hydrogels in physiological salt solutions. Biomacromolecules. 2001;2(1):195-199
work page 2001
Show all 50 references
-
[9]
MRI phantoms - are there alternatives to agar? PLoS One
Hellerbach A, Schuster V, Jansen A, Sommer J. MRI phantoms - are there alternatives to agar? PLoS One. 2013;8(8):e70343
2013
-
[10]
New polyvinyl alcohol gel material for MRI phantoms
Mano I, Goshima H, Nambu M, Iio M. New polyvinyl alcohol gel material for MRI phantoms. Magn Reson Med. 1986;3(6):921-926
1986
-
[11]
Khasawneh A, Kuroda M, Yoshimura Y, et al. Development of a novel phantom using polyethylene glycol for the visualization of restricted diffusion in diffusion kurtosis imaging and apparent diffusion coefficient subtraction method [published online ahead of print 20200922]. Bio...
2020
-
[12]
Narrative review of tissue-mimicking materials for MRI phantoms: Composition, fabrication, and relaxation properties [published online ahead of print 20241022]
Yusuff H, Chatelin S, Dillenseger JP. Narrative review of tissue-mimicking materials for MRI phantoms: Composition, fabrication, and relaxation properties [published online ahead of print 20241022]. Radiography (Lond). 2024;30(6):1655-1668
2024
-
[13]
Temperature and concentration calibration of aqueous polyvinylpyrrolidone (PVP) solutions for isotropic diffusion MRI phantoms
Wagner F, Laun FB, Kuder TA, et al. Temperature and concentration calibration of aqueous polyvinylpyrrolidone (PVP) solutions for isotropic diffusion MRI phantoms. PLoS One. 2017;12(6):e0179276
2017
-
[14]
An acetone-based phantom for quantitative diffusion MRI
Wang X, Reeder SB, Hernando D. An acetone-based phantom for quantitative diffusion MRI. J Magn Reson Imaging. 2017;46(6):1683-1692
2017
-
[15]
MR relaxation times of agar-based tissue-mimicking phantoms [published online ahead of print 20220412]
Antoniou A, Georgiou L, Christodoulou T, et al. MR relaxation times of agar-based tissue-mimicking phantoms [published online ahead of print 20220412]. J Appl Clin Med Phys. 2022;23(5):e13533
2022
-
[16]
Fabrication of a spherical inclusion phantom for validation of magnetic resonance-based magnetic susceptibility imaging [published online ahead of print 20190805]
Kim JH, Kim JH, Lee SH, Park J, Lee SK. Fabrication of a spherical inclusion phantom for validation of magnetic resonance-based magnetic susceptibility imaging [published online ahead of print 20190805]. PLoS One. 2019;14(8):e0220639
2019
-
[17]
Quantification of substitution of gelatin methacryloyl: Best practice and current pitfalls
Claassen C, Claassen MH, Truffault V, et al. Quantification of substitution of gelatin methacryloyl: Best practice and current pitfalls. Biomacromolecules. 2018;19(1):42-52
2018
-
[18]
Development of oil-in-gelatin phantoms for viscoelasticity measurement in ultrasound shear wave elastography [published online ahead of print 20131018]
Nguyen MM, Zhou S, Robert JL, Shamdasani V, Xie H. Development of oil-in-gelatin phantoms for viscoelasticity measurement in ultrasound shear wave elastography [published online ahead of print 20131018]. Ultrasound Med Biol. 2014;40(1):168-176
2014
-
[19]
Magnetic resonance imaging phantoms for quality-control of myocardial T1 and ECV mapping: specific formulation, long-term stability and variation with heart rate and temperature
Vassiliou VS, Heng EL, Gatehouse PD, et al. Magnetic resonance imaging phantoms for quality-control of myocardial T1 and ECV mapping: specific formulation, long-term stability and variation with heart rate and temperature. J Cardiovasc Magn Reson. 2016;18(1):62
2016
-
[20]
Aqueous paramagnetic solutions for MRI phantoms at 3 T: A detailed study on relaxivities
Thangavel K, Saritas EU. Aqueous paramagnetic solutions for MRI phantoms at 3 T: A detailed study on relaxivities. Turkish Journal of Electrical Engineering and Computer Sciences. 2017;25(3):2108- 2121
2017
-
[21]
Electrical properties of vegetable oils between 20 Hz and 2 MHz
Corach J, Sorichetti PA, Romano SD. Electrical properties of vegetable oils between 20 Hz and 2 MHz. International Journal of Hydrogen Energy. 2014;39(16):8754-8758
2014
-
[22]
A heterogeneous human tissue mimicking phantom for RF heating and MRI thermal monitoring verification [published online ahead of print 20120320]
Yuan Y, Wyatt C, Maccarini P, et al. A heterogeneous human tissue mimicking phantom for RF heating and MRI thermal monitoring verification [published online ahead of print 20120320]. Phys Med Biol. 2012;57(7):2021-2037
2012
-
[23]
Design of a breast phantom for quantitative MRI [published online ahead of print 20160307]
Keenan KE, Wilmes LJ, Aliu SO, et al. Design of a breast phantom for quantitative MRI [published online ahead of print 20160307]. J Magn Reson Imaging. 2016;44(3):610-619
2016
-
[24]
Development of an anthropomorphic spine phantom suitable for fusion of MR neurography with interventional flat-panel CT [published online ahead of print 20190121]
Kobe A, Zadory M, Hamie QM, et al. Development of an anthropomorphic spine phantom suitable for fusion of MR neurography with interventional flat-panel CT [published online ahead of print 20190121]. Eur J Radiol. 2019;112:153-160
2019
-
[25]
An improved technique for permittivity measurements using a coaxial probe
Blackham DV, Pollard RD. An improved technique for permittivity measurements using a coaxial probe. IEEE Transactions on Instrumentation and Measurement. 1997;46(5):1093-1099
1997
-
[26]
Dielectric measurement: error analysis and assessment of uncertainty
Gabriel C, Peyman A. Dielectric measurement: error analysis and assessment of uncertainty. Phys Med Biol. 2006;51:6003-6046
2006
-
[27]
Dispersion and absorption in dielectrics: I
Cole KS, Cole RH. Dispersion and absorption in dielectrics: I. Alternating current characteristics. J Chem Phys. 1941;9:341-351
1941
-
[28]
Technical Note: T1 and T2 and complex permittivities of mineral oil, silicone oil, and glycerol at 0.35, 1.5, and 3 T
Gach HM. Technical Note: T1 and T2 and complex permittivities of mineral oil, silicone oil, and glycerol at 0.35, 1.5, and 3 T. Med Phys. 2019;46(4):1785-1792
2019
-
[29]
Permittivity measurements using open-ended sensors and reference liquid calibration-an uncertainty analysis
Nyshadham A, Sibbald CL, Stuchly SS. Permittivity measurements using open-ended sensors and reference liquid calibration-an uncertainty analysis. IEEE Transactions on Microwave Theory and Technologies. 1992;42(2):305-314
1992
-
[30]
Recipe for Hydrogels With Tunable Relaxation and Diffusion Properties for Use as MRI Test Materials [published online ahead of print 20251005]
Fritz V, Schick F. Recipe for Hydrogels With Tunable Relaxation and Diffusion Properties for Use as MRI Test Materials [published online ahead of print 20251005]. Magn Reson Med. 2026;95(3):1823- 1832
2026
-
[31]
Water in agarose gels studied by nuclear magnetic resonance relaxation in the rotating frame
Andrasko J. Water in agarose gels studied by nuclear magnetic resonance relaxation in the rotating frame. Biophys J. 1975;15(12):1235-1243
1975
-
[32]
Viscosity of glycerol and its aqueous solutions
Segur JB, Oberstar HE. Viscosity of glycerol and its aqueous solutions. Ind Eng Chem. 1951;43(9):2117-2120
1951
-
[33]
A review of normal tissue hydrogen NMR relaxation times and relaxation mechanisms from 1-100 MHz: dependence on tissue type, NMR frequency, temperature, species, excision, and age
Bottomley PA, Foster TH, Argersinger RE, Pfeifer LM. A review of normal tissue hydrogen NMR relaxation times and relaxation mechanisms from 1-100 MHz: dependence on tissue type, NMR frequency, temperature, species, excision, and age. Med Phys. 1984;11(4):425-448
1984
-
[34]
T1, T2 relaxation and magnetization transfer in tissue at 3T
Stanisz GJ, Odrobina EE, Pun J, et al. T1, T2 relaxation and magnetization transfer in tissue at 3T. Magn Reson Med. 2005;54(3):507-512
2005
-
[35]
Influence of molecular parameters and increasing magnetic field strength on relaxivity of gadolinium- and manganese-based T1 contrast agents
Caravan P, Farrar CT, Frullano L, Uppal R. Influence of molecular parameters and increasing magnetic field strength on relaxivity of gadolinium- and manganese-based T1 contrast agents. Contrast Media Mol Imaging. 2009;4(2):89-100
2009
-
[36]
Relaxation rates of paramagnetic solutions: evaluation by nuclear magnetic resonance imaging
Bucciolini M, Ciraolo L, Renzi R. Relaxation rates of paramagnetic solutions: evaluation by nuclear magnetic resonance imaging. Med Phys. 1986;13(3):298-303
1986
-
[37]
A new model for complex permittivity of oil-seawater emulsions: A framework for quantitative SAR monitoring of marine oil spills
Cheng Y, Du Y, Liu J, Li L, Wang D. A new model for complex permittivity of oil-seawater emulsions: A framework for quantitative SAR monitoring of marine oil spills. Journal of Environmental Chemical Engineering. 2025;13(5):117920
2025
-
[38]
Evaluation of relaxation time measurements by magnetic resonance imaging
Kjaer L, Thomsen C, Henriksen O, Ring P, Stubgaard M, Pedersen EJ. Evaluation of relaxation time measurements by magnetic resonance imaging. A phantom study. Acta Radiol. 1987;28(3):345-351
1987
-
[39]
Dielectric properties of edible oils and fatty acids as a function of frequency, temperature, moisture and composition
Lizhi H, Toyoda K, Ihara I. Dielectric properties of edible oils and fatty acids as a function of frequency, temperature, moisture and composition. Journal of Food Engineering. 2008;88:151-158
2008
-
[40]
Synthesized tissue-equivalent dielectric phantoms using salt and polyvinylpyrrolidone solutions
Ianniello C, de Zwart JA, Duan Q, et al. Synthesized tissue-equivalent dielectric phantoms using salt and polyvinylpyrrolidone solutions. Magn Reson Med. 2018;80(1):413-419
2018
-
[41]
Giannakopoulos, II, Arduino A, van den Berg CAT, et al. Construction of phantoms for MR electrical properties tomography (fom structure to composition): A guideline From the ISMRM Electro-Magnetic Tissue Properties Study Group [published online ahead of print 20250820]. J Magn...
2026
-
[42]
MR relaxation properties of tissue-mimicking phantoms [published online ahead of print 20211004]
Antoniou A, Damianou C. MR relaxation properties of tissue-mimicking phantoms [published online ahead of print 20211004]. Ultrasonics. 2022;119:106600
2022
-
[43]
Alacik Develioglu I, Ozel B, Sahin S, Oztop MH. NMR relaxometry and magnetic resonance imaging as tools to determine the emulsifying characteristics of quince seed powder in emulsions and hydrogels [published online ahead of print 20200812]. Int J Biol Macromol. 2020;164:2051-2061
2020
-
[44]
Reproducible phantom for quality assurance in abdominal MRI focussing kidney imaging
Wolf M, Kommer S, Fembek S, et al. Reproducible phantom for quality assurance in abdominal MRI focussing kidney imaging. Frontiers in Physics. 2022;10
2022
-
[45]
A straightforward procedure to build a non-toxic relaxometry phantom with desired T1 and T2 times at 3T [published online ahead of print 20240511]
Fritz V, Eisele S, Martirosian P, Machann J, Schick F. A straightforward procedure to build a non-toxic relaxometry phantom with desired T1 and T2 times at 3T [published online ahead of print 20240511]. MAGMA. 2024;37(5):899-907
2024
-
[46]
Wereszczynska B, Szczesniak K. MRI phantom for tissue simulation with respect to diffusion coefficient and kurtosis - Validation with injection of liposomal theranostics [published online ahead of print 20210617]. Magn Reson Imaging. 2021;82:18-23
2021
-
[47]
Tissue mimicking materials for imaging and therapy phantoms: a review [published online ahead of print 20201216]
McGarry CK, Grattan LJ, Ivory AM, et al. Tissue mimicking materials for imaging and therapy phantoms: a review [published online ahead of print 20201216]. Phys Med Biol. 2020;65(23)
2020
-
[48]
Transparent hydrogel with enhanced water retention capacity by introducing highly hydratable salt
Bai YY, Chen BH, Xiang F, Zhou JX, Wang H, Suo ZG. Transparent hydrogel with enhanced water retention capacity by introducing highly hydratable salt. Applied Physics Letters. 2014;105(15)
2014
-
[49]
Flip angle errors in actual flip angle imaging using polyvinylpyrrolidone/water-based phantoms [published online ahead of print 20251018]
Himburg N, Lutz M, Mitschang L, Frintz JG, Schmitter S. Flip angle errors in actual flip angle imaging using polyvinylpyrrolidone/water-based phantoms [published online ahead of print 20251018]. Magn Reson Med. 2026;95(3):1489-1502
2026
-
[50]
A better understanding of the properties of alginate solutions and gels by quantitative magnetic resonance imaging (MRI)
Degrassi A, Toffanin R, Paoletti S, Hall LD. A better understanding of the properties of alginate solutions and gels by quantitative magnetic resonance imaging (MRI). Carbohydr Res. 1998;306(1- 2):19-26
1998
Reviewed August 12, 2026 · model on record in the stance chip above.
Discussion (0). Continue with ORCID to comment.