REVIEW 4 major objections 3 minor 30 references
Topological universality of on-demand ride-sharing efficiency
T0 review · 4 major / 3 minor · reviewed 2026-08-14 · deepseek-v4-flash
Pith's one-line read Ride-sharing efficiency across street networks collapses onto one universal curve set by two parameters.
desk verdict Useful scaling result with a clean mean-field core, but the dispatcher-universality claim is overbroad and the finite-x collapse needs error bars. read the letter →
The pith
A machine-rendered reading of the paper's core claim, the machinery that carries it, and where it could break.
The reading
What carries the argument
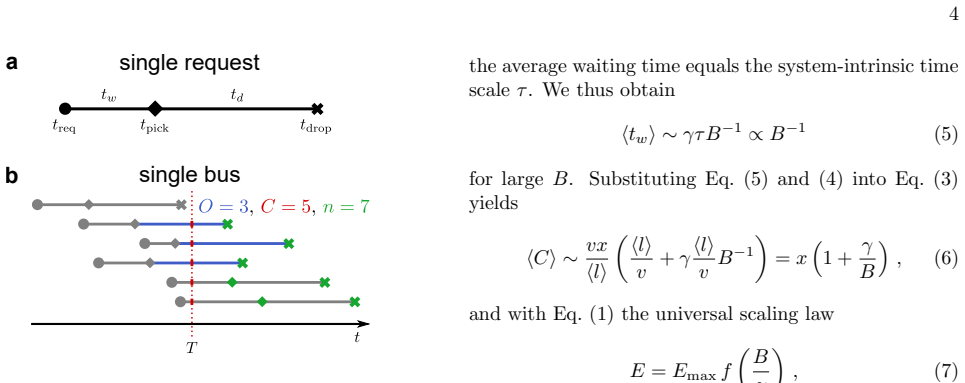
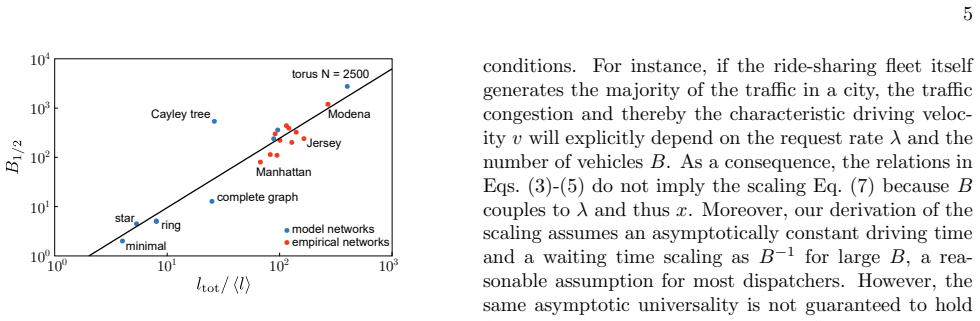
The central object is the efficiency $E$, built from the average number of scheduled customers per bus $\langle C\rangle$ and the normalized load $x$. The identity that carries the argument is $\langle C\rangle=\frac{vx}{\langle l\rangle}(\langle t_d\rangle+\langle t_w\rangle)$, which ties efficiency directly to the average driving time $\langle t_d\rangle$ and waiting time $\langle t_w\rangle$. In the perfect-service limit the assumptions $\langle t_d\rangle\sim \langle l\rangle/v\propto B^0$ and $\langle t_w\rangle\sim \gamma(\langle l\rangle/v)B^{-1}\propto B^{-1}$ convert this identity into $\langle C\rangle\sim x(1+\gamma/B)$, giving $E=E_{\max}/(1+B_{1/2}/B)$ with $B_{1/2}=\gamma$. A secondary object is the topological distinctness ratio $\ell=l_{\mathrm{tot}}/\langle l\rangle$, which quantifies how strongly shortest paths overlap and is shown to control the size of $B_{1/2}$.
What would settle it
Fix a network and request distribution, hold the normalized load $x$ constant, and measure the mean pickup waiting time $\langle t_w\rangle$ and the efficiency $E$ over a wide range of fleet sizes $B$. If $\langle t_w\rangle$ scales as $B^{-\alpha}$ with $\alpha\neq 1$, or if the residuals from fitting $E=E_{\max}B/(B+B_{1/2})$ grow systematically with $B$, the claimed universal collapse fails.
Extended reading notes
Core claim
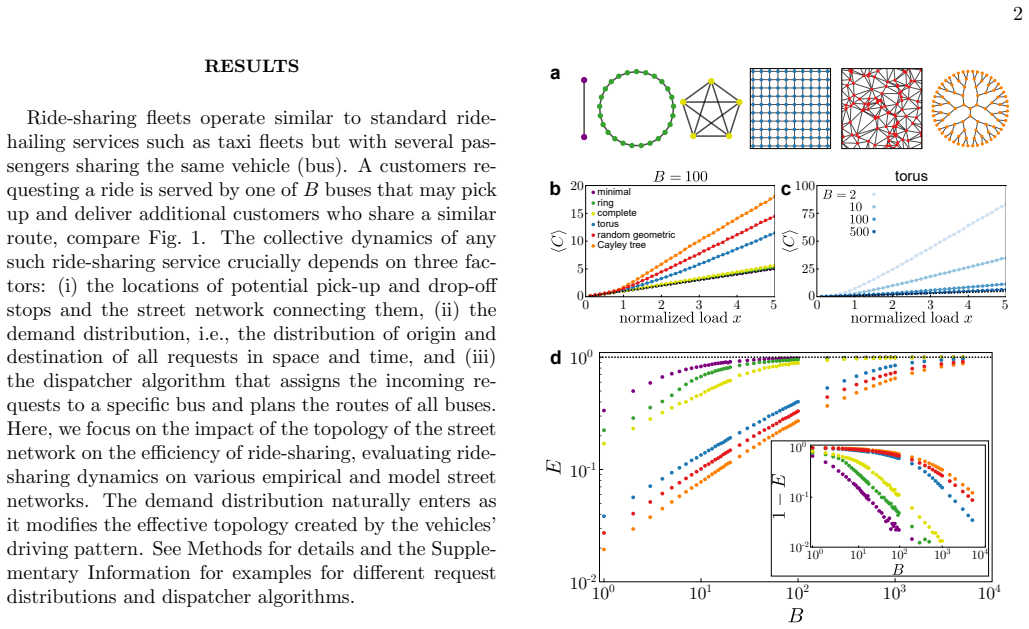
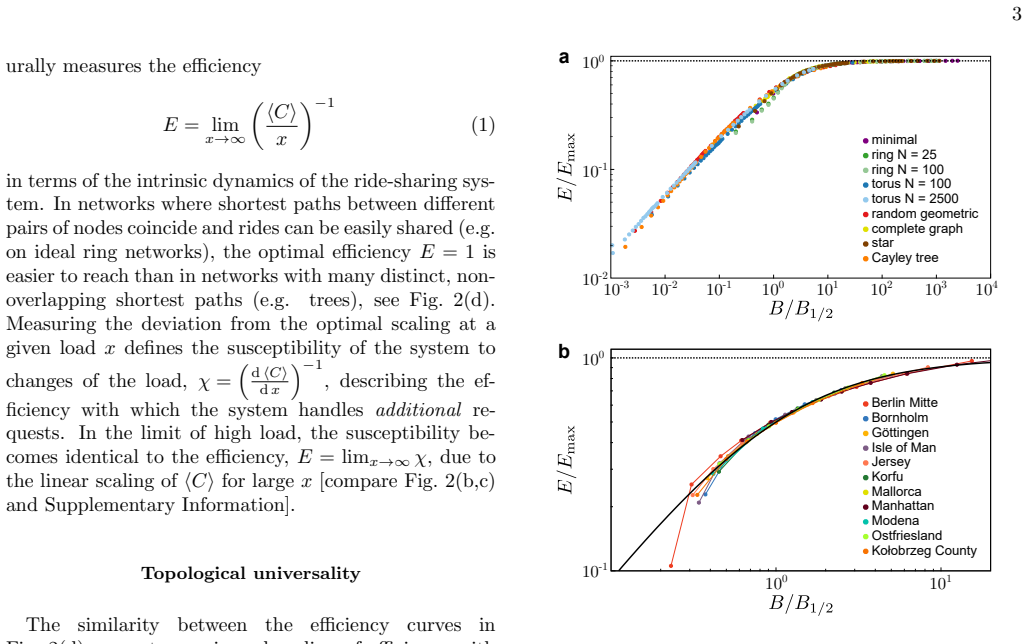
The central claim is that on-demand ride-sharing efficiency obeys a universal scaling law. Defining efficiency as $E=\lim_{x\to\infty}(\langle C\rangle/x)^{-1}$, where $\langle C\rangle$ is the average number of scheduled customers per bus and $x=\langle l\rangle \lambda/(vB)$ is the normalized request rate, the paper reports by extensive simulation that all efficiency curves collapse to $E=E_{\max} f(B/B_{1/2})$, with a universal function $f(z)=1/(1+z^{-1})$ in the large-$z$ limit. $B_{1/2}$ is the fleet size at which the system reaches half of its maximum efficiency $E_{\max}$; it absorbs the effect of the network topology and the request distribution, while $E_{\max}$ is essentially set by the dispatching algorithm. The collapse is demonstrated on model networks spanning a minimal graph, rings, complete graphs, toroidal lattices, random geometric networks, a Cayley tree, and a star, and on empirical street networks from cities, islands, and rural areas.
Load-bearing premise
The load-bearing premise is that, for a large fleet, doubling the number of buses halves the average waiting time for a pickup; if a dispatcher or network produces a different waiting-time scaling, the universal efficiency curve changes.
Editorial extensions
If this is right
- Each street network is summarized by two parameters, $E_{\max}$ and $B_{1/2}$, so its entire efficiency curve $E=E_{\max}B/(B+B_{1/2})$ can be drawn without measuring every load level.
- The half-efficiency fleet size $B_{1/2}$ grows with the distinctness of shortest paths, meaning a planner can use network geometry alone to estimate how many buses a new region will need.
- Changing the request distribution only reshapes the scaling factor through the average trip length and effective topology; it does not change the functional form of the efficiency curve.
- A dispatcher algorithm sets $E_{\max}$ and can change $B_{1/2}$, but as long as waiting time decays as $B^{-1}$ for large fleets, the universal large-fleet form of the curve persists.
Reading between the lines
- Editorial inference: if the collapse holds, fleet sizing becomes a two-measurement problem: estimate $E_{\max}$ and $B_{1/2}$ from a short pilot run in a new region, then read the whole efficiency curve off the universal function.
- Editorial inference: the topological interpretation of $B_{1/2}$ could be sharpened by testing whether other graph metrics, such as path-overlap entropy or betweenness concentration, predict $B_{1/2}$ better than $\ell=l_{\mathrm{tot}}/\langle l\rangle$ on a wider set of empirical networks.
- Editorial inference: the microscopic prediction hidden in the derivation is that pickup waiting time in a real fleet should halve when fleet size doubles; a field experiment varying only $B$ under fixed demand would test this independently of the efficiency collapse.
- Editorial inference: if request distributions only renormalize $B_{1/2}$, then time-varying demand could be represented by a time-dependent $B_{1/2}(t)$ on the same universal curve, which would let operators track rush-hour efficiency with a single number.
Signed reviews
Editorial analysis
A structured set of objections, weighed in public.
Referee Report
Summary. The paper introduces an efficiency measure E = lim_{x→∞} (⟨C⟩/x)^{-1} for ride-sharing fleets, where ⟨C⟩ is the mean number of scheduled customers per bus and x the normalized request rate. Using a Little's-law-type identity in Eq. (3), the authors connect ⟨C⟩ to mean waiting and driving times, and from the asymptotic assumptions ⟨td⟩ ∝ B^0 and ⟨tw⟩ ∝ B^{-1} they derive the scaling law E = Emax f(B/B1/2) with f(z)=1/(1+z^{-1}). They report that this law collapses simulation data across model topologies and empirical street networks, that B1/2 is controlled by the distinctness of shortest paths, and that the law is insensitive to request distributions and dispatching criteria. The paper concludes by acknowledging that the universality is conditional on the assumed waiting-time scaling and on the absence of fleet-generated congestion.
Significance. If the central scaling law Eq. (2) holds as stated, the paper would supply a practical two-parameter characterization of ride-sharing efficiency across cities and rural areas, with a clean Little's-law foundation in Eq. (3) and a plausible topological interpretation for B1/2. The authors deserve credit for testing a wide range of model and empirical street networks, for explicitly measuring the asymptotic drive-time and waiting-time scalings in Fig. S1, and for honestly acknowledging the limits of the universality claim in the conclusion. However, the strength of the reported universality is currently limited by the fact that the functional form is derived from an assumed B^{-1} waiting-time scaling, the collapse is obtained after per-network fitting of B1/2 and Emax, and the cross-dispatcher universality is contradicted by the paper's own supplementary material. These issues are correctable and do not invalidate the core identity, but they do require a revised and more guarded statement of the claim.
major comments (4)
- [Scaling of ride-sharing efficiency] The universal functional form f(z)=1/(1+z^{-1}) in Eq. (7) is derived entirely from the assumed asymptotic scaling ⟨tw⟩ ∼ γτ B^{-1} in Eq. (5) together with the constant drive-time scaling in Eq. (4). The drive-time scaling is well supported by Fig. S1(a), but the waiting-time scaling is introduced heuristically and not derived from the dispatcher dynamics. Because the proportionality constant γ is then identified with the fitted half-efficiency fleet size B1/2, the collapse in Fig. 3(a,b) is a two-parameter fit per network to a curve whose shape is fixed by the assumed B^{-1} law; it does not independently test the universal shape. I recommend directly fitting the exponent of ⟨tw⟩(B) from the simulation data, reporting residuals of the collapse, and demonstrating that a different plausible scaling (e.g., B^{-1/2}) leads to a different f before claiming parameter-free universality.
- [Topological universality] The abstract and the section 'Topological universality' state that the scaling is 'insensitive to ... dispatching criteria,' but Supplement Fig. S4 states that different dispatcher algorithms follow different universal functions f(·), and the conclusion concedes that the same asymptotic universality 'is not guaranteed to hold for hypothetical dispatchers with a different scaling.' These statements are in tension. The universality claim should be restricted to the class of dispatchers for which the asymptotic drive time is constant and the waiting time scales as B^{-1}; otherwise the central claim is overstated.
- [Distinctness of shortest paths controls scaling factor] Figure 5 presents the relation B1/2 vs. ltot/⟨l⟩ as showing a 'strong dependence,' but the line is only a guide to the eye; no regression statistics, error bars on the fit, or residuals are given. The ratio ltot/⟨l⟩ is an ad-hoc measure that may conflate network size and topology, so without a quantitative model this secondary claim is not established. If this relation is intended as a predictive formula for B1/2, it needs a regression with confidence bounds and out-of-sample validation.
- [Efficiency of ride-sharing] The empirical collapse in Fig. 3(b) is computed at x=2.5 and the model collapse in Fig. 3(a) at x=7.5, while E is defined in Eq. (1) as the x→∞ limit of (⟨C⟩/x)^{-1}. The universal curve in Eq. (7) is an asymptotic result for large B and large x; using E measured at a finite, and network-dependent, load makes the collapse a statement about finite-load efficiency, not about the asymptotic law. Please demonstrate that E(B) is insensitive to x in the range used, or fit E at a common, sufficiently large x for all networks, and report how the fitted B1/2 and Emax depend on x.
minor comments (3)
- [Supplementary Material] Equation (S1) appears to contain an extra factor of 2 in the expression for ⟨C⟩ compared with Eq. (3) of the main text; please verify that this is a typographical error.
- [Supplementary Material] The caption of Fig. S4 says that different dispatchers 'follow different universal functions f(·)' while the main text claims a single universal f; this wording is confusing and should be reconciled.
- [References] Reference [1] contains a spelling error ('Sustainbale' instead of 'Sustainable').
Circularity Check
Empirical collapse is a per-network two-parameter fit; the universal shape is inherited from an assumed B^{-1} waiting-time scaling, so the universality claim is only partially independent.
-
fitted input called prediction
[Supplemental Material, 'Topological factors of empirical street networks' (Table S2); main text Eq. (2) and Fig. 3(b)]
"The factors were determined by fitting the universal curve E = Emax B/(B+B1/2) to the simulation results."
For the empirical street networks in Fig. 3(b), the collapse is produced with B1/2 and Emax obtained by least-squares fitting each network's own simulation data to the universal curve E = Emax B/(B+B1/2). The transformed points lie on f(.) because the two parameters of f(.) were chosen per network to make them do so. The paper's claimed prediction E(B) = Emax f(B/B1/2) for a real network therefore requires a simulation of that network to determine B1/2; it is a parameterization, not an independent test. Independent content exists only for the symmetric model networks (Table S3), where B1/2 is computed from the wait-time calculation and compared with the fit.
full rationale
The derivation chain is self-contained and not built on self-citation. Eq. (7), f(z)=1/(1+z^{-1}), follows algebraically from the stated asymptotic assumptions (4)-(5); Eq. (5) is an explicit ansatz ('twice as many buses means a bus going in the right direction comes by twice as often') and the paper's conclusion concedes that universality is not guaranteed for dispatchers with a different waiting-time scaling. This is a limitation rather than a full circularity, and Fig. S1 directly tests the B^{-1} law, providing independent support. The main genuinely circular element is the empirical portion: the data collapse in Fig. 3(b) is realized with per-network B1/2 and Emax fitted from the very same efficiency data (Table S2), so the empirical 'universality' is partly a quality-of-fit statement rather than a prediction. The definition of B1/2 as the half-efficiency fleet size is a standard rescaling convention and by itself does not force collapse, so it is not counted as a separate circular step. Additionally, the paper overstates dispatcher independence: the supplement (Fig. S3/S4) shows different dispatchers give different universal curves, and the conclusion restricts the claim to dispatchers with B^{-1} waiting-time scaling. These overclaims are correctness risks, but the analytical mean-field B1/2 predictions for model networks give the central idea nontrivial, partially independent content, so a score of 6 rather than 8 or 10 is appropriate.
Assumptions & free parameters
free parameters (4)
- B1/2 (half-efficiency fleet size) =
e.g., 325±40 (Berlin), 80±6 (Manhattan), 2 (minimal graph theory vs 2.03 fit)
- Emax (maximum efficiency) =
0.67-0.82 for empirical networks; 1 for model networks with dispatcher A
- γ (waiting-time proportionality) =
identified with B1/2
- δ (detour delay fraction) =
0.1
assumptions (5)
- domain assumption The system reaches a steady state so Little's law applies, ⟨C⟩ = (λ/B) ⟨ts⟩.
- domain assumption Waiting time scales as ⟨tw⟩ ~ γτ B^{-1} for large B.
- domain assumption Driving time approaches ⟨l⟩/v (no detours) in the perfect service limit.
- domain assumption Requests form a Poisson process with constant rate λ.
- domain assumption Buses have infinite passenger capacity.
Cite this review
Pith. "Pith review of Topological universality of on-demand ride-sharing efficiency." pith.science (2026). https://pith.science/paper/RFGAN4VD
@misc{pith2026190805929,
  author       = {Pith},
  title        = {Pith review of: Topological universality of on-demand ride-sharing efficiency},
  year         = {2026},
  howpublished = {\url{https://pith.science/paper/RFGAN4VD}},
  note         = {Machine review of arXiv:1908.05929}
}
read the original abstract
Ride-sharing may substantially contribute to future-compliant sustainable mobility, both in urban and rural areas. The service quality of ride-sharing fleets jointly depends on the topology of the underlying street networks, the spatio-temporal demand distributions, and the dispatching algorithms. Yet, efficiency of ride-sharing services is typically quantified by economic or ecological ad-hoc measures that do not transfer to new service regions with different characteristics. Here we derive a generic measure of ride-sharing efficiency based on the intrinsic ride-sharing dynamics that follows a universal scaling law across network topologies. We demonstrate that the same scaling holds across street networks of distinct topologies, including cities, islands and rural areas, and is insensitive to modifying request distributions and dispatching criteria. These results further our understanding of the collective dynamics of ride-sharing fleets and may enable quantitative evaluation of conditions towards increasing the feasibility of creating or transferring ride-sharing services to previously unserviced regions.
Figures

Figures from the paper (2 more)
Reference graph
Works this paper leans on
-
[1]
safe, affordable, accessible and sustainable transport systems for all
United Nations. Sustainable development goals, 2015. Goal 11: Sustainbale cities and communities - Tar- get 11.2: “...safe, affordable, accessible and sustainable transport systems for all...”
work page 2015
-
[2]
Value of travel time reliability: A review of current evidence
Carlos Carrion and David Levinson. Value of travel time reliability: A review of current evidence. Transportation Research Part A: Policy and Practice , 46(4):720 – 741, 2012. 7
work page 2012
-
[3]
James, Maxime Lenormand, Thomas Louail, Ronaldo Menezes, Jos´ e J
Hugo Barbosa, Marc Barthelemy, Gourab Ghoshal, Charlotte R. James, Maxime Lenormand, Thomas Louail, Ronaldo Menezes, Jos´ e J. Ramasco, Filippo Si- mini, and Marcello Tomasini. Human mobility: Models and applications. Physics Reports, 734:1 – 74, 2018. Hu- man mobility: Models and applications
work page 2018
-
[4]
Rethinking mobil- ity for a human city
Cathy Macharis and Imre Keseru. Rethinking mobil- ity for a human city. Transport Reviews, 38(3):275–278, 2018
work page 2018
-
[5]
World urbanization prospects: The 2014 revision, 2015
United Nations, Department of Economic and Social Af- fairs. World urbanization prospects: The 2014 revision, 2015
work page 2014
-
[6]
World urbanization prospects: The 2018 revision - key facts, 2018
United Nations, Department of Economic and Social Af- fairs. World urbanization prospects: The 2018 revision - key facts, 2018
work page 2018
-
[7]
McDonnell and Ian MacGregor-Fors
Mark J. McDonnell and Ian MacGregor-Fors. The eco- logical future of cities. Science, 352(6288):936–938, 2016
work page 2016
-
[8]
Anu Ramaswami, Armistead G. Russell, Patricia J. Culli- gan, Karnamadakala Rahul Sharma, and Emani Kumar. Meta-principles for developing smart, sustainable, and healthy cities. Science, 352(6288):940–943, 2016
work page 2016
Show all 30 references
-
[9]
Robert J. Sampson. Urban sustainability in an age of enduring inequalities: Advancing theory and ecometrics for the 21st-century city. Proceedings of the National Academy of Sciences, 114(34):8957–8962, 2017
2017
-
[10]
You are what you can access: Sharing and collaborative consumption online
Russell Belk. You are what you can access: Sharing and collaborative consumption online. Journal of business research, 67(8):1595–1600, 2014
2014
-
[11]
Ride on! mobility business models for the sharing economy
Boyd Cohen and Jan Kietzmann. Ride on! mobility business models for the sharing economy. Organization & Environment, 27(3):279–296, 2014
2014
-
[12]
Greenblatt and Susan Shaheen
Jeffery B. Greenblatt and Susan Shaheen. Automated ve- hicles, on-demand mobility, and environmental impacts. Current Sustainable/Renewable Energy Reports, 2(3):74– 81, Sep 2015
2015
-
[13]
A critical review of new mobility services for urban transport
Maria Kamargianni, Weibo Li, Melinda Matyas, and An- dreas Schafer. A critical review of new mobility services for urban transport. Transportation Research Procedia, 14:3294–3303, 2016
2016
-
[14]
Moia launches europe’s largest electric ridesharing service in hamburg, 2019
Volkswagen MOIA. Moia launches europe’s largest electric ridesharing service in hamburg, 2019. https: //www.moia.io/en/press/MOIA-launches-Europe-s- largest-electric-ridesharing-service-in-Hamburg , accessed 07/04/19
2019
-
[15]
Uberpool gets more than 1 million cus- tomers
Zlata Rodionova. Uberpool gets more than 1 million cus- tomers. The Independent, Tuesday, 7 June, 2016
2016
-
[16]
Ridesharing: The state-of-the-art and fu- ture directions
Masabumi Furuhata, Maged Dessouky, Fernando Ord´ o˜ nez, Marc-Etienne Brunet, Xiaoqing Wang, and Sven Koenig. Ridesharing: The state-of-the-art and fu- ture directions. Transportation Research Part B: Method- ological, 57:28–46, 2013
2013
-
[17]
Mean field theory of demand re- sponsive ride pooling systems
Stephan Herminghaus. Mean field theory of demand re- sponsive ride pooling systems. Transportation Research Part A: Policy and Practice , 119:15–28, 2019
2019
-
[18]
Strogatz, and Carlo Ratti
Paolo Santi, Giovanni Resta, Michael Szell, Stanislav Sobolevsky, Steven H. Strogatz, and Carlo Ratti. Quan- tifying the benefits of vehicle pooling with shareability networks. Proceedings of the National Academy of Sci- ences, 111(37):13290–13294, 2014
2014
-
[19]
Towards a statistical physics of collec- tive mobility and demand-driven transport
Andreas Sorge. Towards a statistical physics of collec- tive mobility and demand-driven transport . PhD thesis, Georg-August-Universit¨ at G¨ ottingen, 2017
2017
-
[20]
On-demand high- capacity ride-sharing via dynamic trip-vehicle assign- ment
Javier Alonso-Mora, Samitha Samaranayake, Alex Wal- lar, Emilio Frazzoli, and Daniela Rus. On-demand high- capacity ride-sharing via dynamic trip-vehicle assign- ment. Proceedings of the National Academy of Sciences , 114(3):462–467, 2017
2017
-
[21]
Robotic load balancing for mobility-on- demand systems
Marco Pavone, Stephen L Smith, Emilio Frazzoli, and Daniela Rus. Robotic load balancing for mobility-on- demand systems. The International Journal of Robotics Research, 31(7):839–854, 2012
2012
-
[22]
Toward a Sys- tematic Approach to the Design and Evaluation of Au- tomated Mobility-on-Demand Systems: A Case Study in Singapore, pages 229–245
Kevin Spieser, Kyle Treleaven, Rick Zhang, Emilio Fraz- zoli, Daniel Morton, and Marco Pavone. Toward a Sys- tematic Approach to the Design and Evaluation of Au- tomated Mobility-on-Demand Systems: A Case Study in Singapore, pages 229–245. Springer International Pub- lishing, ...
2014
-
[23]
M. M. Vazifeh, P. Santi, G. Resta, S. H. Strogatz, and C. Ratti. Addressing the minimum fleet problem in on-demand urban mobility. Nature, 557(7706):534–538, 2018
2018
-
[24]
On the welfare optimal policies in demand responsive transportation and shared taxi services
Jani-Pekka Jokinen. On the welfare optimal policies in demand responsive transportation and shared taxi services. Journal of Transport Economics and Policy (JTEP), 50(1):39–55, 2016
2016
-
[25]
Estimating the environmental benefits of ride-sharing: A case study of dublin
Brian Caulfield. Estimating the environmental benefits of ride-sharing: A case study of dublin. Transportation Research Part D: Transport and Environment, 14(7):527– 531, 2009
2009
-
[26]
Car- sharing demand estimation: Zurich, switzerland, area case study
Milos Bala´ c, Francesco Ciari, and Kay W Axhausen. Car- sharing demand estimation: Zurich, switzerland, area case study. Transportation Research Record, 2536:10–18, 2015
2015
-
[27]
Wright, F
S. Wright, F. Cellina, M. Bulgheroni, F. Cartolano, L. Lucietti, P. van Egmond, and L. van Wijngaarden. Public acceptance of socialcar, a new mobility platform integrating public transport and car-pooling services: in- sights from a survey in five european cities. In Proceed- i...
2018
-
[28]
Scal- ing law of urban ride sharing
Remi Tachet, Oleguer Sagarra, Paolo Santi, Giovanni Resta, Michael Szell, SH Strogatz, and Carlo Ratti. Scal- ing law of urban ride sharing. Scientific reports, 7:42868, 2017
2017
-
[29]
Modeling an enhanced ridesharing system with meet points and time windows
Xin Li, Sangen Hu, Wenbo Fan, and Kai Deng. Modeling an enhanced ridesharing system with meet points and time windows. PloS one, 13(5):e0195927, 2018
2018
-
[30]
Osmnx: New methods for acquiring, con- structing, analyzing, and visualizing complex street net- works
Geoff Boeing. Osmnx: New methods for acquiring, con- structing, analyzing, and visualizing complex street net- works. Computers, Environment and Urban Systems , 65:126–139, 2017. ACKNOWLEDGEMENTS We thank Debsankha Manik, Nils Beyer, Stephan Herminghaus, Jani-Pekka Jokinen, Ver...
2017
Reviewed August 14, 2026 · model on record in the stance chip above.
Discussion (0). Continue with ORCID to comment.