REVIEW 3 major objections 5 minor 2 cited by
The THESAN project: tracking the expansion and merger histories of ionized bubbles during the Epoch of Reionization
T0 review · 3 major / 5 minor · reviewed 2026-08-12 · deepseek-v4-flash
Pith's one-line read A single ionized bubble emerges by z≈9–10, well before reionization's midpoint, and grows to dominate the entire simulated volume.
desk verdict A genuinely new bubble merger tree with a real soft spot: the headline ~10 cMpc deficit and early main-bubble dominance are built into the freeze-on-merge rule, so the paper needs a watershed comparison. read the letter →
The pith
A machine-rendered reading of the paper's core claim, the machinery that carries it, and where it could break.
The reading
What carries the argument
The central object is the bubble tree algorithm, a chronological watershed-like segmentation of the reionization-redshift field. Local maxima in z_reion seed bubble groups; each group grows by taking the neighbouring cell with the highest z_reion value; and when two groups claim the same cell, the largest group by volume becomes the parent and all smaller groups stop growing independently and are recorded as merged. This asymmetric merge rule is what produces a tree rather than a static partition, and it is the mechanism from which the three growth stages, the early emergence of the main bubble, and the ~10 cMpc deficit all follow.
What would settle it
Re-run the segmentation with a symmetric watershed rule in which both bubbles keep growing after first contact, and check whether the largest bubble still emerges by z ≈ 9–10 and whether the ~10 cMpc deficit still appears in the final size distribution; if either feature vanishes, it is a product of the tree's merge rule rather than of reionization. A complementary check is to measure directly, from time-sliced ionization snapshots, the fraction of ionized volume contained in the largest connected region at each redshift.
Extended reading notes
Core claim
The paper claims that the spatially resolved reionization redshift, defined as the last time a cell's ionized hydrogen fraction crosses 0.5, carries enough chronological information to reconstruct how individual ionized bubbles grow and merge. The bubble tree built on this field yields a 'natural ionization history': local maxima of z_reion seed bubbles that expand into the neighbouring cell with the highest z_reion, with mergers resolved by absorbing smaller groups into the largest group. Using this tree on THESAN, the authors find three growth stages and show that a single largest bubble emerges by z ≈ 9–10, well before the global midpoint of reionization; it dominates the merging phase, becomes the only significant growing region during the final expansion, and eventually fills the whole box. They additionally find that the final segmented bubble size distribution is underrepresented at R_eff ≈ 10 cMpc, because the main bubble's main merging event absorbs all other large groups before they can grow through that size, while the main bubble itself passes through that range too quickly for many cells to be assigned to it.
Load-bearing premise
The load-bearing premise is the asymmetric merge rule: when two growing ionized regions touch, the larger one absorbs the smaller one and the smaller one freezes and never expands again, and the paper's headline results would change or disappear if real bubbles instead continue to expand after contact.
Editorial extensions
If this is right
- If a single largest bubble is established by z ≈ 9–10, then the observable later stages of reionization, including 21-cm maps and the ionized-volume fraction around x_HI ~ 0.9, are dominated by the expansion of one percolating region rather than by many competing bubbles.
- The sharp deficit at R_eff ≈ 10 cMpc is a characteristic scale in the bubble size distribution that can serve as a diagnostic of the main merging event in reionization simulations.
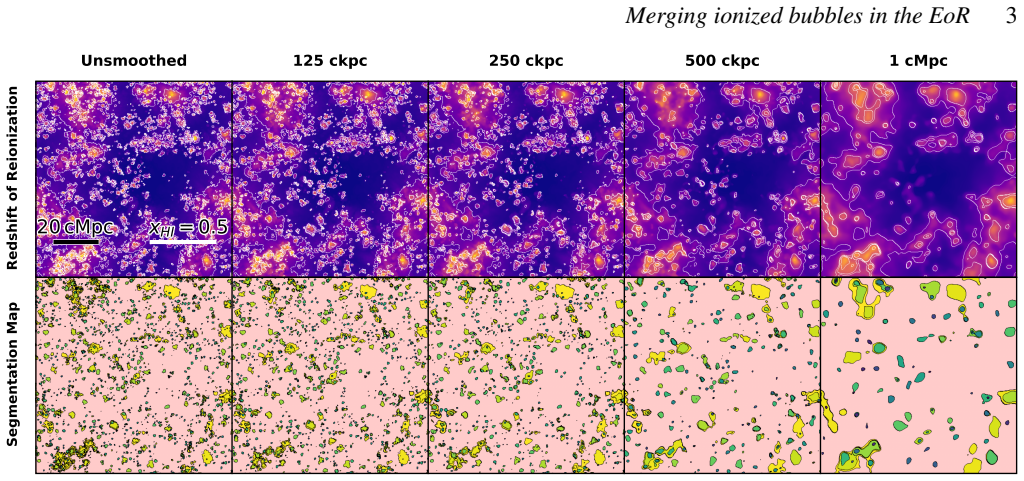
- Smoothing at 125 ckpc changes the timing of the growth stages but not the qualitative picture, so the three-stage sequence is robust at that resolution; only very large smoothing near 1 cMpc materially alters the early bubble-growth timing.
- Because the main bubble is already established by the time reionization is 10 per cent complete across the physics-variation runs once histories are matched, the emergence of a dominant bubble is a common feature rather than a peculiarity of the fiducial model.
Reading between the lines
- Editorial extension: Because the bubble tree records the volume, centre-of-mass, and moment-of-inertia tensor at each merger, it can be used to test whether the main bubble is seeded in an unusually overdense region or simply wins a random race among comparable early bubbles; the paper does not address this classification.
- Editorial extension: The predicted ~10 cMpc gap should be visible to forthcoming 21-cm experiments as a scale-dependent feature in the power spectrum or in reconstructed bubble-size statistics near x_HI ≈ 0.9; computing those observational forecasts is a natural next step not taken in the paper.
- Editorial extension: The same z_reion-based tree could be applied to fast semi-numeric reionization models to map how the main-bubble emergence redshift depends on source efficiency, escape fraction, and minimum halo mass, turning the z ≈ 9–10 result into a model-discriminating statistic.
Editorial analysis
A structured set of objections, weighed in public.
Referee Report
Summary. This paper introduces a 'bubble tree' algorithm that operates on the spatially resolved reionization-redshift field (z_reion) of the THESAN radiation-hydrodynamic simulations. The algorithm identifies local maxima in z_reion as bubble seeds, expands groups into neighboring cells in descending z_reion order, and records merger events in which the largest group by volume absorbs smaller groups, which then stop expanding independently. Applying this tree to the z_reion field, the authors partition the simulation volume into a 'natural ionization history' and identify three growth stages: isolated expansion (z ≳ 11), a merging/percolation phase (z ≈ 9-11), and a final phase dominated by a single large bubble (z ≲ 9). The central claims are that the largest bubble emerges by z ≈ 9-10 and comes to dominate the box well before the midpoint of reionization, and that the final segmented bubble size distribution shows a sharp deficit or characteristic scale near R_eff ≈ 10 cMpc because the main bubble absorbs all intermediate-sized groups. The paper also studies the dependence of these results on smoothing scale, grid resolution, neighbor definition, and the different physics variants in the THESAN suite.
Significance. If the central claims hold, the paper offers a new chronological framework for EoR bubble growth that is analogous to dark-matter merger trees and could be useful for interpreting 21-cm observations. The manuscript has clear strengths: the algorithm is described precisely enough to be reimplemented; the analysis code is publicly released; the resolution, neighbor-choice, and smoothing tests (Appendices A and B) are appropriate; and no physical parameters are fitted, with THESAN serving as an independent input. The three-stage picture and the 10 cMpc deficit are, however, generated by a central algorithmic choice -- the asymmetric freeze-on-merge rule in Sec. 2.3 -- and the paper does not demonstrate that these features survive in an alternative, non-freezing segmentation. Because the abstract and conclusions present the dominant bubble and the ~10 cMpc deficit as physical properties of reionization, the significance of the work stands or falls on whether those features are robust to the segmentation choice.
major comments (3)
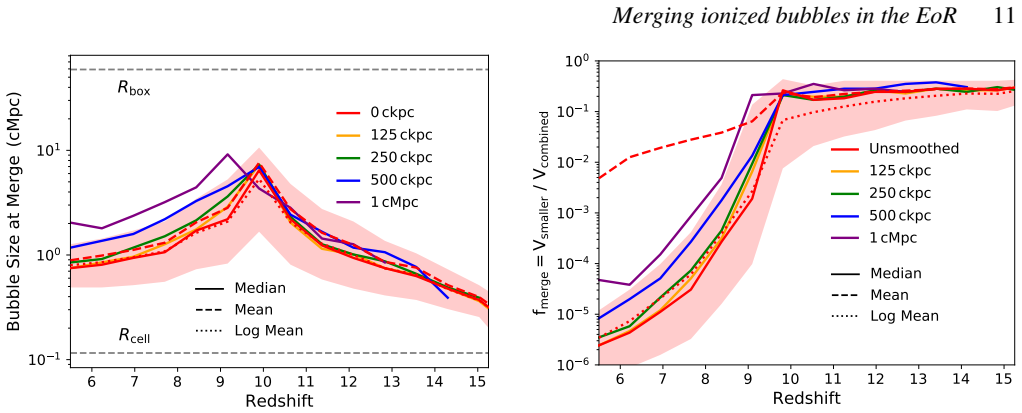
- [Sec. 2.3 ('Expansion and Merging'); Sec. 5 items (i)-(iii)] The freeze-on-merge rule is load-bearing for all three headline results, not a neutral bookkeeping choice. Because a group that merges into a larger one 'no longer expand[s] independently,' the merging-rate peak in Fig. 6, the convergence of the effective number of bubbles to one in Fig. 8, the early dominance of the main bubble in Fig. 9, and the disappearance of ~10 cMpc bubbles in Figs. 10 and 14 all directly reflect the tree rule. The manuscript explicitly contrasts this rule with watershed segmentation (where 'regions continue to grow even after merging') but never computes a watershed or any instantaneous, non-freezing bubble finder on the same z_reion field. I request a concrete comparison: run a watershed segmentation on the same z_reion field, or compute instantaneous bubble-size statistics (e.g., FOF or spherical-average on the x_HII fields at fixed redshifts z ~ 8-9), and show whether a dominant largest region and the ~10 cMpc deficit survive in that representation. Without such a check, the central claims are statements about the tree construction rather than established properties of reionization.
- [Sec. 3.2.2, Fig. 14] The sharp cutoff of the R_eff(z_merge) curve near 10 cMpc and the spike at R_box are partly built into the data products. The main bubble never merges, so 'there is essentially only one bubble past that range' is true by construction of the tree. In addition, the spike at the high-radius end is inflated by the rule in Sec. 2.3 that all cells still neutral at z = 5.5 are assigned to the final group 'as if they were ionized at the final redshift.' The abstract's statement that the deficit 'indicates a characteristic scale' is therefore not yet established as a physical feature of the simulated reionization. A physical interpretation requires an algorithm-independent size measure at fixed redshift, together with a statement of how the final-redshift neutral-cell assignment affects the high-radius peak.
- [Sec. 3.1.3, Fig. 9] The 'emergence' of the main bubble at z ≈ 9-10 is defined inside the tree by the parent-selection rule, under which the largest group by volume becomes the parent and all secondaries freeze. The paper itself notes that at z ≳ 11 'there are several bubbles of relatively equal size that compete to emerge as the one that happens to be the largest,' which indicates that the early-time identity of the main bubble is not driven by a physically distinct object. Since the volumes used in the parent selection are produced by the algorithm's expansion ordering, the claim that the largest bubble 'emerges well before the midpoint of reionization' needs to be demonstrated in an instantaneous or watershed segmentation before it can be presented as a finding about reionization rather than about the tree.
minor comments (5)
- [Abstract vs. Sec. 3.1.3 and Fig. 9] The redshift at which the largest bubble establishes dominance is quoted inconsistently: the abstract and Sec. 5 say z ≈ 9-10, while Sec. 3.1.3 says f_main increases rapidly 'by z ≈ 10-11' and the Fig. 9 caption says the main bubble 'becomes the main bubble at z ~ 10.5.' Please harmonize these numbers.
- [Fig. 6] The legend label 'GlobalGlobal' in the top panel appears to be a typo for 'Global'; the duplicated word should be removed.
- [Sec. 3.2, Fig. 15 discussion] The sentence 'smaller bubbles do have the opportunity to get large enough to get a centre of volume displacement as large as shown in the figure' appears to be missing a negative; as written it contradicts the preceding sentence that only larger bubbles achieve large displacements.
- [Eq. (2)] The triaxiality formula is typeset in a confusing way; it should read T = (λ_3^2 - λ_2^2)/(λ_3^2 - λ_1^2), and the current rendering makes the squared eigenvalues unclear.
- [References] The reference 'Einasto, J. Suhhonenko, I. Liivamägi, L. J. Einasto, M. 2018' does not follow the journal's author citation style and should be formatted as 'Einasto J., Suhhonenko I., Liivamägi L. J., Einasto M., 2018.'
Circularity Check
The R_eff≈10 cMpc deficit and main-bubble dominance follow from the tree's freeze-on-merge rule, making the central 'characteristic scale' claim partly definitional.
-
self definitional
[Sec. 2.3 (Expansion and Merging) and Sec. 3.2.2 (Final Size Distribution); summarized in Sec. 5 item (iii)]
"In contrast, our algorithm constructs a series of merging bubble groups. Once a bubble merges with a larger one, it stops growing independently. ... This, in effect, allows the largest bubble to quickly grow through these sizes while also preventing other bubble groups from expanding to this size, producing a dip in the PDF."
The claimed sharp deficit at R_eff≈10 cMpc is a direct consequence of the algorithm's rule that a smaller group 'stops growing independently' upon merging. The final size distribution is built from expansion and merger events, so once a group is frozen at its z_merge it cannot, by construction, contribute expansion events at larger radii; meanwhile the parent bubble's volume jumps discontinuously through mergers, skipping intermediate sizes. The explanation given for the deficit—'preventing other bubble groups from expanding to this size'—restates the freeze rule as a discovery rather than as a design choice.
full rationale
THESAN is an external, independently developed simulation suite, and no physical parameters are fitted in this analysis; the bubble-tree code is publicly released, and many analyses (global growth rates, physics-variation comparisons, triaxiality) are self-contained descriptions of that simulation. However, the headline 'characteristic scale' deficit in Sec. 3.2.2 and Sec. 5 item (iii) is not an independent measurement: the bubble-size distribution is constructed from expansion and merger events in a tree where a smaller group 'stops growing independently' upon merging. The paper's own explanation of the deficit, 'preventing other bubble groups from expanding to this size,' is exactly that freeze rule restated. The paper explicitly contrasts its method with the watershed method, where 'regions continue to grow even after merging,' but never computes such a symmetric segmentation on the same input field, so the frozen-size gap is a property of the chosen tree construction rather than a falsifiable reionization prediction. Similarly, the early dominance of the main bubble is measured on the same tree that defines parent identity by largest volume at each merger. Because central claim (iii) and part of claim (ii) reduce by construction, a moderate circularity score is warranted; the remaining simulation-based results give the paper independent value.
Assumptions & free parameters
free parameters (4)
- Reionization threshold x_HII =
0.5
- Smoothing scale (fiducial) =
125 ckpc (0, 125, 250, 500, 1000 ckpc explored)
- Grid resolution =
512^3 (128^3, 256^3, 1024^3 explored)
- Neighbor count =
26 (6 in Appendix B comparison)
assumptions (5)
- domain assumption The z_reion field, defined by the last upward crossing of x_HII = 0.5, is a valid spatiotemporal tracer of bubble growth, and local maxima in this field correspond to physical bubble seeds.
- ad hoc to paper The asymmetric merger rule (the largest group is always the parent; smaller groups freeze after merging) produces a physically meaningful representation of bubble histories.
- ad hoc to paper Cells that are still neutral at z=5.5 can be assigned to the final bubble as if they were ionized at the final redshift without biasing bubble statistics.
- domain assumption THESAN's radiation-hydrodynamics modeling (M1 closure, BPASS SEDs, non-equilibrium thermochemistry, IllustrisTNG galaxy formation) faithfully represents reionization.
- domain assumption Persistent z_reion-based histories constructed from the tree reproduce the true global ionization history closely enough for the growth-stage decomposition.
Cite this review
Pith. "Pith review of The THESAN project: tracking the expansion and merger histories of ionized bubbles during the Epoch of Reionization." pith.science (2026). https://pith.science/paper/RJ2UQZ57
@misc{pith2026241108943,
  author       = {Pith},
  title        = {Pith review of: The THESAN project: tracking the expansion and merger histories of ionized bubbles during the Epoch of Reionization},
  year         = {2026},
  howpublished = {\url{https://pith.science/paper/RJ2UQZ57}},
  note         = {Machine review of arXiv:2411.08943}
}
read the original abstract
The growth of ionized hydrogen bubbles in the intergalactic medium around early luminous objects is a fundamental process during the Epoch of Reionization (EoR). In this study, we analyze bubble sizes and their evolution using the state-of-the-art THESAN radiation-hydrodynamics simulation suite, which self-consistently models radiation transport and realistic galaxy formation throughout a large (95.5 cMpc)^3 volume of the Universe. Analogous to the accretion and merger tree histories employed in galaxy formation simulations, we characterize the growth and merger rates of ionized bubbles by focusing on the spatially-resolved redshift of reionization. By tracing the chronological expansion of bubbles, we partition the simulation volume and construct a natural ionization history. We identify three distinct stages of ionized bubble growth: (1) initial slow expansion around the earliest ionizing sources seeding formation sites, (2) accelerated growth through percolation as bubbles begin to merge, and (3) rapid expansion dominated by the largest bubble. Notably, we find that the largest bubble emerges by z=9-10, well before the midpoint of reionization. This bubble becomes dominant during the second growth stage, and defines the third stage by rapidly expanding to eventually encompass the remainder of the simulation volume and becoming one of the few bubbles actively growing. Additionally, we observe a sharp decline in the number of bubbles with radii around ~10 cMpc compared to smaller sizes, indicating a characteristic scale in the final segmented bubble size distribution. Overall, these chronologically sequenced spatial reconstructions offer crucial insights into the physical mechanisms driving ionized bubble growth during the EoR and provide a framework for interpreting the structure and evolution of reionization itself.
Figures


Figures from the paper (9 more)




Forward citations
Cited by 2 Pith papers
-
An Alcock-Paczynski Test on Reionization Bubbles for Cosmology
Stacks of reionization HII bubbles act as standard spheres, allowing a forecast ~2% measurement of D_A H at z=7.5 with SKA-like 21-cm data.
-
Stacked Hybrid RNN-CNN Reconstruction of X-ray Influence on 21-cm Brightness Temperature
A stacked LSTM-GRU-CNN emulator reportedly reconstructs the global 21-cm brightness temperature with 99.93% accuracy, but a residual feature derived from the target values makes the reported accuracy invalid.
Reference graph
Works this paper leans on
-
[1]
Barkana R., Loeb A., 2001, @doi [ ] 10.1016/S0370-1573(01)00019-9 , https://ui.adsabs.harvard.edu/abs/2001PhR...349..125B 349, 125
-
[2]
Barnes J., Hut P., 1986, @doi [ ] 10.1038/324446a0 , https://ui.adsabs.harvard.edu/abs/1986Natur.324..446B 324, 446
doi:10.1038/324446a0 1986
-
[3]
Borrow J., Kannan R., Garaldi E., Smith A., Vogelsberger M., Pakmor R., Springel V., Hernquist L., 2023, @doi [ ] 10.1093/mnras/stad2523 , https://ui.adsabs.harvard.edu/abs/2023MNRAS.525.5932B 525, 5932
-
[4]
Busch P., Eide M. B., Ciardi B., Kakiichi K., 2020, @doi [ ] 10.1093/mnras/staa2599 , https://ui.adsabs.harvard.edu/abs/2020MNRAS.498.4533B 498, 4533
-
[5]
DeBoer D. R., et al., 2017, @doi [ ] 10.1088/1538-3873/129/974/045001 , https://ui.adsabs.harvard.edu/abs/2017PASP..129d5001D 129, 045001
-
[6]
Dubroca B., Feugeas J., 1999, @doi [Academie des Sciences Paris Comptes Rendus Serie Sciences Mathematiques] 10.1016/S0764-4442(00)87499-6 , https://ui.adsabs.harvard.edu/abs/1999CRASM.329..915D 329, 915
-
[7]
Einasto, J. Suhhonenko, I. Liivamägi, L. J. Einasto, M. 2018, @doi [A&A] 10.1051/0004-6361/201833011 , 616, A141
-
[8]
Elbers W., van de Weygaert R., 2023, @doi [ ] 10.1093/mnras/stad120 , https://ui.adsabs.harvard.edu/abs/2023MNRAS.520.2709E 520, 2709
Show all 55 references
-
[9]
J., Stanway E
Eldridge J. J., Stanway E. R., Xiao L., McClelland L. A. S., Taylor G., Ng M., Greis S. M. L., Bray J. C., 2017, @doi [ ] 10.1017/pasa.2017.51 , https://ui.adsabs.harvard.edu/abs/2017PASA...34...58E 34, e058
2017 doi
-
[10]
M., Mellema G., Alvarez M
Friedrich M. M., Mellema G., Alvarez M. A., Shapiro P. R., Iliev I. T., 2011, @doi [ ] 10.1111/j.1365-2966.2011.18219.x , https://ui.adsabs.harvard.edu/abs/2011MNRAS.413.1353F 413, 1353
2011
-
[11]
R., Oh S
Furlanetto S. R., Oh S. P., 2016, @doi [ ] 10.1093/mnras/stw104 , https://ui.adsabs.harvard.edu/abs/2016MNRAS.457.1813F 457, 1813
2016 doi
-
[12]
R., Oh S
Furlanetto S. R., Oh S. P., Briggs F. H., 2006, @doi [ ] 10.1016/j.physrep.2006.08.002 , https://ui.adsabs.harvard.edu/abs/2006PhR...433..181F 433, 181
2006 doi
-
[13]
Garaldi E., Kannan R., Smith A., Springel V., Pakmor R., Vogelsberger M., Hernquist L., 2022, @doi [ ] 10.1093/mnras/stac257 , https://ui.adsabs.harvard.edu/abs/2022MNRAS.512.4909G 512, 4909
2022 doi
-
[14]
Garaldi E., et al., 2024, @doi [ ] 10.1093/mnras/stae839 , https://ui.adsabs.harvard.edu/abs/2024MNRAS.530.3765G 530, 3765
2024 doi
-
[15]
Giri S., Mellema G., Jensen H., 2020, @doi [The Journal of Open Source Software] 10.21105/joss.02363 , https://ui.adsabs.harvard.edu/abs/2020JOSS....5.2363G 5, 2363
2020 doi
-
[16]
Y., Madau P., 2022, @doi [Living Reviews in Computational Astrophysics] 10.1007/s41115-022-00015-5 , https://ui.adsabs.harvard.edu/abs/2022LRCA....8....3G 8, 3
Gnedin N. Y., Madau P., 2022, @doi [Living Reviews in Computational Astrophysics] 10.1007/s41115-022-00015-5 , https://ui.adsabs.harvard.edu/abs/2022LRCA....8....3G 8, 3
2022 doi
-
[17]
HERA Collaboration et al., 2023, @doi [ ] 10.3847/1538-4357/acaf50 , https://ui.adsabs.harvard.edu/abs/2023ApJ...945..124H 945, 124
2023 doi
-
[18]
J., VanderPlas J
Ivezi \'c Z ., Connelly A. J., VanderPlas J. T., Gray A., 2014, Statistics, Data Mining, and Machine Learning in Astronomy . Princeton University Press
2014
-
[19]
Kakiichi K., et al., 2017, @doi [ ] 10.1093/mnras/stx1568 , https://ui.adsabs.harvard.edu/abs/2017MNRAS.471.1936K 471, 1936
2017 doi
-
[20]
Kannan R., Vogelsberger M., Marinacci F., McKinnon R., Pakmor R., Springel V., 2019, @doi [ ] 10.1093/mnras/stz287 , https://ui.adsabs.harvard.edu/abs/2019MNRAS.485..117K 485, 117
2019 doi
-
[21]
Kannan R., Garaldi E., Smith A., Pakmor R., Springel V., Vogelsberger M., Hernquist L., 2022a, @doi [ ] 10.1093/mnras/stab3710 , https://ui.adsabs.harvard.edu/abs/2022MNRAS.511.4005K 511, 4005
-
[22]
Kannan R., Smith A., Garaldi E., Shen X., Vogelsberger M., Pakmor R., Springel V., Hernquist L., 2022b, @doi [ ] 10.1093/mnras/stac1557 , https://ui.adsabs.harvard.edu/abs/2022MNRAS.514.3857K 514, 3857
-
[23]
Kannan R., et al., 2023, @doi [ ] 10.1093/mnras/stac3743 , https://ui.adsabs.harvard.edu/abs/2023MNRAS.524.2594K 524, 2594
2023 doi
-
[24]
D., 1984, @doi [ ] 10.1016/0022-4073(84)90112-2 , https://ui.adsabs.harvard.edu/abs/1984JQSRT..31..149L 31, 149
Levermore C. D., 1984, @doi [ ] 10.1016/0022-4073(84)90112-2 , https://ui.adsabs.harvard.edu/abs/1984JQSRT..31..149L 31, 149
1984 doi
-
[25]
P., Furlanetto S
Lin Y., Oh S. P., Furlanetto S. R., Sutter P. M., 2016, @doi [ ] 10.1093/mnras/stw1542 , https://ui.adsabs.harvard.edu/abs/2016MNRAS.461.3361L 461, 3361
2016 doi
-
[26]
R., 2016, @doi [ ] 10.1093/mnras/stw071 , https://ui.adsabs.harvard.edu/abs/2016MNRAS.457.1864L 457, 1864
Liu A., Parsons A. R., 2016, @doi [ ] 10.1093/mnras/stw071 , https://ui.adsabs.harvard.edu/abs/2016MNRAS.457.1864L 457, 1864
2016 doi
-
[27]
Majumdar S., et al., 2016, @doi [ ] 10.1093/mnras/stv2812 , https://ui.adsabs.harvard.edu/abs/2016MNRAS.456.2080M 456, 2080
2016 doi
-
[28]
R., 2006, @doi [ ] 10.1086/505167 , https://ui.adsabs.harvard.edu/abs/2006ApJ...653..815M 653, 815
McQuinn M., Zahn O., Zaldarriaga M., Hernquist L., Furlanetto S. R., 2006, @doi [ ] 10.1086/505167 , https://ui.adsabs.harvard.edu/abs/2006ApJ...653..815M 653, 815
2006 doi
-
[30]
McQuinn M., Hernquist L., Zaldarriaga M., Dutta S., 2007b, @doi [ ] 10.1111/j.1365-2966.2007.12085.x , https://ui.adsabs.harvard.edu/abs/2007MNRAS.381...75M 381, 75
2007
-
[31]
Mellema G., et al., 2013, @doi [Experimental Astronomy] 10.1007/s10686-013-9334-5 , https://ui.adsabs.harvard.edu/abs/2013ExA....36..235M 36, 235
2013 doi
-
[32]
Mesinger A., Furlanetto S., 2007, @doi [ ] 10.1086/521806 , https://ui.adsabs.harvard.edu/abs/2007ApJ...669..663M 669, 663
2007 doi
-
[33]
Mesinger A., Furlanetto S., Cen R., 2011, @doi [ ] 10.1111/j.1365-2966.2010.17731.x , https://ui.adsabs.harvard.edu/abs/2011MNRAS.411..955M 411, 955
2011
-
[34]
2024, @doi [ ] 10.1093/mnras/stae1325 , https://ui.adsabs.harvard.edu/abs/2022MNRAS.514.3857K 531, 2943–2957
Neyer et al. 2024, @doi [ ] 10.1093/mnras/stae1325 , https://ui.adsabs.harvard.edu/abs/2022MNRAS.514.3857K 531, 2943–2957
2024 doi
-
[35]
Park J., Mesinger A., Greig B., Gillet N., 2019, @doi [ ] 10.1093/mnras/stz032 , https://ui.adsabs.harvard.edu/abs/2019MNRAS.484..933P 484, 933
2019 doi
-
[36]
Pillepich A., et al., 2018a, @doi [ ] 10.1093/mnras/stx2656 , https://ui.adsabs.harvard.edu/abs/2018MNRAS.473.4077P 473, 4077
-
[37]
Pillepich A., et al., 2018b, @doi [ ] 10.1093/mnras/stx3112 , https://ui.adsabs.harvard.edu/abs/2018MNRAS.475..648P 475, 648
-
[38]
R., Vogelsberger M., 2022, @doi [ ] 10.1103/PhysRevD.106.123506 , https://ui.adsabs.harvard.edu/abs/2022PhRvD.106l3506Q 106, 123506
Qin W., Schutz K., Smith A., Garaldi E., Kannan R., Slatyer T. R., Vogelsberger M., 2022, @doi [ ] 10.1103/PhysRevD.106.123506 , https://ui.adsabs.harvard.edu/abs/2022PhRvD.106l3506Q 106, 123506
2022 doi
- [39]
-
[40]
E., 2022, @doi [ ] 10.1146/annurev-astro-120221-044656 , https://ui.adsabs.harvard.edu/abs/2022ARA&A..60..121R 60, 121
Robertson B. E., 2022, @doi [ ] 10.1146/annurev-astro-120221-044656 , https://ui.adsabs.harvard.edu/abs/2022ARA&A..60..121R 60, 121
2022 doi
-
[41]
R., Giroux M
Shapiro P. R., Giroux M. L., 1987, @doi [ ] 10.1086/185015 , https://ui.adsabs.harvard.edu/abs/1987ApJ...321L.107S 321, L107
1987 doi
- [42]
-
[43]
Shen X., et al., 2024b, @doi [ ] 10.1093/mnras/stad3397 , https://ui.adsabs.harvard.edu/abs/2024MNRAS.527.2835S 527, 2835
-
[44]
Smith A., Kannan R., Garaldi E., Vogelsberger M., Pakmor R., Springel V., Hernquist L., 2022, @doi [ ] 10.1093/mnras/stac713 , https://ui.adsabs.harvard.edu/abs/2022MNRAS.512.3243S 512, 3243
2022 doi
-
[45]
Springel V., 2010, @doi [ ] 10.1146/annurev-astro-081309-130914 , https://ui.adsabs.harvard.edu/abs/2010ARA&A..48..391S 48, 391
2010 doi
-
[46]
Th \'e lie E., Aubert D., Gillet N., Ocvirk P., 2022, @doi [ ] 10.1051/0004-6361/202141748 , https://ui.adsabs.harvard.edu/abs/2022A&A...658A.139T 658, A139
2022 doi
-
[47]
Vogelsberger M., Genel S., Sijacki D., Torrey P., Springel V., Hernquist L., 2013, @doi [ ] 10.1093/mnras/stt1789 , https://ui.adsabs.harvard.edu/abs/2013MNRAS.436.3031V 436, 3031
2013 doi
-
[48]
Vogelsberger M., et al., 2014a, @doi [ ] 10.1093/mnras/stu1536 , https://ui.adsabs.harvard.edu/abs/2014MNRAS.444.1518V 444, 1518
-
[49]
Vogelsberger M., et al., 2014b, @doi [ ] 10.1038/nature13316 , https://ui.adsabs.harvard.edu/abs/2014Natur.509..177V 509, 177
-
[50]
Weinberger R., et al., 2017, @doi [ ] 10.1093/mnras/stw2944 , https://ui.adsabs.harvard.edu/abs/2017MNRAS.465.3291W 465, 3291
2017 doi
-
[51]
Weinberger R., Springel V., Pakmor R., 2020, @doi [ ] 10.3847/1538-4365/ab908c , https://ui.adsabs.harvard.edu/abs/2020ApJS..248...32W 248, 32
2020 doi
-
[52]
H., 2019, @doi [Contemporary Physics] 10.1080/00107514.2019.1631548 , https://ui.adsabs.harvard.edu/abs/2019ConPh..60..145W 60, 145
Wise J. H., 2019, @doi [Contemporary Physics] 10.1080/00107514.2019.1631548 , https://ui.adsabs.harvard.edu/abs/2019ConPh..60..145W 60, 145
2019
-
[53]
Xu C., et al., 2023, @doi [ ] 10.1093/mnras/stad789 , https://ui.adsabs.harvard.edu/abs/2023MNRAS.521.4356X 521, 4356
2023 doi
-
[54]
Yeh J. Y. C., et al., 2023, @doi [ ] 10.1093/mnras/stad210 , https://ui.adsabs.harvard.edu/abs/2023MNRAS.520.2757Y 520, 2757
2023 doi
-
[55]
R., 2007, @doi [ ] 10.1086/509597 , https://ui.adsabs.harvard.edu/abs/2007ApJ...654...12Z 654, 12
Zahn O., Lidz A., McQuinn M., Dutta S., Hernquist L., Zaldarriaga M., Furlanetto S. R., 2007, @doi [ ] 10.1086/509597 , https://ui.adsabs.harvard.edu/abs/2007ApJ...654...12Z 654, 12
2007 doi
-
[56]
P., et al., 2013, @doi [ ] 10.1051/0004-6361/201220873 , https://ui.adsabs.harvard.edu/abs/2013A&A...556A...2V 556, A2
van Haarlem M. P., et al., 2013, @doi [ ] 10.1051/0004-6361/201220873 , https://ui.adsabs.harvard.edu/abs/2013A&A...556A...2V 556, A2
2013 doi
Reviewed August 12, 2026 · model on record in the stance chip above.
Discussion (0). Continue with ORCID to comment.