REVIEW 2 major objections 4 minor 54 references
Downlink Analysis of NOMA-enabled Cellular Networks with 3GPP-inspired User Ranking
T0 review · 2 major / 4 minor · reviewed 2026-08-14 · deepseek-v4-flash
Pith's one-line read This paper claims that pairing one cell-center user with one cell-edge user, dividing them by the ratio of serving-to-dominant-interferer distances, makes downlink NOMA analytically tractable and lets it beat OMA on rate region, cell…
desk verdict A solid typical-cell stochastic-geometry analysis of two-user NOMA with a 3GPP-inspired ranking; the load-bearing joint-distance approximation needs an extra simulation check on the optimized RA comparisons. read the letter →
The pith
A machine-rendered reading of the paper's core claim, the machinery that carries it, and where it could break.
The reading
What carries the argument
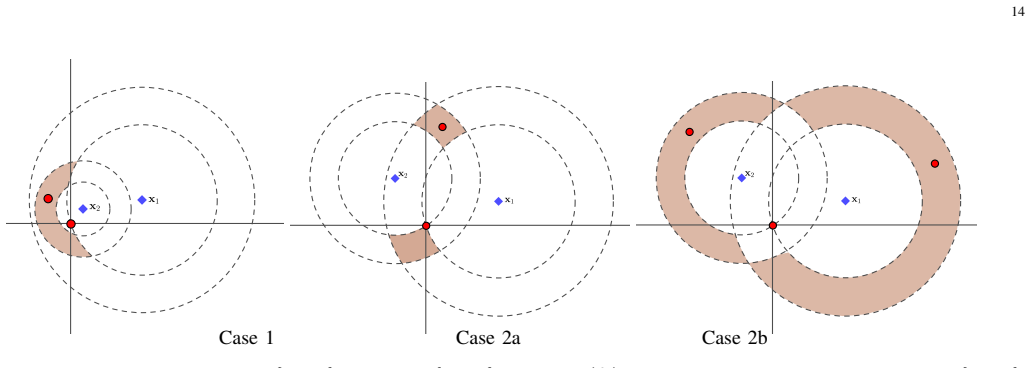
The load-bearing machinery is the approximate joint probability density of the two link distances that define the pairing: the service distance $R_o$ to the serving base station and the distance $R_d$ to the dominant interferer. Eq. (8) approximates this joint density by $(2\pi\rho\lambda)^2 r_o r_d \exp(-\pi\rho\lambda r_d^2)$ for $r_d \ge r_o \ge 0$, with correction factor $\rho = 9/7$; conditioning on $R_o \le \tau R_d$ for center users and $R_o > \tau R_d$ for edge users turns this into the conditional distance laws in Lemma 1. These laws feed Theorem 1's moment formulas for the meta distribution, and the same calibrated joint density is what keeps the later rate, delay, and resource-allocation analysis closed form.
What would settle it
Simulate a Poisson-Voronoi cellular network with the paper's cell-center/cell-edge partition and directly measure the joint distribution of the two distances. If the empirical conditional distance distributions deviate from Lemma 1's formulas beyond Monte Carlo error, or if the empirical first and second moments of the conditional success probability disagree with Eq. (17), the central approximation is falsified.
Extended reading notes
Core claim
The central claim is that the cell-center/cell-edge ranking captures the correlation between the two paired users' link qualities that earlier distance-based rankings threw away, and that this correlation is exactly what the analysis can exploit. A user in the typical cell is classified as a center user if its service distance $R_o$ satisfies $R_o \le \tau R_d$, where $R_d$ is the distance to the dominant interfering base station, and as an edge user otherwise. With the joint density of these two distances approximated as in Eq. (8), Theorem 1 gives the $b$-th moments of the meta distributions as $M_c^b(\chi_c) = \frac{\rho^2}{\tau^2}\int_0^{\tau^2} \frac{(\rho + v Z_b(\chi_c,v))^{-2}}{(1+\chi_c v^{1/\delta})^b}\,dv$ and $M_e^b(\chi_e) = \frac{\rho^2}{1-\tau^2}\int_{\tau^2}^{1} \frac{(\rho + v Z_b(\chi_e,v))^{-2}}{(1+\chi_e v^{1/\delta})^b}\,dv$, where $\chi_c = \max\{\beta_c/\theta,\ \beta_e/(1-\theta(1+\beta_e))\}$, $\chi_e = \beta_e/(1-\theta(1+\beta_e))$, and $\delta = 2/\alpha$. These moments feed $\beta$-distribution approximations of the meta distributions, load-aware rate and mean-delay distributions, and near-optimal resource allocations for maximizing cell sum-rate and sum effective capacity. On the paper's own numerical evidence, NOMA with this ranking gives a strictly larger rate region than OMA, a higher maximum cell sum-rate, and a higher sum effective capacity at high user density.
Load-bearing premise
The entire calculation leans on approximating the joint statistics of the distances to the serving and dominant interfering base stations by those of the two nearest points in a random pattern of base stations whose density is scaled by $9/7$; if real center or edge users do not follow that approximation, the rates, delays, and allocations would shift.
Editorial extensions
If this is right
- For scheduling fractions up to about $\eta = 0.72$ in the paper's setting, both the center and edge users get higher mean transmission rates under NOMA than under OMA, so the cell-level gain is not obtained by starving the edge user.
- The near-optimal NOMA power split is simple: give the edge layer just enough power to meet its rate target and the rest to the center layer up to the balancing point $\hat{\theta}$.
- With non-real-time traffic, maximizing cell sum-rate under minimum-rate constraints favors NOMA over OMA at every user density tested, and the feasible region shrinks as density grows for both.
- With real-time traffic, NOMA's sum effective capacity exceeds OMA's at higher user density when the SIR thresholds are low, because concurrent transmission raises the packet service rate.
- The beta approximations make the rate and delay distributions accurate enough for system-level evaluation without numerically inverting the meta distribution, which is what makes the allocation problems tractable.
Reading between the lines
- If Eq. (8) is as accurate as the paper's simulations suggest, the same center/edge construction with $N-1$ thresholds should yield a moment theory for $N$-user NOMA; the two-user formulas in Theorem 1 are the seed of that generalization.
- The partition rule is defined solely by a serving-to-dominant-interferer distance ratio, so it can be transplanted to other schemes that divide users by quality of service, such as soft frequency reuse, giving those schemes the same stochastic-geometry machinery.
- The delay results are upper bounds built on saturated interfering queues; a simulation that lets interfering queues be non-saturated would show how much conservatism remains in the real-time-traffic conclusions.
- The optimal-power rule $\theta^* = \min(\theta_e, \hat{\theta})$ could be implemented online if the moment functions are precomputed, turning an analytic result into a low-complexity scheduler.
Signed reviews
Editorial analysis
A structured set of objections, weighed in public.
Referee Report
Summary. This paper analyzes downlink two-user NOMA in a Poisson cellular network, pairing one cell-center (CC) user and one cell-edge (CE) user, where the CC/CE regions are defined by whether the service link distance Ro is below or above tau times the distance Rd to the dominant interfering BS. The main technical contributions are approximate moments of the meta distributions for CC/CE users under NOMA and OMA (Theorem 1 and Corollary 1), beta-approximated meta distributions, load-aware transmission-rate CDFs and mean-delay CCDFs (Theorems 2 and 3 along with corollaries), and resource-allocation formulations that maximize cell sum-rate for non-real-time traffic and sum effective capacity for real-time traffic (Section V). The numerical section validates the analytical expressions against Monte Carlo simulations and reports that NOMA improves the rate region, cell sum-rate, and (at higher user density) sum effective capacity relative to OMA.
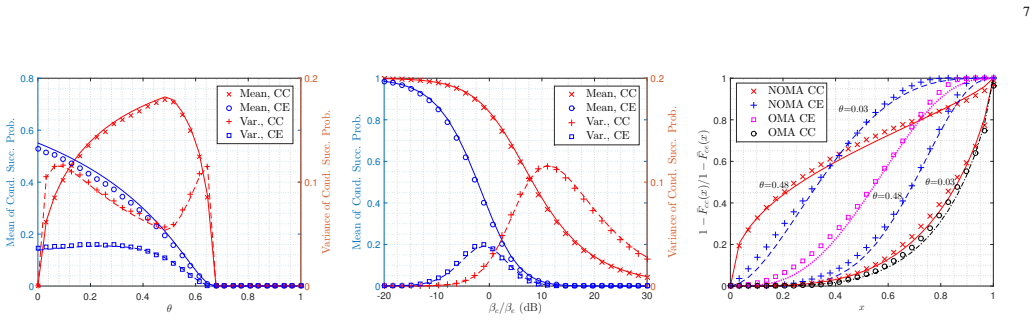
Significance. If the quantitative conclusions hold, the paper makes a useful advance: it moves NOMA analysis from typical-user and distance-based ranking to a typical-cell formulation that respects the correlation between paired users' distances and the dependence on the dominant interferer, and it connects the meta-distribution analysis to load-aware rate and delay metrics. The same approximation chain is applied symmetrically to NOMA and OMA, which reduces the risk that the NOMA-vs-OMA comparison is forced by construction. Strengths include the Monte Carlo verification of the meta-distribution moments (Fig. 2), the rate and delay CDFs (Figs. 4 and 5), and the comparison of the proposed near-optimal RA with brute-force solutions (Fig. 6).
major comments (2)
- [Section III, Eq. (8); Section VI, Fig. 6] The joint density approximation in Eq. (8), with the correction factor rho=9/7 taken from the authors' prior work [38], is the foundation of Lemma 1, Theorem 1, and hence of every rate, delay, CSR, and SEC result in Sections IV-VI. The paper validates the downstream metrics only at selected parameter points in Figs. 2, 4, and 5; Fig. 6, which contains the headline rate-region, CSR, and SEC comparisons, has no direct network-simulation markers for the optimized RA policies, and the 'exact optimal' curves are brute-force evaluations of the same approximate expressions. Because Lemma 1 conditions on the events Ro <= tau*Rd and Ro > tau*Rd, an error in the conditional tails of Eq. (8) could affect the NOMA and OMA comparisons unequally. Please add a direct simulation check of the joint and conditional distance statistics, and Monte Carlo markers for at least the rate-region and the optimized CSR/SEC curves over the range of nu and tau used in Fig. 6.
- [Section II-D, Assumption 1; Section IV, Theorems 2-3] The independence of the CC/CE load and the conditional success probability is used to factor expectations in Theorems 2 and 3. The paper states that the numerical results demonstrate the accuracy of this assumption, but the supporting figures use one default parameter set (plus tau=0.8) and do not quantify the error over the nu, beta, and tau ranges that drive the SEC comparison in Fig. 6 (right). Since the SEC conclusion at higher user density depends on the load distributions and Assumption 1, please report the maximum deviation of the analytical rate/delay CDFs from simulation across the parameter ranges of Fig. 6, or otherwise bound the error introduced by the independence assumption.
minor comments (4)
- [Corollary 1, Eq. (19)] In the CE-OMA moment, the denominator is written with chi_e; since OMA has no power-splitting parameter, it should read beta_e, matching the argument of Z_b and the CC-OMA expression.
- [Section II-A, after Eq. (2)] The phrase 'zero-truncated Poisson distributions with means nu|Vxc|' is imprecise: the mean of the zero-truncated Poisson with parameter nu*a is nu*a/(1-exp(-nu*a)). The subsequent formulas (24)-(25) correctly use the zero-truncated pmf, so please adjust the wording.
- [Lemma 1] The statement that the CC and CE probabilities are tau^2 and 1-tau^2 should be labeled as consequences of the approximate joint density (8) rather than as exact PV-cell probabilities.
- [Section V-A.2] 'CSEOMA' appears to be a typo for 'CSROMA'.
Circularity Check
The derivation is largely self-contained once Eq. (8) is granted, but the joint-distance law at Eq. (8) is a fitted, self-cited input that feeds all subsequent rate/delay/RA results.
-
self citation load bearing
[Section III, Eq. (8), used in Lemma 1 and Theorem 1]
"Thus, we approximate the joint pdf of Ro and Rd using the joint pdf of the distances to the two nearest points in PPP as fRo,Rd(ro,rd) = (2πρλ)2 rord exp(−πρλr2d), for rd ≥ ro ≥ 0, where ρ = 9/7 is the c.f. (refer [38] for more details)."
All subsequent analytic results — Lemma 1's CC/CE distance laws, Theorem 1's moments, and therefore the transmission-rate, delay, CSR, and SEC expressions in Sections IV–VI — are integrals of this one approximate joint density. The constant ρ = 9/7 is a simulation-fitted correction factor introduced in the authors' own prior work [38], and no derivation is given here that a fit to the marginal distance law also reproduces the joint law (Ro, Rd) or the CC/CE conditional tails Ro ≤ τRd and Ro > τRd that define the user classes. The derived moments therefore inherit a fitted input through a self-citation rather than being independent first-principles predictions. That said, both NOMA and OMA are evaluated with the same Eq.
full rationale
Given Eq. (8), the paper's derivation chain is internally consistent and mostly self-contained: Lemma 1 conditions Eq. (8) on the CC/CE events, Theorem 1 integrates the conditional laws against the PPP probability generating functional, and Theorems 2–3 plus the RA formulations are algebraic consequences of those moments. The central NOMA-versus-OMA claim is not circular by construction because both systems are analyzed with the same joint-distance approximation; NOMA actually has worse per-transmission success probabilities, and the reported gain comes from the scheduling/concurrency trade-off, which is not baked into the definitions. The main load-bearing step that reduces to a self-cited fitted input is Eq. (8): ρ = 9/7 is taken from the authors' own prior work [38] and is not independently derived for the joint law or for the CC/CE conditional tails. Figure 2 and Figure 5 provide some simulation validation for selected parameter points, but Figure 6's optimized-RA curves are evaluations of the same approximate expressions rather than direct network-simulation markers for the optimized policies. This is a genuine robustness risk for the quantitative conclusions, though it does not rise to the level of the NOMA-vs-OMA result being forced by construction.
Assumptions & free parameters
free parameters (1)
- ρ (correction factor) =
9/7
assumptions (6)
- standard math Slivnyak's theorem and PPP void probabilities
- domain assumption Full-buffer interfering BSs (saturated queues at interferers)
- domain assumption Assumption 1: CC/CE load (scheduling probability) and successful transmission probability are independent
- domain assumption Gamma approximation for CC and CE region areas
- domain assumption Beta approximation for the meta distributions
- ad hoc to paper Joint pdf of Ro and Rd approximated by two-nearest-point PPP with density ρλ (Eq. 8, ρ=9/7)
Cite this review
Pith. "Pith review of Downlink Analysis of NOMA-enabled Cellular Networks with 3GPP-inspired User Ranking." pith.science (2026). https://pith.science/paper/RJT5XMBZ
@misc{pith2026190801460,
  author       = {Pith},
  title        = {Pith review of: Downlink Analysis of NOMA-enabled Cellular Networks with 3GPP-inspired User Ranking},
  year         = {2026},
  howpublished = {\url{https://pith.science/paper/RJT5XMBZ}},
  note         = {Machine review of arXiv:1908.01460}
}
read the original abstract
This paper provides a comprehensive downlink analysis of non-orthogonal multiple access (NOMA) enabled cellular networks using tools from stochastic geometry. As a part of this analysis, we develop a novel 3GPP-inspired user ranking technique to construct a user cluster for the non-orthogonal transmission by grouping users from the cell center (CC) and cell edge (CE) regions. This technique allows to partition the users with distinct link qualities, which is imperative for harnessing NOMA performance gains. Our analysis is focused on the performance of a user cluster in the typical cell, which is significantly different from the standard stochastic geometry-based approach of analyzing the performance of the typical user. For this setting, we first derive the moments of the meta distributions for the CC and CE users under NOMA and orthogonal multiple access (OMA). Using this, we then derive the distributions of the transmission rates and mean packet delays under non-real time (NRT) and real-time (RT) service models, respectively, for both CC and CE users. Finally, we study two resource allocation (RA) techniques with the objective of maximizing the cell sum rate (CSR) under NRT service, and the sum effective capacity (SEC) under RT service. In addition to providing several useful design insights, our results demonstrate that NOMA provides improved rate region and higher CSR as compared to OMA. In addition, we also show that NOMA provides better SEC as compared to OMA for the higher user density.
Figures


Figures from the paper (4 more)


Reference graph
Works this paper leans on
-
[38]
Downlink analysis for the typical cell in Poisson cellular networks,
P. D. Mankar, P. Parida, H. S. Dhillon, and M. Haenggi, “Downlink analysis for the typical cell in Poisson cellular networks,” IEEE Wireless Commun. Lett., Nov. 2019, [Early Access]
work page 2019
-
[1]
Meta distribution for downlink NOMA in cellular networks with 3GPP-inspired user ranking,
P. D. Mankar and H. S. Dhillon, “Meta distribution for downlink NOMA in cellular networks with 3GPP-inspired user ranking,” IEEE Globecom, Dec. 2019
work page 2019
-
[2]
A survey on non-orthogonal multiple access for 5G networks: Research challenges and future trends,
Z. Ding, X. Lei, G. K. Karagiannidis, R. Schober, J. Yuan, and V . K. Bhargava, “A survey on non-orthogonal multiple access for 5G networks: Research challenges and future trends,” IEEE J. Sel. Areas Commun. , vol. 35, no. 10, pp. 2181–2195, Oct. 2017
work page 2017
-
[3]
On the performance of non-orthogonal multiple access in 5G systems with randomly deployed users,
Z. Ding, Z. Yang, P. Fan, and H. V . Poor, “On the performance of non-orthogonal multiple access in 5G systems with randomly deployed users,” IEEE Signal Process. Lett., vol. 21, no. 12, pp. 1501–1505, Dec. 2014
work page 2014
-
[4]
Impact of user pairing on 5G non- orthogonal multiple-access downlink transmissions,
Z. Ding, P. Fan, and H. V . Poor, “Impact of user pairing on 5G non- orthogonal multiple-access downlink transmissions,” IEEE Trans. Veh. Technol., vol. 65, no. 8, pp. 6010–6023, Aug. 2016
work page 2016
-
[5]
Power allocation for max-sum rate and max-min rate pro- portional fairness in noma,
J. Choi, “Power allocation for max-sum rate and max-min rate pro- portional fairness in noma,” IEEE Commun. Lett. , vol. 20, no. 10, pp. 2055–2058, 2016
work page 2016
-
[6]
Y . Liu, Z. Ding, M. Elkashlan, and H. V . Poor, “Cooperative non- orthogonal multiple access with simultaneous wireless information and power transfer,” IEEE J. Sel. Areas Commun. , vol. 34, no. 4, pp. 938– 953, April 2016
work page 2016
-
[7]
Cooperative non-orthogonal multiple access in 5G systems,
Z. Ding, M. Peng, and H. V . Poor, “Cooperative non-orthogonal multiple access in 5G systems,” IEEE Commun. Lett. , vol. 19, no. 8, pp. 1462– 1465, Aug. 2015
work page 2015
Show all 54 references
-
[8]
Fairness for non-orthogonal multiple access in 5G systems,
S. Timotheou and I. Krikidis, “Fairness for non-orthogonal multiple access in 5G systems,” IEEE Signal Process. Lett. , vol. 22, no. 10, pp. 1647–1651, Oct. 2015
2015
-
[9]
On optimal power allocation for downlink non-orthogonal multiple access systems,
J. Zhu, J. Wang, Y . Huang, S. He, X. You, and L. Yang, “On optimal power allocation for downlink non-orthogonal multiple access systems,” IEEE J. Sel. Areas Commun. , vol. 35, no. 12, pp. 2744–2757, 2017
2017
-
[10]
Non-orthogonal multiple access for large-scale 5G networks: Interference aware design,
K. S. Ali, H. Elsawy, A. Chaaban, and M.-S. Alouini, “Non-orthogonal multiple access for large-scale 5G networks: Interference aware design,” IEEE Access, vol. 5, pp. 21 204–21 216, 2017
2017
-
[11]
Haenggi, Stochastic geometry for wireless networks
M. Haenggi, Stochastic geometry for wireless networks . Cambridge University Press, 2012
2012
-
[12]
A primer on cellular network analysis using stochastic geometry
J. G. Andrews, A. K. Gupta, and H. S. Dhillon, “A primer on cellular network analysis using stochastic geometry.” [Online]. Available: https://arxiv.org/abs/1604.03183
-
[13]
Blaszczyszyn, M
B. Blaszczyszyn, M. Haenggi, P. Keeler, and S. Mukherjee, Stochastic Geometry Analysis of Cellular Networks . Cambridge University Press, 2018
2018
-
[14]
Downlink non-orthogonal multiple access (NOMA) in Poisson net- works,
K. S. Ali, M. Haenggi, H. ElSawy, A. Chaaban, and M.-S. Alouini, “Downlink non-orthogonal multiple access (NOMA) in Poisson net- works,” IEEE Trans. Commun. , vol. 67, no. 2, pp. 1613–1628, Feb. 2019
2019
-
[15]
Meta distribution of downlink non-orthogonal multiple access (NOMA) in Poisson networks,
K. Ali, H. Elsawy, and M. Alouini, “Meta distribution of downlink non-orthogonal multiple access (NOMA) in Poisson networks,” IEEE Wireless Commun. Lett., vol. 8, no. 2, pp. 572–575, April 2019
2019
-
[16]
Meta distribution of SIR in large-scale uplink and downlink NOMA networks,
M. Salehi, H. Tabassum, and E. Hossain, “Meta distribution of SIR in large-scale uplink and downlink NOMA networks,” IEEE Trans. Commun., vol. 67, no. 4, pp. 3009–3025, April 2019
2019
-
[17]
Accuracy of distance-based ranking of users in the analysis of NOMA systems,
——, “Accuracy of distance-based ranking of users in the analysis of NOMA systems,” IEEE Trans. Commun. , vol. 67, no. 7, pp. 5069 – 5083, July 2019
2019
-
[18]
Modeling and analysis of uplink non-orthogonal multiple access in large-scale cellular networks using Poisson cluster processes,
H. Tabassum, E. Hossain, and J. Hossain, “Modeling and analysis of uplink non-orthogonal multiple access in large-scale cellular networks using Poisson cluster processes,” IEEE Trans. Commun., vol. 65, no. 8, pp. 3555–3570, Aug. 2017
2017
-
[19]
The meta distribution of the SIR in Poisson bipolar and cellular networks,
M. Haenggi, “The meta distribution of the SIR in Poisson bipolar and cellular networks,” IEEE Trans. Wireless Commun. , vol. 15, no. 4, pp. 2577–2589, April 2016
2016
-
[20]
Non- orthogonal multiple access in large-scale heterogeneous networks,
Y . Liu, Z. Qin, M. Elkashlan, A. Nallanathan, and J. A. McCann, “Non- orthogonal multiple access in large-scale heterogeneous networks,”IEEE J. Sel. Areas Commun. , vol. 35, no. 12, pp. 2667–2680, Dec. 2017
2017
-
[21]
Downlink and uplink non-orthogonal multiple access in a dense wireless network,
Z. Zhang, H. Sun, and R. Q. Hu, “Downlink and uplink non-orthogonal multiple access in a dense wireless network,” IEEE J. Sel. Areas Commun., vol. 35, no. 12, pp. 2771–2784, Dec. 2017
2017
-
[22]
Self- organizing interference management for LTE,
F. Dominique, C. G. Gerlach, N. Gopalakrishnan, A. Rao, J. P. Seymour, R. Soni, A. Stolyar, H. Viswanathan, C. Weaver, and A. Weber, “Self- organizing interference management for LTE,” Bell Labs Tech. J. , vol. 15, no. 3, pp. 19–42, 2010
2010
-
[23]
Successive interference cancellation in heterogeneous networks,
M. Wildemeersch, T. Q. Quek, M. Kountouris, A. Rabbachin, and C. H. Slump, “Successive interference cancellation in heterogeneous networks,” IEEE Trans. Commun., vol. 62, no. 12, pp. 4440–4453, Dec. 2014
2014
-
[24]
Downlink coverage analysis for a finite 3-D wireless network of unmanned aerial vehicles,
V . V . Chetlur and H. S. Dhillon, “Downlink coverage analysis for a finite 3-D wireless network of unmanned aerial vehicles,” IEEE Trans. Commun., vol. 65, no. 10, pp. 4543–4558, Oct. 2017
2017
-
[25]
Power allocation for max-sum rate and max-min rate propor- tional fairness in NOMA,
J. Choi, “Power allocation for max-sum rate and max-min rate propor- tional fairness in NOMA,” IEEE Commun. Lett. , vol. 20, no. 10, pp. 2055–2058, Oct. 2016
2016
-
[26]
Optimal joint power and subcarrier allocation for full-duplex multicarrier non-orthogonal multiple access systems,
Y . Sun, D. W. K. Ng, Z. Ding, and R. Schober, “Optimal joint power and subcarrier allocation for full-duplex multicarrier non-orthogonal multiple access systems,” IEEE Trans. Commun., vol. 65, no. 3, pp. 1077–1091, March 2017
2017
-
[27]
Power allocation in OFDM based NOMA systems: A DC programming approach,
P. Parida and S. S. Das, “Power allocation in OFDM based NOMA systems: A DC programming approach,” in IEEE Globecom Workshops, Dec. 2014, pp. 1026–1031
2014
-
[28]
Power allocation for a downlink non-orthogonal multiple access system,
C. Wang, J. Chen, and Y . Chen, “Power allocation for a downlink non-orthogonal multiple access system,” IEEE Wireless Commun. Lett. , vol. 5, no. 5, pp. 532–535, Oct 2016
2016
-
[29]
Energy-efficient trans- mission design in non-orthogonal multiple access,
Y . Zhang, H. Wang, T. Zheng, and Q. Yang, “Energy-efficient trans- mission design in non-orthogonal multiple access,” IEEE Trans. Veh. Technol., vol. 66, no. 3, pp. 2852–2857, March 2017. 16
2017
-
[30]
Energy-efficient resource allocation for downlink non-orthogonal multiple access network,
F. Fang, H. Zhang, J. Cheng, and V . C. Leung, “Energy-efficient resource allocation for downlink non-orthogonal multiple access network,” IEEE Trans. Commun., vol. 64, no. 9, pp. 3722–3732, Sept. 2016
2016
-
[31]
An optimization perspective of the superiority of NOMA compared to conventional OMA,
Z. Chen, Z. Ding, X. Dai, and R. Zhang, “An optimization perspective of the superiority of NOMA compared to conventional OMA,” IEEE Trans. Signal Process., vol. 65, no. 19, pp. 5191–5202, Oct. 2017
2017
-
[32]
Effective capacity: a wireless link model for support of quality of service,
D. Wu and R. Negi, “Effective capacity: a wireless link model for support of quality of service,” IEEE Trans. Wireless Commun. , vol. 2, no. 4, pp. 630–643, July 2003
2003
-
[33]
Link-layer capacity of NOMA under statistical delay QoS guarantees,
W. Yu, L. Musavian, and Q. Ni, “Link-layer capacity of NOMA under statistical delay QoS guarantees,” IEEE Trans. Commun., vol. 66, no. 10, pp. 4907–4922, Oct. 2018
2018
-
[34]
Downlink MIMO-NOMA for ultra-reliable low-latency communications,
C. Xiao, J. Zeng, W. Ni, X. Su, R. P. Liu, T. Lv, and J. Wang, “Downlink MIMO-NOMA for ultra-reliable low-latency communications,” IEEE J. Sel. Areas Commun. , vol. 37, no. 4, pp. 780–794, April 2019
2019
-
[35]
Effective capacity of NOMA and a suboptimal power control policy with delay QoS,
J. Choi, “Effective capacity of NOMA and a suboptimal power control policy with delay QoS,” IEEE Trans. Commun., vol. 65, no. 4, pp. 1849– 1858, April 2017
2017
-
[36]
Transmission strategies in multiple-access fading channels with statistical QoS constraints,
D. Qiao, M. C. Gursoy, and S. Velipasalar, “Transmission strategies in multiple-access fading channels with statistical QoS constraints,” IEEE Trans. Inf. Theory, vol. 58, no. 3, pp. 1578–1593, March 2012
2012
-
[37]
NOMA in the uplink: Delay analysis with imperfect CSI and finite-length coding
S. Schiessl, M. Skoglund, and J. Gross, “NOMA in the uplink: Delay analysis with imperfect CSI and finite-length coding.” [Online]. Available: https://arxiv.org/abs/1903.09586
1903 arXiv
-
[39]
Meta distribution analysis of the downlink SIR for the typical cell in a Poisson cellular network,
P. D. Mankar, H. S. Dhillon, and M. Haenggi, “Meta distribution analysis of the downlink SIR for the typical cell in a Poisson cellular network,” IEEE Globecom, Dec. 2019
2019
-
[40]
Stochastic geometry-based uplink analysis of massive MIMO systems with fractional pilot reuse,
P. Parida and H. S. Dhillon, “Stochastic geometry-based uplink analysis of massive MIMO systems with fractional pilot reuse,” IEEE Trans. Wireless Commun., vol. 18, no. 3, pp. 1651–1668, March 2019
2019
-
[41]
User point processes in cellular networks,
M. Haenggi, “User point processes in cellular networks,” IEEE Wireless Commun. Lett., vol. 6, no. 2, pp. 258–261, April 2017
2017
-
[42]
Poisson cluster process based analysis of hetnets with correlated user and base station locations,
M. Afshang and H. S. Dhillon, “Poisson cluster process based analysis of hetnets with correlated user and base station locations,” IEEE Trans. Wireless Commun., vol. 17, no. 4, pp. 2417–2431, April 2018
2018
-
[43]
Modeling and coverage analysis of BS-centric clustered users in a random wireless network,
P. D. Mankar, G. Das, and S. S. Pathak, “Modeling and coverage analysis of BS-centric clustered users in a random wireless network,” IEEE Wireless Commun. Lett., vol. 5, no. 2, pp. 208–211, April 2016
2016
-
[44]
On the stability of interacting queues in a multiple-access system,
R. R. Rao and A. Ephremides, “On the stability of interacting queues in a multiple-access system,” IEEE Trans. Inf. Theory , vol. 34, no. 5, pp. 918–930, Sep. 1988
1988
-
[45]
Bonald, S
T. Bonald, S. Borst, N. Hegde, and A. Prouti ´ere, Wireless data perfor- mance in multi-cell scenarios . ACM, 2004
2004
-
[46]
On the stability of static Poisson networks under random access,
Y . Zhong, M. Haenggi, T. Q. S. Quek, and W. Zhang, “On the stability of static Poisson networks under random access,” IEEE Trans. Commun. , vol. 64, no. 7, pp. 2985–2998, July 2016
2016
-
[47]
Heterogeneous cellular networks with spatio-temporal traffic: Delay analysis and scheduling,
Y . Zhong, T. Q. S. Quek, and X. Ge, “Heterogeneous cellular networks with spatio-temporal traffic: Delay analysis and scheduling,” IEEE J. Sel. Areas Commun. , vol. 35, no. 6, pp. 1373–1386, June 2017
2017
-
[48]
Spatial disparity of QoS metrics between base stations in wireless cellular networks,
B. Bllaszczyszyn, R. Ibrahim, and M. K. Karray, “Spatial disparity of QoS metrics between base stations in wireless cellular networks,” IEEE Trans. Commun., vol. 64, no. 10, pp. 4381–4393, Oct. 2016
2016
-
[49]
Distance from the nucleus to a uniformly random point in the 0-cell and the typical cell of the Poisson-V oronoi tessellation
P. D. Mankar, P. Parida, H. S. Dhillon, and M. Haenggi, “Distance from the nucleus to a uniformly random point in the 0-cell and the typical cell of the Poisson-V oronoi tessellation.” [Online]. Available: https://arxiv.org/abs/1907.03635
1907 arXiv
-
[50]
Note on the inversion theorem,
J. Gil-Pelaez, “Note on the inversion theorem,” Biometrika, vol. 38, no. 3-4, pp. 481–482, Dec. 1951
1951
-
[51]
Statistical distributions of Poisson V oronoi cells in two and three dimensions,
M. Tanemura, “Statistical distributions of Poisson V oronoi cells in two and three dimensions,” Forma, vol. 18, no. 4, p. 221247, 2003
2003
-
[52]
A discrete-time Geo/G/1 retrial queue with general retrial times,
I. Atencia and P. Moreno, “A discrete-time Geo/G/1 retrial queue with general retrial times,” Queueing systems, vol. 48, no. 1-2, pp. 5–21, Sept. 2004
2004
-
[53]
The local delay in Poisson networks,
M. Haenggi, “The local delay in Poisson networks,” IEEE Trans. Inf. Theory, vol. 59, no. 3, pp. 1788–1802, March 2013
2013
-
[54]
On the measure of a random set,
H. E. Robbins, “On the measure of a random set,” Ann. Math. Statist. , vol. 15, no. 1, pp. 70–74, March 1944. Praful D. Mankar (S’14–M’19) Praful received his B.E. degree in Electrical and Communication Engineering from Amravati University, MH, India, in 2006, and the M.Tech d...
1944
Reviewed August 14, 2026 · model on record in the stance chip above.
Discussion (0). Continue with ORCID to comment.