REVIEW 2 major objections 5 minor 45 references
Paired Test of Matrix Graphs and Brain Connectivity Analysis
T0 review · 2 major / 5 minor · reviewed 2026-08-14 · deepseek-v4-flash
Pith's one-line read This paper develops a paired test of matrix graphs that compares brain connectivity networks between correlated samples and asymptotically controls the false discovery rate.
desk verdict A useful paired test for matrix graphs with strong simulations, but the main FDR proof leans on an independent-sample bound that doesn't apply to paired residuals; fix the proof and it's publishable. read the letter →
The pith
A machine-rendered reading of the paper's core claim, the machinery that carries it, and where it could break.
The reading
What carries the argument
The central object is the paired test statistic $W_{i,j}=(\hat{\rho}_{S1,i,j}-\hat{\rho}_{S2,i,j})/\hat{\Theta}_{i,j}^{1/2}$, where $\hat{\rho}_{St,i,j}$ are bias-corrected partial-correlation estimates obtained from node-wise regressions of one brain region on the others. The load-bearing identity is the variance-correction formula (2.6): $\Theta_{i,j}$ subtracts a between-sample term built from products of spatial cross-correlations and the squared Frobenius norm of the normalized between-sample temporal covariance $P_{T1,2}$; this term is estimated by pooling residuals across all regions and time points, which keeps the estimation error small enough for the FDR proof. The multiple-testing step then rejects pairs with $|W_{i,j}|$ above an estimated threshold $\hat{h}_\alpha$ that conservatively targets the false discovery proportion.
What would settle it
Generate paired samples from a matrix-normal model but replace the cross-covariance $\Sigma_{S1,2}\otimes\Sigma_{T1,2}$ with a non-separable matrix of the same norm, keep all marginal variances unchanged, and run the procedure at $\alpha=1\%$ with $n=15$, $p=200$, $q=50$ over many replications; if the empirical FDR moves well above the nominal level, for instance above $3\%$, while the uncorrected test behaves differently, the variance-correction identity (2.6) is missing dependence structure.
Extended reading notes
Core claim
Under the assumption that the paired $p\times q$ matrices jointly follow a matrix-normal distribution with separable covariance, including a Kronecker-product cross-covariance $\Sigma_{S1,2}\otimes\Sigma_{T1,2}$, the paper derives a closed-form expression for the variance of the difference between two estimated spatial partial correlations. The variance equals the sum of the two within-sample variances minus a cross term that factorizes into a spatial part $\rho_{S1,2,i,i}\rho_{S1,2,j,j}+\rho_{S1,2,i,j}\rho_{S1,2,j,i}$ and a temporal part $\|P_{T1,2}\|_F^2/q$. The test statistic $W_{i,j}$ uses a plug-in estimate of this variance with error $o_p(1/\log p)$, and Theorem 3.3 proves that the resulting thresholding procedure satisfies $\mathrm{FDR}(\hat{h}_\alpha)/(\alpha\ell_0/\ell)\to 1$ and $\mathrm{FDP}(\hat{h}_\alpha)/(\alpha\ell_0/\ell)\to_p 1$ as $(nq,p)\to\infty$, giving asymptotic false-discovery control for dependent paired matrix samples.
Load-bearing premise
The paired observations jointly follow a matrix-normal distribution with a separable covariance structure, and specifically the cross-covariance between the two scans is the Kronecker product $\Sigma_{S1,2}\otimes\Sigma_{T1,2}$; if the true dependence is not separable, the variance-correction formula no longer holds and the false-discovery guarantee could fail.
Editorial extensions
If this is right
- For paired scans of the same subjects, the proposed procedure rejects edges whose spatial partial correlation changes, while the false discovery rate converges to the targeted level as $(nq,p)\to\infty$.
- Ignoring the before-after correlation is not just inefficient: for positively correlated scans the uncorrected two-sample test is overly conservative, and for negatively correlated scans it over-rejects; the corrected statistic removes both distortions.
- The asymptotic guarantee holds both when the temporal covariances $\Sigma_{T1}$, $\Sigma_{T2}$, and $\Sigma_{T1,2}$ are known and when they are estimated from the data, with the same $o_p(1/\log p)$ error rate for the variance estimator.
- Sensitivity simulations indicate the procedure keeps FDR near the nominal level when the noise is $t$-distributed and when the true cross-covariance deviates from the Kronecker assumption, although the formal guarantee is proved under the matrix-normal model.
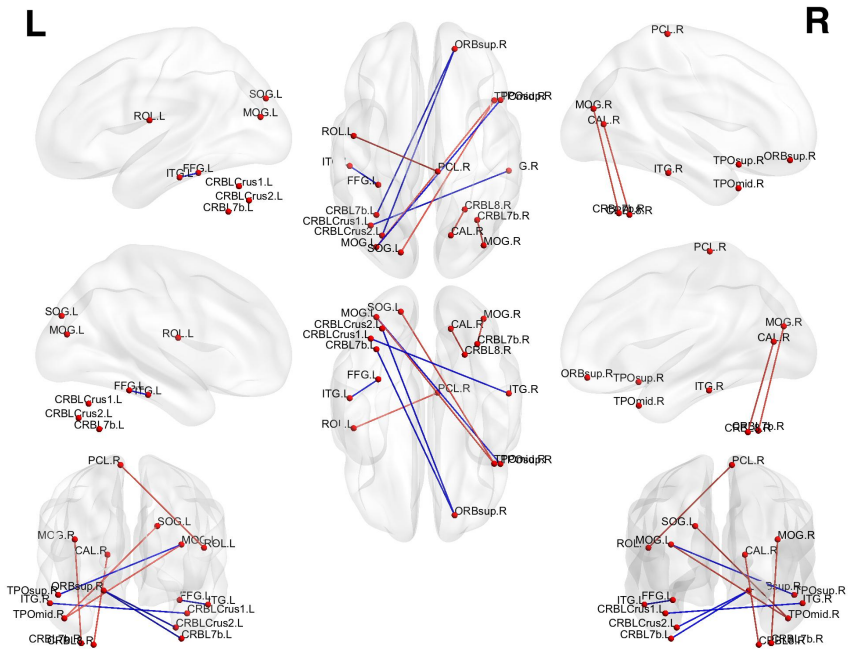
- The ADNI analysis demonstrates the procedure's use in practice, identifying cerebellum-heavy connectivity changes after conversion from mild cognitive impairment to Alzheimer's disease.
Reading between the lines
- The variance-correction identity could carry over to paired tests of covariance or precision matrices in other longitudinal designs, such as case-crossover gene-expression studies, wherever two measurements are taken on the same unit.
- A practical extension the paper leaves implicit is irregular or subject-specific time grids: the estimator of $P_{T1,2}$ pools columns across a common time course, so applying the test to unequally spaced or varying-length recordings would require a new temporal-dependence estimator.
- A nonparanormal copula version of the test, which the authors mention as future work, would be worth testing empirically; if marginal transformations preserve the separable cross-covariance structure, the same variance-correction formula should hold approximately.
Signed reviews
Editorial analysis
A structured set of objections, weighed in public.
Referee Report
Summary. The paper develops a paired test of matrix graphs for comparing the spatial partial correlation matrices of two groups of matrix-variate samples that are paired (e.g., before and after a stimulus). The data are modeled as jointly matrix-normal with separable between-sample covariance Σ_S1,2 ⊗ Σ_T1,2. The test statistic is based on residuals from node-wise regressions after temporal whitening, with a bias-corrected estimator of the partial correlation difference and a new variance correction that accounts for the between-sample spatial and temporal dependence (Proposition 2.1). A multiple testing procedure based on the corrected statistic is shown to control FDR asymptotically (Theorem 3.3) under conditions A1–A7. The method is evaluated in simulations with autoregressive and moving-average temporal structures and several spatial graphs, and is applied to an ADNI dataset of 23 subjects converting from MCI to AD.
Significance. If the theoretical claims are correct, this is the first paired test for matrix graphs in the high-dimensional setting, filling a genuine gap between one-sample and independent two-sample procedures. The variance correction is a nontrivial extension of the authors' earlier work, and the paper provides concrete simulation evidence that the correction matters: the uncorrected two-sample test loses power under positive cross-correlation and inflates FDR under negative cross-correlation. The paper also ships reproducible R code and makes the ADNI-derived data publicly available, and the sensitivity analyses that deviate from the matrix-normal and Kronecker assumptions are a useful practical check. The value of the contribution depends on whether the asymptotic FDR guarantee holds for the general dependence structure in (2.1); the proof as written has a gap for non-diagonal P_T1,2, as detailed below.
major comments (2)
- [Appendix C.4 (proof of Theorem 3.3)] The bound on P(b_i,j^2 ≥ 2 log p) is claimed to be a 'direct result of Lemma B.2', but Lemma B.2 is a large deviation bound for the difference of sample covariances from two independent samples, with denominator var{(X_k,i−μ1,i)(X_k,j−μ1,j)}/n1 + var{(Y_k,i−μ2,i)(Y_k,j−μ2,j)}/n2. In the paired setting of this paper, the relevant difference is (nq)^{-1}Σ_{k,l}(ε^{(1)}_{k,i,l})^2 − (nq)^{-1}Σ_{k,l}(ε^{(2)}_{k,i,l})^2, whose variance is var((ε^{(1)}_{k,i,l})^2 − (ε^{(2)}_{k,i,l})^2)/(nq) and contains the cross-covariance term −2 cov((ε^{(1)})^2,(ε^{(2)})^2) that is absent from Lemma B.2. When this cross-covariance is negative, the true variance is larger than the denominator in Lemma B.2, and the conclusion P(b_i,j^2 ≥ 2 log p) = o(1) does not follow from that lemma. The proof needs a dedicated large deviation bound for paired samples that includes the covariance term.
- [Appendix C.4 (proof of Theorem 3.3)] The redefined variables V_m = (nq Θ_m)^{-1/2} Σ_{k=1}^n Σ_{l=1}^q Z_{k,m,l} are used with the assertion that the argument follows 'the proof of Theorem 1 in Xia and Li (2019)'. However, when P_T1,2 is non-diagonal, the summands Z_{k,m,l} are correlated across l through the between-sample temporal covariance, so var(Σ_{k,l} Z_{k,m,l}) is not nq Θ_m, and the independence-based proof of Xia and Li (2019) does not transfer without an additional argument. The simulations in Section 4 use only diagonal P_T1,2, so this dependence structure is not exercised empirically, and the claimed FDR control for general P_T1,2 allowed by (2.1) is not established by the proof as written.
minor comments (5)
- [Abstract] There is a typo: 'Neuroimaing Initiative' should be 'Neuroimaging Initiative'.
- [Section 5 (ADNI analysis)] The data example has p = 116, q = 130, n = 23, but condition A3 requires q = o(np/(log p)^2), and with these values np/(log p)^2 ≈ 118, so A3 is not satisfied. The paper does not verify this or discuss its implication for the applicability of Theorem 3.3 to the data analysis.
- [Section 4.1 and Appendix D] The banded covariance estimator for Σ_Tt is stated to be adopted, but no description is given of how the banding parameter is chosen in the simulations; Appendix D only describes tuning for the Lasso parameter λ_n,i. A brief statement of the banding choice would improve reproducibility.
- [Table 3] In the Sensitivity I power block for (p,q) = (800,200), the row '6' appears twice; the second occurrence should likely be '8'.
- [Section 2.3, Eq. (2.8)] In the sentence following (2.8), 'we show in Section 3 that ˆΘ_i,j in (2.8) provides an accurate estimation of Θ_i,j' should say 'of Θ_i,j' (subscript consistency with θ_i,j elsewhere is fine, but the notation should be uniform).
Circularity Check
No significant circularity: the paired variance correction and FDR theorem are derived from stated distributional assumptions, with prior-work citations used only as independent technical support.
full rationale
The paper's central claim, Theorem 3.3, is an asymptotic FDR guarantee for a paired matrix-graph test. The derivation starts from the stated matrix-normal model (2.1), constructs the bias-corrected residual-based statistics in Section 2.2, derives the paired variance expression Theta_{i,j} in Proposition 2.1 from fourth moments of the joint normal residuals, and proves the variance-estimator error rates in Propositions 3.1 and 3.2. These proofs are carried out in the appendix with explicit expansions, not assumed from the conclusion. The multiple-testing threshold (2.10) and the FDP estimator are standard constructions, and the FDR control in Theorem 3.3 is a theorem, not a fitted quantity. The self-citations to Xia and Li (2017, 2019) and Cai et al. (2013) are used for technical lemmas and proof skeletons; those results have stated assumptions that do not include the paired dependent setting of this paper, and the paper supplies the paired-specific variance correction and Proposition 2.1. A mathematical concern that Lemma B.2's independent-sample bound may not cover the paired covariance term is a correctness or robustness question, not an instance of the paper's conclusions being equivalent to its inputs by definition. No parameter is fitted to the FDR target and then reported as a prediction. Consequently, no circular step is exhibited.
Assumptions & free parameters
free parameters (2)
- Lasso tuning parameter λ_n,i =
selected by data-driven rule (Section D), b ∈ {1,...,40}
- Banding parameter for temporal covariance estimator =
not specified
assumptions (4)
- domain assumption Matrix normal distribution with Kronecker product covariance, Eq (2.1).
- standard math Normality (elliptically contoured distribution) used for Isserlis fourth-moment computation in the proof of Proposition 2.1.
- domain assumption Regression coefficient estimators satisfy Assumptions (A5)/(A6).
- domain assumption Conditions A1-A7 hold, including p ≲ (nq)^c and q = o(np/(log p)^2).
Cite this review
Pith. "Pith review of Paired Test of Matrix Graphs and Brain Connectivity Analysis." pith.science (2026). https://pith.science/paper/RLBGN6VZ
@misc{pith2026190808095,
  author       = {Pith},
  title        = {Pith review of: Paired Test of Matrix Graphs and Brain Connectivity Analysis},
  year         = {2026},
  howpublished = {\url{https://pith.science/paper/RLBGN6VZ}},
  note         = {Machine review of arXiv:1908.08095}
}
read the original abstract
Inferring brain connectivity network and quantifying the significance of interactions between brain regions are of paramount importance in neuroscience. Although there have recently emerged some tests for graph inference based on independent samples, there is no readily available solution to test the change of brain network for paired and correlated samples. In this article, we develop a paired test of matrix graphs to infer brain connectivity network when the groups of samples are correlated. The proposed test statistic is both bias corrected and variance corrected, and achieves a small estimation error rate. The subsequent multiple testing procedure built on this test statistic is guaranteed to asymptotically control the false discovery rate at the pre-specified level. Both the methodology and theory of the new test are considerably different from the two independent samples framework, owing to the strong correlations of measurements on the same subjects before and after the stimulus activity. We illustrate the efficacy of our proposal through simulations and an analysis of an Alzheimer's Disease Neuroimaing Initiative dataset.
Figures
Reference graph
Works this paper leans on
-
[1]
Ahn, Mihye, Shen, Haipeng, Lin, Weili and Zhu, Hongtu . (2015). A sparse reduced rank framework for group analysis of functional neuroimaging data. Statistica Sinica\/ 25(1), 295
work page 2015
-
[2]
Anderson, TW . (2003). An Introduction to Multivariate Statistical Analysis\/ . John Wiley Tand Sons, Inc., New York
work page 2003
-
[3]
Aston, John AD, Pigoli, Davide, Tavakoli, Shahin and others . (2017). Tests for separability in nonparametric covariance operators of random surfaces. The Annals of Statistics\/ 45(4), 1431--1461
work page 2017
-
[4]
Bickel, Peter J and Levina, Elizaveta . (2008). Regularized estimation of large covariance matrices. The Annals of Statistics\/ 36, 199--227
work page 2008
-
[5]
Brookmeyer, Ron, Evans, Denis A, Hebert, Liesi, Langa, Kenneth M, Heeringa, Steven G, Plassman, Brenda L and Kukull, Walter A . (2011). National estimates of the prevalence of Alzheimer's disease in the United States . Alzheimer's & Dementia\/ 7(1), 61--73
work page 2011
-
[6]
Brookmeyer, Ron, Johnson, Elizabeth, Ziegler-Graham, Kathryn and Arrighi, H. Michael . (2007). Forecasting the global burden of Alzheimer's disease. Alzheimers Dementia\/ 3(3), 186 -- 191
work page 2007
-
[7]
Cai, Fengqin, Gao, Lei, Gong, Honghan, Jiang, Fei, Pei, Chonggang, Zhang, Xu, Zeng, Xianjun and Huang, Ruiwang . (2015). Network centrality of resting-state fmri in primary angle-closure glaucoma before and after surgery. PloS one\/ 10(10), e0141389
work page 2015
-
[8]
Cai, Tony and Liu, Weidong . (2011). Adaptive thresholding for sparse covariance matrix estimation. Journal of the American Statistical Association\/ 106(494), 672--684
work page 2011
Show all 45 references
-
[9]
Cai, Tony, Liu, Weidong and Luo, Xi . (2011). A constrained _1 minimization approach to sparse precision matrix estimation. Journal of the American Statistical Association\/ 106(494), 594--607
2011
-
[10]
Tony, Liu, Weidong and Xia, Yin
Cai, T. Tony, Liu, Weidong and Xia, Yin . (2013). Two-sample covariance matrix testing and support recovery in high-dimensional and sparse settings. J. Amer. Statist. Assoc.\/ 108(501), 265--277
2013
-
[11]
Chen, Shuo, Kang, Jian, Xing, Yishi and Wang, Guoqing . (2015). A parsimonious statistical method to detect groupwise differentially expressed functional connectivity networks. Human brain mapping\/ 36(12), 5196--5206
2015
-
[12]
Chen, Tianwen, Ryali, Srikanth, Qin, Shaozheng and Menon, Vinod . (2013). Estimation of resting-state functional connectivity using random subspace based partial correlation: A novel method for reducing global artifacts. NeuroImage\/ 82, 87--100
2013
-
[13]
Chen, Xi and Liu, Weidong . (2018). Testing independence with high-dimensional correlated samples. The Annals of Statistics\/ 46(2), 866--894
2018
-
[14]
Chen, Xi and Liu, Weidong . (2019). Graph estimation for matrix-variate gaussian data. Statistica Sinica\/ , in press
2019
-
[15]
Ficek, Bronte N, Wang, Zeyi, Zhao, Yi, Webster, Kimberly T, Desmond, John E, Hillis, Argye E, Frangakis, Constantine, Vasconcellos Faria, Andreia, Caffo, Brian and Tsapkini, Kyrana . (2018). The effect of t DCS on functional connectivity in primary progressive aphasia. NeuroIm...
2018
-
[16]
Fox, Michael D and Greicius, Michael . (2010). Clinical applications of resting state functional connectivity. Frontiers in systems neuroscience\/ 4, 19
2010
-
[17]
and Penny, W.D
Friston, K.J., Ashburner, J., Kiebel, S.J., Nichols, T.E. and Penny, W.D. (2007). Statistical Parametric Mapping: The Analysis of Functional Brain Images\/ . Academic Press
2007
-
[18]
Richard, Manuck, Stephen B
Gianaros, Peter J., Sheu, Lei K., Matthews, Karen A., Jennings, J. Richard, Manuck, Stephen B. and Hariri, Ahmad R. (2008). Individual differences in stressor-evoked blood pressure reactivity vary with activation, volume, and functional connectivity of the amygdala. Journal of...
2008
-
[19]
Hedden, Trey, Van Dijk, Koene RA, Becker, J Alex, Mehta, Angel, Sperling, Reisa A, Johnson, Keith A and Buckner, Randy L . (2009). Disruption of functional connectivity in clinically normal older adults harboring amyloid burden. Journal of Neuroscience\/ 29(40), 12686--12694
2009
-
[20]
Jacobs, Heidi I L, Hopkins, David A, Mayrhofer, Helen C, Bruner, Emiliano, van Leeuwen, Fred W, Raaijmakers, Wijnand and Schmahmann, Jeremy D . (2018). The cerebellum in alzheimer's disease: evaluating its role in cognitive decline. Brain\/ 141(1), 37--47
2018
-
[21]
(2016 a )
Kang, Jian, Bowman, F DuBois, Mayberg, Helen and Liu, Han . (2016 a ). A depression network of functionally connected regions discovered via multi-attribute canonical correlation graphs. NeuroImage\/ 141, 431--441
2016
-
[22]
(2016 b )
Kang, Seung-Gul, Yoon, Ho-Kyoung, Cho, Chul-Hyun, Kwon, Soonwook, Kang, June, Park, Young-Min, Lee, Eunil, Kim, Leen and Lee, Heon-Jeong . (2016 b ). Decrease in fmri brain activation during working memory performed after sleeping under 10 lux light. Scientific Reports\/ 6, 36731
2016
-
[23]
Leng, Chenlei and Tang, Cheng Yong . (2012). Sparse matrix graphical models. J. Amer. Statist. Assoc.\/ 107(499), 1187--1200
2012
-
[24]
Liu, Han, Han, Fang, Yuan, Ming, Lafferty, John and Wasserman, Larry . (2012). High-dimensional semiparametric gaussian copula graphical models. The Annals of Statistics\/ 40(4), 2293--2326
2012
-
[25]
Liu, Weidong and others . (2013). Gaussian graphical model estimation with false discovery rate control. The Annals of Statistics\/ 41(6), 2948--2978
2013
-
[26]
Narayan, Manjari, Allen, Genevera I and Tomson, Steffie . (2015). Two sample inference for populations of graphical models with applications to functional connectivity. arXiv preprint arXiv:1502.03853\/
2015 arXiv
-
[27]
Peck, Kyung K, Moore, Anna B, Crosson, Bruce A, Gaiefsky, Megan, Gopinath, Kaundinya S, White, Keith and Briggs, Richard W . (2004). Functional magnetic resonance imaging before and after aphasia therapy. Stroke\/ 35(2), 554--559
2004
-
[28]
Qiu, Huitong, Han, Fang, Liu, Han and Caffo, Brian . (2016). Joint estimation of multiple graphical models from high dimensional time series. Journal of the Royal Statistical Society: Series B (Statistical Methodology)\/ 78(2), 487--504
2016
-
[29]
Quaedflieg, C. W. E. M., van de Ven, V., Meyer, T., Siep, N., Merckelbach, H. and Smeets, T. (2015, 05). Temporal dynamics of stress-induced alternations of intrinsic amygdala connectivity and neuroendocrine levels. PLOS ONE\/ 10(5), 1--16
2015
-
[30]
Rudie, Jeffrey D, Brown, JA, Beck-Pancer, D, Hernandez, LM, Dennis, EL, Thompson, PM, Bookheimer, SY and Dapretto, M . (2013). Altered functional and structural brain network organization in autism. NeuroImage: clinical\/ 2, 79--94
2013
-
[31]
Ryali, Srikanth, Chen, Tianwen, Supekar, Kaustubh and Menon, Vinod . (2012). Estimation of functional connectivity in fmri data using stability selection-based sparse partial correlation with elastic net penalty. NeuroImage\/ 59(4), 3852--3861
2012
-
[32]
Michael and others
Smith, Stephen M., Jenkinson, Mark, Woolrich, Mark W., Beckmann, Christian F., Behrens, Timothy E.J., Johansen-Berg, Heidi, Bannister, Peter R., Luca, Marilena De, Drobnjak, Ivana, Flitney, David E., Niazy, Rami K., Saunders, James, Vickers, John, Zhang, Yongyue, Stefano, Nico...
2004
-
[33]
Tzourio-Mazoyer, Nathalie, Landeau, Brigitte, Papathanassiou, Dimitri, Crivello, Fabrice, Etard, Olivier, Delcroix, Nicolas, Mazoyer, Bernard and Joliot, Marc . (2002). Automated anatomical labeling of activations in spm using a macroscopic anatomical parcellation of the mni m...
2002
-
[34]
van Marle, Hein J.F., Hermans, Erno J., Qin, Shaozheng and Fern\' a ndez, Guill\' e n . (2010). Enhanced resting-state connectivity of amygdala in the immediate aftermath of acute psychological stress. NeuroImage\/ 53(1), 348 -- 354
2010
-
[35]
van Wieringen, Wessel N and Peeters, Carel FW . (2016). Ridge estimation of inverse covariance matrices from high-dimensional data. Computational Statistics & Data Analysis\/ 103, 284--303
2016
-
[36]
Varoquaux, Gael and Craddock, R. Cameron . (2013). Learning and comparing functional connectomes across subjects. NeuroImage\/ 80, 405 -- 415. Mapping the Connectome
2013
-
[37]
Wang, Yikai, Kang, Jian, Kemmer, Phebe B and Guo, Ying . (2016). An efficient and reliable statistical method for estimating functional connectivity in large scale brain networks using partial correlation. Frontiers in neuroscience\/ 10, 123
2016
-
[38]
Xia, Mingrui, Wang, Jinhui and He, Yong . (2013). Brainnet viewer: A network visualization tool for human brain connectomics. PLOS ONE\/ 8, 1--15
2013
-
[39]
Xia, Yin, Cai, Tianxi, Cai, T Tony and others . (2015). Testing differential networks with applications to the detection of gene-gene interactions. Biometrika\/ 102(2), 247--266
2015
-
[40]
Xia, Yin and Li, Lexin . (2017). Hypothesis testing of matrix graph model with application to brain connectivity analysis. Biometrics\/ 73, 780--791
2017
-
[41]
Xia, Yin and Li, Lexin . (2019). Matrix graph hypothesis testing and application in brain connectivity alternation detection. Statistica Sinica\/ 29, 303--328
2019
-
[42]
Xue, Lingzhou and Zou, Hui . (2012). Regularized rank-based estimation of high-dimensional nonparanormal graphical models. The Annals of Statistics\/ 40(5), 2541--2571
2012
-
[43]
Yin, Jianxin and Li, Hongzhe . (2012). Model selection and estimation in the matrix normal graphical model. Journal of Multivariate Analysis\/ 107, 119--140
2012
-
[44]
Zhao, Tuo, Liu, Han, Roeder, Kathryn, Lafferty, John and Wasserman, Larry . (2012). The huge package for high-dimensional undirected graph estimation in r. Journal of Machine Learning Research\/ 13, 1059--1062
2012
-
[45]
write newline
" write newline "" before.all 'output.state := FUNCTION article output.bibitem format.authors "author" output.check author format.key output output.year.check new.block format.title "title" output.check new.block crossref missing format.jour.vol output format.article.crossref ...
Reviewed August 14, 2026 · model on record in the stance chip above.
Discussion (0). Continue with ORCID to comment.