How to measure intra-physician variability in clinical decision-making?
Pith reviewed 2026-06-29 09:42 UTC · model grok-4.3
The pith
Learned-Weights matching estimates intra-physician prescribing variability with the lowest error among eight tested methods on synthetic data.
A machine-rendered reading of the paper's core claim, the machinery that carries it, and where it could break.
Core claim
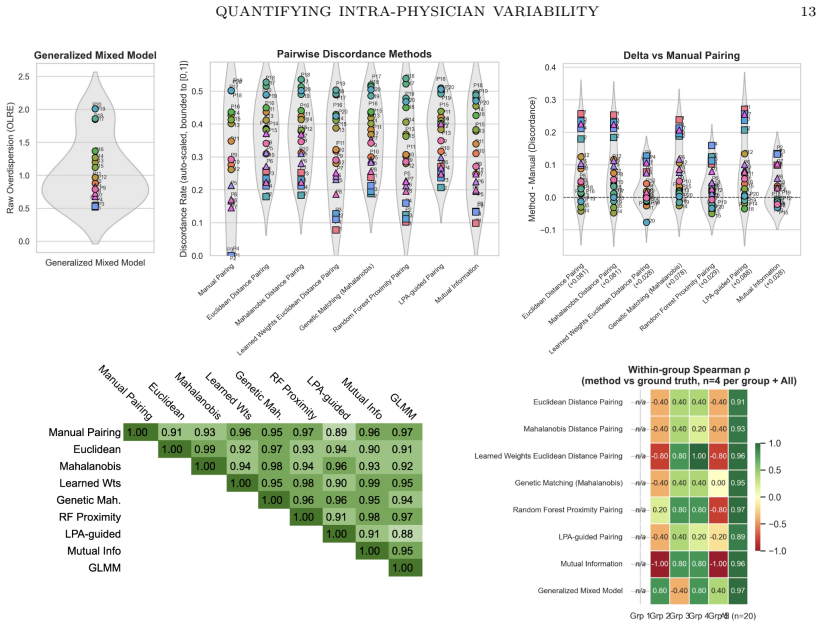
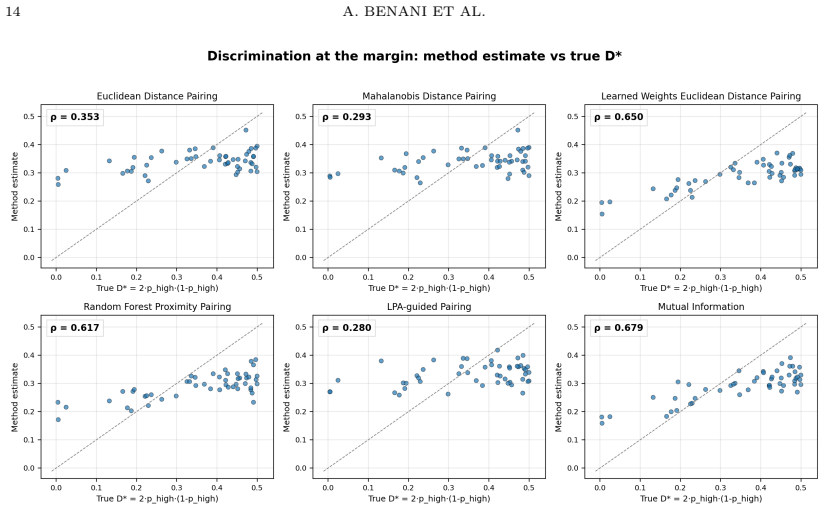
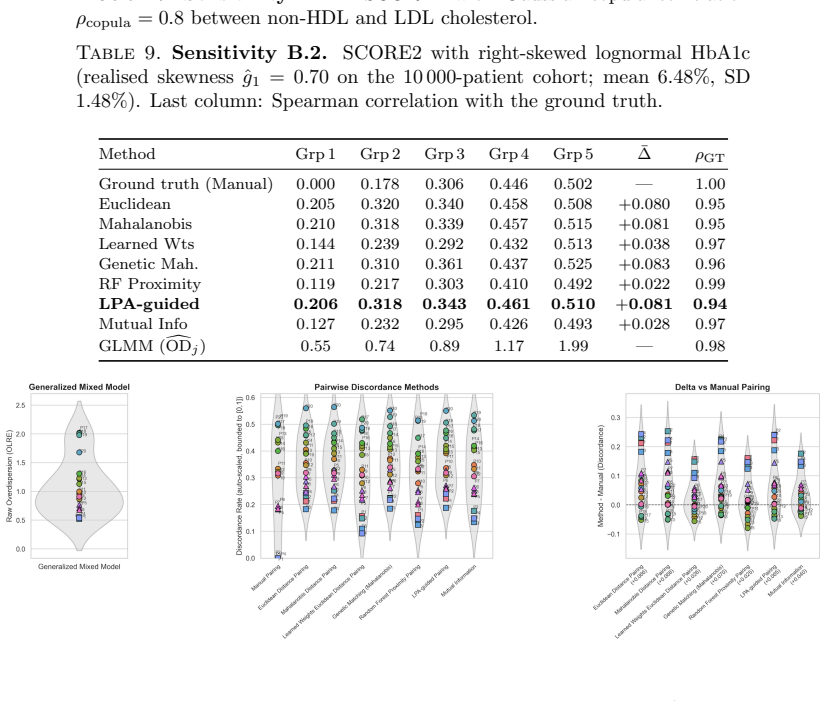
On synthetic data generated across 94 conditions, Learned-Weights matching recovers intra-physician discordance probability with mean absolute error of 0.027, followed by Mutual-Information-weighted matching at 0.028 and Random Forest proximity at 0.034. When physician variability groups are well separated, every method preserves the ground-truth rank ordering of physicians with Spearman correlation above 0.89. Under a continuous-heterogeneity model, supervised feature-weighted methods and the Bayesian GLMM retain moderate rank fidelity while unsupervised approaches fall to 0.28–0.35.
What carries the argument
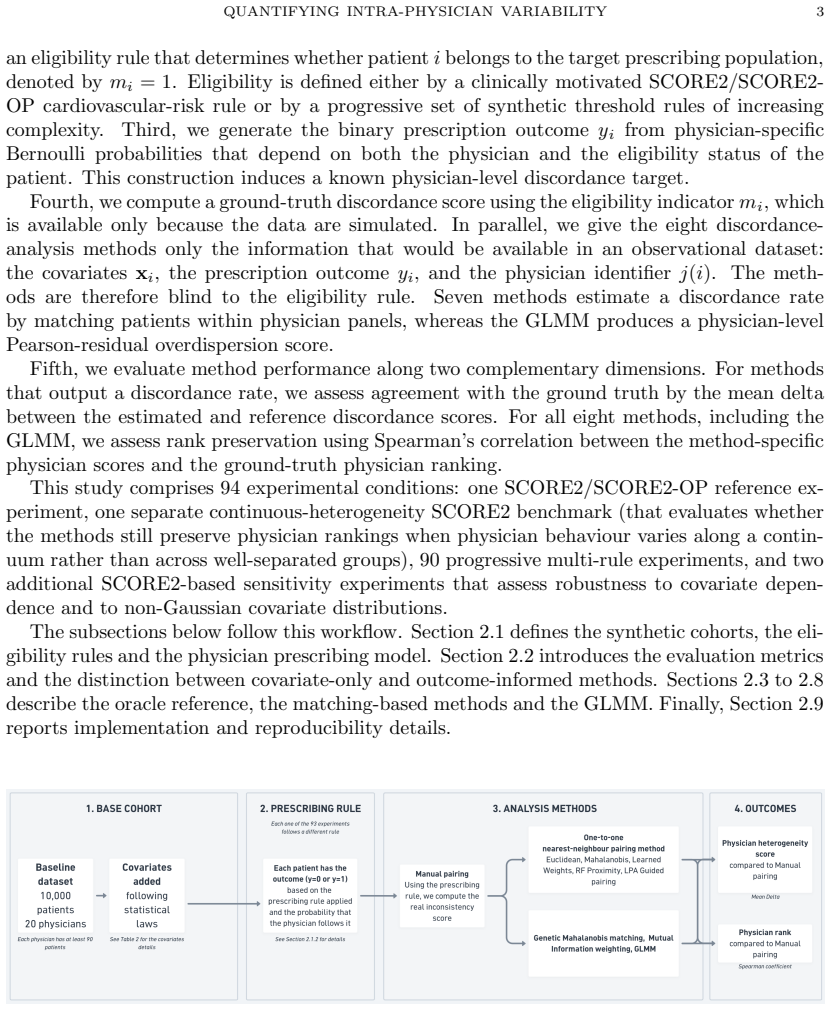
Benchmarking of eight discordance estimators (Euclidean, Mahalanobis, Learned-Weights, Genetic Mahalanobis, Random Forest proximity, Mutual-Information-weighted, Latent Profile Analysis, Bayesian binomial GLMM) against synthetic ground-truth variability.
If this is right
- Learned-Weights matching supplies the most accurate point estimate of a physician's discordance rate on synthetic cases.
- All methods maintain physician ordering when variability clusters are distinct, enabling relative quality ranking.
- Supervised weighted methods remain usable under continuous heterogeneity where unsupervised methods lose rank signal.
- Validated estimators would allow routine tracking of intra-physician inconsistency alongside existing between-physician studies.
- Open-source implementations could be applied directly to electronic health record prescribing logs.
Where Pith is reading between the lines
- The same matching approach could be tested on non-prescribing decisions such as diagnostic test ordering or referral patterns.
- Integration with patient outcome registries would allow direct testing of whether high estimated variability correlates with worse clinical results.
- Real-time dashboard versions could flag physicians whose recent decisions deviate from their own historical patterns on matched cases.
- Extension to multi-center data would reveal whether the relative performance of the eight methods holds across different health systems.
Load-bearing premise
The process used to generate the synthetic patient and physician data accurately reflects the structure and distribution of real intra-physician variability.
What would settle it
Application of the same eight methods to actual observational prescribing records yields mean absolute errors substantially higher than the synthetic benchmarks or Spearman correlations below 0.6 even when groups appear separated.
Figures
read the original abstract
Intra-physician prescribing variability, the probability that one physician issues discordant decisions for two patients deemed comparable on observed covariates, holds great impact in quality of care, safety and cost. However, there are no known validated measurement methods. Here, we benchmark eight methods (Euclidean, Mahalanobis, Learned-Weights, Genetic Mahalanobis, Random Forest proximity, Mutual-Information-weighted, Latent Profile Analysis and Bayesian binomial generalized linear mixed model) against a synthetic ground truth across 94 experimental conditions. Learned-Weights matching achieves the lowest mean absolute error (0.027), followed by Mutual-Information-weighted matching (0.028) and RF Proximity (0.034). All eight discordance-analysis methods preserve the physician rank ordering with high fidelity (Spearman > 0.89 versus the ground truth on the SCORE2 experiment), as long as the physician variability groups are well separated. Under a continuous-heterogeneity physician model, rank preservation degrades substantially for unsupervised methods (Spearman = [0.28, 0.35]) but is retained by supervised feature-weighted methods and the GLMM (Spearman = [0.62, 0.68]). This controlled methodological evaluation is a foundation for validation on observational prescribing data. Once validated on observational prescribing data, these evaluated open-source estimators could turn prescribing inconsistency into a routinely measurable clinician-level quality metric, systematically complementing the existing literature on between-physician variation.
Editorial analysis
A structured set of objections, weighed in public.
Referee Report
Summary. The paper benchmarks eight methods (Euclidean, Mahalanobis, Learned-Weights, Genetic Mahalanobis, Random Forest proximity, Mutual-Information-weighted, Latent Profile Analysis, and Bayesian binomial GLMM) for estimating intra-physician prescribing variability (discordance probability for comparable patients) against synthetic ground truth across 94 experimental conditions plus a SCORE2 experiment. It reports Learned-Weights matching yields the lowest MAE (0.027), followed by Mutual-Information-weighted (0.028) and RF Proximity (0.034); all methods preserve physician rank order with Spearman >0.89 when variability groups are well separated, while supervised weighted methods and the GLMM retain better rank fidelity (Spearman 0.62-0.68) than unsupervised ones (0.28-0.35) under continuous heterogeneity. The work is positioned as a controlled methodological foundation for future validation on real observational prescribing data, with open-source estimators intended to enable clinician-level quality metrics.
Significance. If the synthetic benchmark is representative and method-agnostic, the evaluation supplies concrete guidance on method selection for quantifying intra-physician discordance and supplies reproducible performance metrics (MAE, Spearman correlations) plus open-source code. This could support development of a new, routinely measurable quality indicator that complements existing between-physician variation studies. The use of independently generated synthetic ground truth and explicit reporting of error metrics and rank correlations are explicit strengths.
major comments (1)
- [Methods (synthetic data generation)] Synthetic data generation (Methods section): The headline rankings—Learned-Weights MAE 0.027, superiority of supervised weighted methods under continuous heterogeneity (Spearman 0.62-0.68 vs. 0.28-0.35 for unsupervised), and overall claim that the benchmark is a reliable foundation—rest on the generator producing discordance probabilities independently of the evaluated methods. The manuscript must supply the precise generative mechanism (e.g., how patient covariates, physician effects, and discordance labels are sampled) with explicit checks that the process does not embed correlations favoring feature-weighting or GLMM approaches; without this, the observed performance ordering cannot be treated as robust.
minor comments (1)
- [Abstract] Abstract: the interval notation 'Spearman = [0.28, 0.35]' and '[0.62, 0.68]' is ambiguous without stating whether these are ranges across conditions or 95% intervals; clarify in the abstract and main text.
Simulated Author's Rebuttal
We thank the referee for their constructive feedback on our benchmark study. The single major comment raises an important point about transparency in the synthetic data generator, which we address below.
read point-by-point responses
-
Referee: Synthetic data generation (Methods section): The headline rankings—Learned-Weights MAE 0.027, superiority of supervised weighted methods under continuous heterogeneity (Spearman 0.62-0.68 vs. 0.28-0.35 for unsupervised), and overall claim that the benchmark is a reliable foundation—rest on the generator producing discordance probabilities independently of the evaluated methods. The manuscript must supply the precise generative mechanism (e.g., how patient covariates, physician effects, and discordance labels are sampled) with explicit checks that the process does not embed correlations favoring feature-weighting or GLMM approaches; without this, the observed performance ordering cannot be treated as robust.
Authors: We agree that the precise generative mechanism must be fully specified for the benchmark results to be interpretable and robust. The current manuscript provides a high-level description but omits the full sampling equations and diagnostic checks. In the revised manuscript we will add a dedicated subsection to Methods that details: (i) covariate generation X ~ MVN(0, Σ) with explicit Σ; (ii) physician-specific effects drawn either from discrete groups or a continuous Beta distribution depending on the experimental condition; (iii) ground-truth discordance probability p computed via an independent logistic function of patient and physician features that is deliberately not aligned with any of the eight evaluated estimators; and (iv) Bernoulli sampling of the binary discordance label. We will also include supplementary material with correlation matrices and ablation plots confirming that no method-specific structure was inadvertently introduced. These additions will directly address the concern about potential favoritism toward weighted or GLMM approaches. revision: yes
Circularity Check
No circularity detected; methods benchmarked on independent synthetic ground truth
full rationale
The paper evaluates eight discordance-analysis methods (Euclidean, Mahalanobis, Learned-Weights, etc.) by direct comparison to a separately generated synthetic ground truth across 94 conditions and the SCORE2 experiment. Reported metrics such as MAE 0.027 and Spearman correlations >0.89 are empirical performance measures against this external benchmark, not quantities derived by construction from fitted parameters or self-citations. No equations, uniqueness theorems, or ansatzes are invoked that reduce the central claims to the inputs tautologically. The work is a controlled methodological comparison whose validity rests on the independence of the data generator from the evaluated estimators, making the derivation self-contained.
Axiom & Free-Parameter Ledger
Reference graph
Works this paper leans on
-
[1]
Virani SS, Kennedy KF, Akeroyd JM, et al. Variation in Lipid-Lowering Therapy Use in Patients With Low-Density Lipoprotein Cholesterol≥190 mg/dL: Insights From the Na- tional Cardiovascular Data Registry-Practice Innovation and Clinical Excellence Registry. Circ Cardiovasc Qual Outcomes. 2018;11(5):e004652
2018
-
[2]
Bottle A, Adamson A, Hayhoe B, Quint JK. Between-practice variation in chronic ob- structive pulmonary disease diagnosis guideline compliance: an observational study. BJGP Open. 2026;10(1). doi:10.3399/BJGPO.2024.0263
-
[3]
Mousqu` es J, Renaud T, Scemama O. Is the “practice style” hypothesis relevant for general practitioners? An analysis of antibiotics prescription for acute rhinopharyngitis. Soc Sci Med. 2010;70(8):1176–1184. doi:10.1016/j.socscimed.2009.12.016
-
[4]
Nyholm T, Jonsson J, S¨ oderstr¨ om K, et al. Variability in prostate and seminal vesicle delineations defined on magnetic resonance images, a multi-observer, -center and -sequence study. Radiat Oncol. 2013;8:126. doi:10.1186/1748-717X-8-126
-
[5]
Choi HJ, Kim YS, Lee SH, et al. Inter- and intra-observer variability in contouring of the prostate gland on planning computed tomography and cone beam computed tomography. Acta Oncol. 2011;50(4):539–546. doi:10.3109/0284186X.2011.562916 20 A. BENANI ET AL
-
[6]
Intra- and inter-physician variability in target volume delineation in radiation therapy
Das IJ, Compton JJ, Bajaj A, Johnstone PA. Intra- and inter-physician variability in target volume delineation in radiation therapy. J Radiat Res. 2021. doi:10.1093/jrr/rrab080
-
[7]
Inter- and intra-physician variability in in- sulin injection adjustments compared with Bayesian algorithm recommendations in type 1 diabetes
Kobayati A, Tsoukas MA, Garfield N, et al. Inter- and intra-physician variability in in- sulin injection adjustments compared with Bayesian algorithm recommendations in type 1 diabetes. Diabetologia. 2026;69(4):872–882
2026
-
[8]
SCORE2 risk pre- diction algorithms: new models to estimate 10-year risk of cardiovascular disease in Eu- rope
SCORE2 Working Group and ESC Cardiovascular Risk Collaboration. SCORE2 risk pre- diction algorithms: new models to estimate 10-year risk of cardiovascular disease in Eu- rope. Eur Heart J. 2021;42(25):2439–2454
2021
-
[9]
SCORE2-OP risk prediction algorithms: estimating incident cardiovascular event risk in older persons in four geographical risk regions
SCORE2-OP Working Group and ESC Cardiovascular Risk Collaboration. SCORE2-OP risk prediction algorithms: estimating incident cardiovascular event risk in older persons in four geographical risk regions. Eur Heart J. 2021;42(25):2455–2467
2021
-
[10]
Genetic Matching for Estimating Causal Effects: A General Multivariate Matching Method for Achieving Balance in Observational Studies
Diamond A, Sekhon JS. Genetic Matching for Estimating Causal Effects: A General Multivariate Matching Method for Achieving Balance in Observational Studies. Rev Econ Stat. 2013
2013
-
[11]
Random forests
Breiman L. Random forests. Mach Learn. 2001;45(1):5–32
2001
-
[12]
Unsupervised learning with random forest predictors
Shi T, Horvath S. Unsupervised learning with random forest predictors. J Comput Graph Stat. 2006;15(1):118–138
2006
-
[13]
Estimating mutual information
Kraskov A, St¨ ogbauer H, Grassberger P. Estimating mutual information. Phys Rev E. 2004;69(6):066138
2004
-
[14]
Latent class models for clustering: A comparison with K-means
Vermunt JK, Magidson J. Latent class models for clustering: A comparison with K-means. In: Hagenaars JA, McCutcheon AL, editors. Applied Latent Class Analysis. Cambridge: Cambridge University Press; 2002. p. 89–106. doi:10.1017/CBO9780511499531.004
-
[15]
Constructing a control group using multivariate matched sampling methods that incorporate the propensity score
Rosenbaum PR, Rubin DB. Constructing a control group using multivariate matched sampling methods that incorporate the propensity score. Am Stat. 1985;39(1):33–38
1985
-
[16]
Variational inference: a review for statisticians
Blei DM, Kucukelbir A, McAuliffe JD. Variational inference: a review for statisticians. J Am Stat Assoc. 2017;112(518):859–877
2017
-
[17]
statsmodels: econometric and statistical modeling with Python
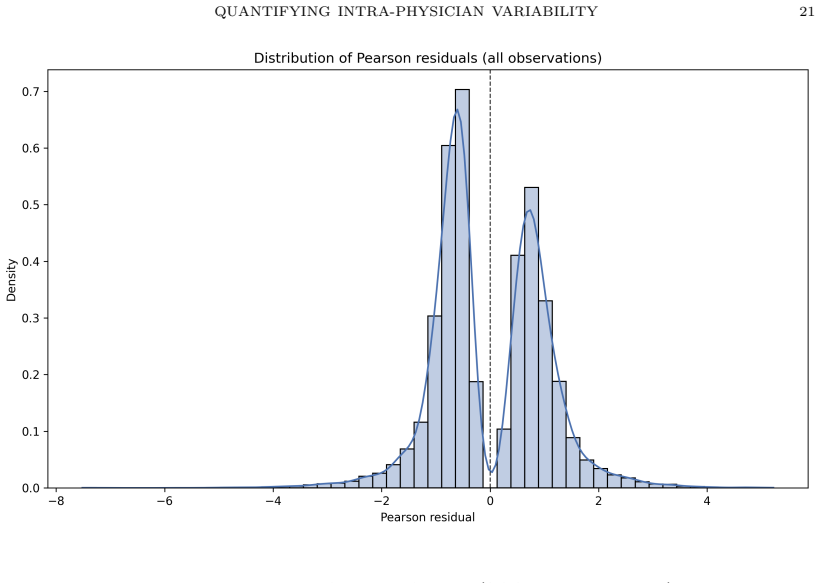
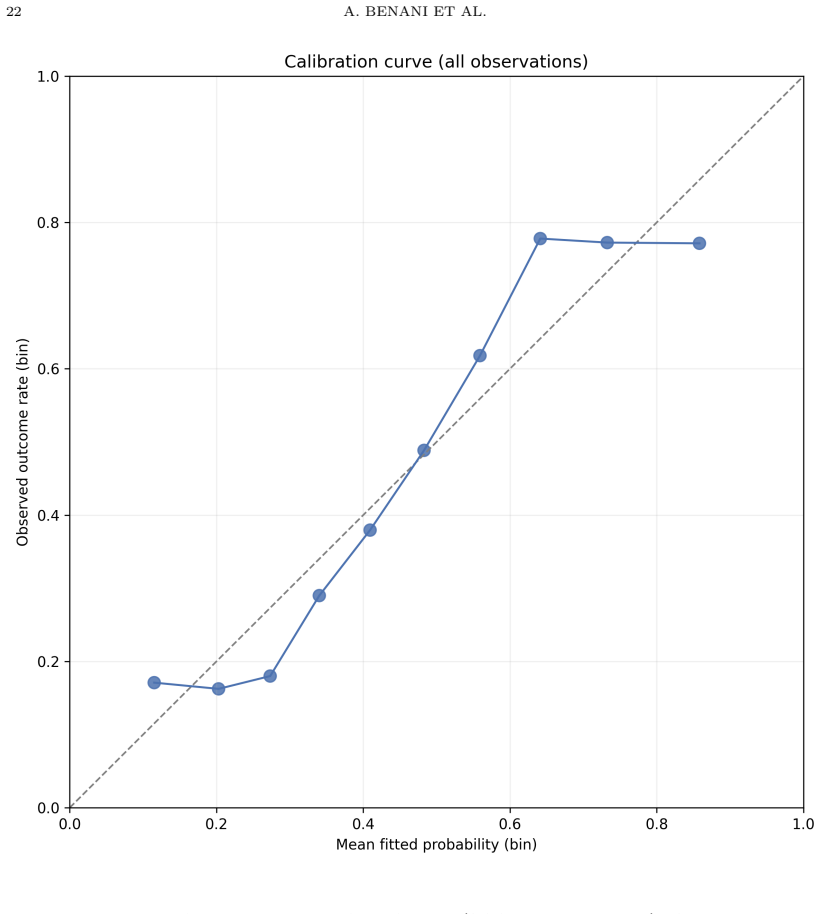
Seabold S, Perktold J. statsmodels: econometric and statistical modeling with Python. Proc 9th Python Sci Conf. 2010:92–96. AppendixA.Distribution of Pearson residuals from the GLMM The distribution of Pearson residuals is normal, and plotted in Fig 4 AppendixB.Calibration curve of the GLMM The calibration curve of the GLMM for the SCORE2 experiment, show...
2010
discussion (0)
Sign in with ORCID, Apple, or X to comment. Anyone can read and Pith papers without signing in.