Monitoring the Ratio of two Normal Variables using EWMA Type Control Charts in Short Production Runs
Pith reviewed 2026-06-27 23:24 UTC · model grok-4.3
The pith
An EWMA control chart for ratios of two normals detects small shifts faster than Shewhart charts in short production runs.
A machine-rendered reading of the paper's core claim, the machinery that carries it, and where it could break.
Core claim
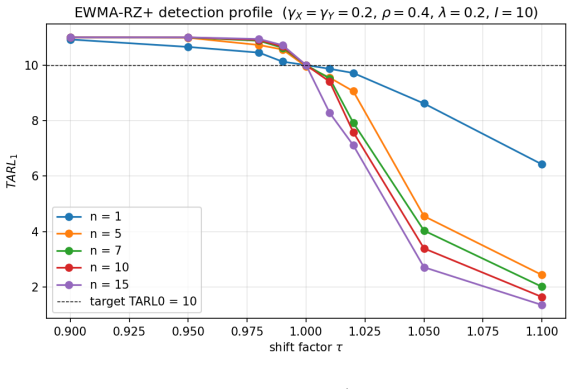
The proposed EWMA-RZ chart, calibrated via Markov chain to a prescribed TARL0 over finite horizon I using Nadarajah's corrected density, provides substantially better detection of small and moderate shifts than the ShRZ chart, especially for |τ - 1| ≤ 0.05.
What carries the argument
Markov-chain representation of the EWMA recursion on the ratio statistic that computes finite-horizon TARL0 and out-of-control TARL1 values from the corrected closed-form density of the ratio of two normals.
If this is right
- The EWMA-RZ chart outperforms ShRZ across variations in smoothing constant, in-control correlation, coefficients of variation, sample size, and shift size.
- The detection advantage is largest for the smallest shifts examined.
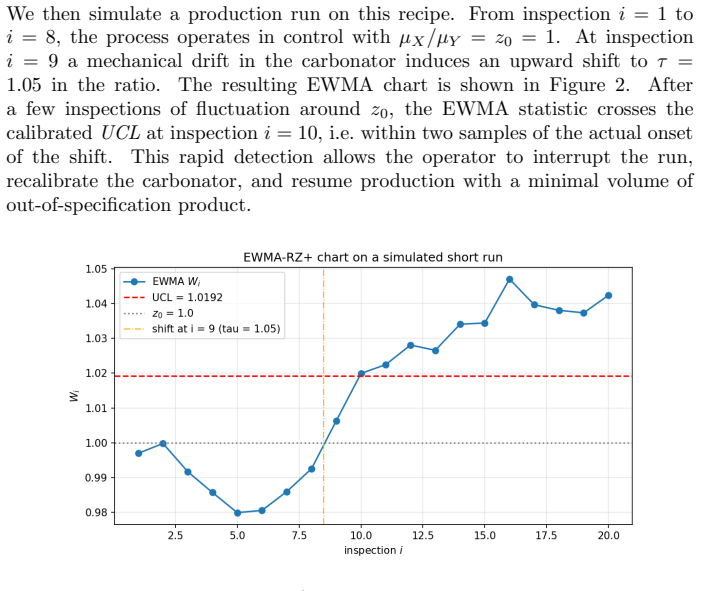
- The method applies directly to processes such as beverage filling where performance is tracked by a ratio.
- Control limits are obtained once per parameter set and then applied to successive ratio observations within the finite horizon.
Where Pith is reading between the lines
- The same Markov-chain calibration could be reused for other memory-type charts on ratios if the density remains valid.
- In industries limited to short batches, adopting this chart would reduce the average number of inspections needed to signal a small drift in the ratio.
- If the normality or independence assumptions on the underlying variables are mildly violated, the relative ranking versus Shewhart may still hold provided the ratio density approximation remains reasonable.
Load-bearing premise
The ratio of the two normal variables follows the corrected closed-form density of Nadarajah (2020) and the Markov-chain representation accurately captures the finite-horizon TARL0 behavior of the EWMA recursion.
What would settle it
A Monte Carlo simulation of the ratio process under the stated density where the out-of-control TARL1 of the EWMA-RZ chart is not lower than that of the ShRZ chart for |τ - 1| ≤ 0.05 would falsify the performance claim.
Figures
read the original abstract
In many industrial and engineering applications, process performance is characterized by the ratio of two normally distributed quality characteristics. Monitoring such ratios is particularly challenging in short production runs, where conventional control charts often suffer from limited sensitivity due to the small number of available inspections. This paper proposes an exponentially weighted moving average (EWMA) control chart for monitoring the ratio of two normally distributed random variables under short production run (SPR) conditions. The statistical distribution of the ratio is first reviewed, adopting the corrected closed-form density of Nadarajah (2020) rather than the approximation used in earlier studies. The control limit of the proposed chart is calibrated to a prescribed in-control truncated average run length (TARL$ _0 $) over a finite horizon $ I $ of inspections, using a Markov-chain representation of the EWMA recursion. The detection performance of the chart is then assessed through a large factorial study covering the smoothing constant $ \lambda $, the in-control correlation $ \rho_0 $, the coefficients of variation $ (\gamma_X, \gamma_Y) $, the sample size $ n $, and the magnitude of the shift $ \tau $. Numerical results show that the proposed EWMA-RZ chart provides substantially better detection of small and moderate shifts than the recently developed Shewhart-type short-run ratio chart (ShRZ) of Tran et al. (2021), especially for $ |\tau - 1| \le 0.05 $. An illustrative example based on a beverage filling process is included to demonstrate the practical implementation of the method.
Editorial analysis
A structured set of objections, weighed in public.
Referee Report
Summary. The paper proposes an EWMA control chart (EWMA-RZ) for monitoring the ratio of two normally distributed variables in short production runs. It reviews the ratio distribution using Nadarajah's (2020) corrected density, calibrates the control limits to a target in-control truncated average run length (TARL0) over a finite horizon using a Markov-chain representation of the EWMA recursion, and evaluates performance via a factorial simulation study. The results indicate that the proposed chart detects small and moderate shifts in the ratio parameter τ more effectively than the Shewhart-type ShRZ chart of Tran et al. (2021), particularly for |τ - 1| ≤ 0.05. An illustrative example is included.
Significance. Should the central numerical comparisons hold, this work contributes a more sensitive monitoring tool for ratio-based quality characteristics in short-run production environments, which are common in manufacturing. The adoption of the exact density and the comprehensive factorial design over parameters such as λ, ρ0, γX, γY, n, and τ provide a solid basis for the performance assessment. The direct comparison to an existing short-run chart is a strength.
major comments (2)
- [Markov-chain approach section] The TARL0 calibration relies on the Markov-chain discretization of the EWMA recursion (described in the section on the proposed chart), but no direct Monte Carlo simulation is reported to verify the accuracy of the transition matrix and absorbing-state handling for the finite horizon I. This verification is necessary to support the in-control calibration and the out-of-control TARL1 comparisons that underpin the superiority claim over ShRZ for |τ-1|≤0.05.
- [Numerical results section] Table or figure presenting the factorial simulation results: the reported performance gains for small shifts should include measures of variability (e.g., standard errors on estimated TARL1 values) to allow assessment of whether the differences from the ShRZ benchmark are statistically meaningful across the design points.
minor comments (2)
- [Abstract] The abstract introduces TARL0 without a brief definition; adding a parenthetical note on its meaning as truncated average run length would improve accessibility.
- [Introduction or model section] Notation for the shift parameter τ and the in-control correlation ρ0 should be consistently defined at first use in the main text.
Simulated Author's Rebuttal
We thank the referee for the constructive feedback on our manuscript. We address each major comment below, indicating planned revisions where appropriate to strengthen the presentation of the Markov-chain calibration and the simulation results.
read point-by-point responses
-
Referee: [Markov-chain approach section] The TARL0 calibration relies on the Markov-chain discretization of the EWMA recursion (described in the section on the proposed chart), but no direct Monte Carlo simulation is reported to verify the accuracy of the transition matrix and absorbing-state handling for the finite horizon I. This verification is necessary to support the in-control calibration and the out-of-control TARL1 comparisons that underpin the superiority claim over ShRZ for |τ-1|≤0.05.
Authors: We agree that an explicit verification step would increase confidence in the finite-horizon Markov-chain implementation. Although the discretization approach follows standard methodology (e.g., Lucas & Saccucci 1990 and subsequent short-run extensions), we will add a brief verification subsection that reports a side-by-side comparison of Markov-chain TARL0/TARL1 values against direct Monte Carlo simulation for a representative subset of design points (λ, ρ0, γX, γY, I). This will be included in the revised manuscript. revision: yes
-
Referee: [Numerical results section] Table or figure presenting the factorial simulation results: the reported performance gains for small shifts should include measures of variability (e.g., standard errors on estimated TARL1 values) to allow assessment of whether the differences from the ShRZ benchmark are statistically meaningful across the design points.
Authors: We acknowledge that reporting variability measures would allow readers to judge the precision of the reported differences. The TARL1 values in the factorial study are obtained from Monte Carlo simulation (with a fixed large number of replications). In the revision we will augment the main tables with standard errors (or 95% intervals) for the estimated TARL1 entries, computed from the simulation replicates, so that the statistical significance of the gains relative to ShRZ can be assessed directly. revision: yes
Circularity Check
Minor self-citation to comparator chart; derivation remains independent
full rationale
The paper proposes an EWMA-RZ chart, adopts the external Nadarajah (2020) closed-form density for the ratio, and calibrates control limits to a target TARL0 via Markov-chain discretization of the EWMA recursion over finite horizon I. Performance is then evaluated via TARL1 in a factorial design and compared to the ShRZ chart from Tran et al. (2021). This comparison involves a self-citation (overlapping author Kim Duc Tran), but the central claim of superior detection for small shifts is an empirical numerical result under the adopted model, not a reduction of any prediction or limit to a fitted input by construction. No self-definitional steps, no fitted parameters renamed as predictions, no uniqueness theorems imported from the authors' prior work, and no ansatz smuggled via citation. The Markov-chain approach is a standard approximation technique whose accuracy is an external verification issue, not a circularity issue. This qualifies as at most minor self-citation that is not load-bearing for the derivation chain.
Axiom & Free-Parameter Ledger
free parameters (1)
- lambda
axioms (2)
- domain assumption X and Y are independent or correlated normal random variables.
- domain assumption The corrected closed-form density of Nadarajah (2020) is accurate for the ratio.
Reference graph
Works this paper leans on
-
[1]
Asma Amdouni, Philippe Castagliola, Hassen Taleb, and Giovanni Celano. Moni- toring the coefficient of variation using a variable sample size control chart in short production runs.International Journal of Advanced Manufacturing Technology, 81(1–4):1–14, 2015. doi: 10.1007/s00170-015-7084-4
-
[2]
One- sided run rules control charts for monitoring the coefficient of variation in short production runs.European Journal of Industrial Engineering, 10(5):639–663,
Asma Amdouni, Philippe Castagliola, Hassen Taleb, and Giovanni Celano. One- sided run rules control charts for monitoring the coefficient of variation in short production runs.European Journal of Industrial Engineering, 10(5):639–663,
-
[3]
doi: 10.1504/EJIE.2016.078804
-
[4]
Asma Amdouni, Philippe Castagliola, Hassen Taleb, and Giovanni Celano. A variable sampling interval Shewhart control chart for monitoring the coefficient of variation in short production runs.International Journal of Production Research, 55(19):5521–5536, 2017. doi: 10.1080/00207543.2017.1285076
-
[5]
Brook and D.A
D. Brook and D.A. Evans. An Approach to the Probability Distribution of CUSUM Run Length.Biometrika, 59(3):539–549, 1972
1972
-
[6]
The variable sample size t control chart for monitoring short production runs.In- ternational Journal of Advanced Manufacturing Technology, 66(9–12):1353–1366,
Philippe Castagliola, Giovanni Celano, Sergio Fichera, and George Nenes. The variable sample size t control chart for monitoring short production runs.In- ternational Journal of Advanced Manufacturing Technology, 66(9–12):1353–1366,
-
[7]
doi: 10.1007/s00170-012-4413-8
-
[8]
Celano and P
G. Celano and P. Castagliola. Design of a phase II control chart for monitoring the ratio of two normal variables.Quality and Reliability Engineering International, 32(1):291–308, 2016
2016
-
[9]
Giovanni Celano, Philippe Castagliola, Enrico Trovato, and Sergio Fichera. She- whart and EWMA t control charts for short production runs.Quality and Reli- ability Engineering International, 27(3):313–326, 2011. doi: 10.1002/qre.1121
-
[10]
The economic per- formance of a CUSUM t control chart for monitoring short production runs
Giovanni Celano, Philippe Castagliola, and Enrico Trovato. The economic per- formance of a CUSUM t control chart for monitoring short production runs. Quality Technology and Quantitative Management, 9(4):329–354, 2012. doi: 10.1080/16843703.2012.11673297
-
[11]
Yiying Chew, Michael B. C. Khoo, Khai Wah Khaw, Ming Ha Lee, and Sa- jal Saha. Optimal designs of variable sample size control chart for monitoring the multivariate coefficient of variation in short production runs.Communi- cations in Statistics: Simulation and Computation, 54(1):234–251, 2025. doi: 10.1080/03610918.2023.2251727. 36
-
[12]
Nger Ling Chong, Michael B. C. Khoo, Abdul Haq, and Philippe Castagliola. Hotelling’s T 2 control charts with fixed and variable sample sizes for monitoring short production runs.Quality and Reliability Engineering International, 35(1): 14–29, 2019. doi: 10.1002/qre.2377
-
[13]
Abdul Haq and Michael B. C. Khoo. Enhanced memory-type charts for monitoring the ratio of two normal random variables.Communications in Statistics: Simulation and Computation, 53(6):2898–2916, 2024. doi: 10.1080/03610918.2022.2092142
-
[14]
Mahfuza Khatun, Michael B. C. Khoo, Ming Ha Lee, and Philippe Castagliola. One-sided control charts for monitoring the multivariate coefficient of variation in short production runs.Transactions of the Institute of Measurement and Control, 41(6):1712–1728, 2019. doi: 10.1177/0142331218789481
-
[15]
Michael B. C. Khoo, Sajal Saha, Sin Yin Teh, Abdul Haq, and How Chinh Lee. The median control chart for process monitoring in short production runs.Com- munications in Statistics: Simulation and Computation, 51(10):5816–5831, 2022. doi: 10.1080/03610918.2020.1783557
-
[16]
Yan Li and Xiaolong Pu. On the performance of two-sided control charts for short production runs.Quality and Reliability Engineering International, 28(2): 215–232, 2012. doi: 10.1002/qre.1237
-
[17]
Lucas and M.S
J.M. Lucas and M.S. Saccucci. Exponentially Weighted Moving Average Control Schemes: Properties and Enhancements.Technometrics, 32(1):1–12, 1990
1990
-
[18]
Saralees Nadarajah and Idika Okorie. A note on “monitoring the ratio of two normal variables using variable sampling interval exponentially weighted moving average control charts”.Quality and Reliability Engineering International, 36(6): 1849–1854, 2020. doi: 10.1002/qre.2649
-
[19]
Huu Du Nguyen, Kim Phuc Tran, and Cedric Heuchenne. Monitoring the ratio of two normal variables using variable sampling interval exponentially weighted moving average control charts.Quality and Reliability Engineering International, 35(1):439–460, 2019. doi: 10.1002/qre.2412
-
[20]
Huu Du Nguyen, Kim Phuc Tran, and Henri L. Heuchenne. CUSUM control charts with variable sampling interval for monitoring the ratio of two normal variables.Quality and Reliability Engineering International, 36(2):474–497, 2020. doi: 10.1002/qre.2595
-
[21]
Optimal design of S 2–EWMA control chart for short production runs
Ker Hsin Ong, Sin Yin Teh, Sajal Saha, Michael Boon Chong Khoo, and Keng Lin Soh. Optimal design of S 2–EWMA control chart for short production runs. Quality and Reliability Engineering International, 39(7):2881–2904, 2023. doi: 10.1002/qre.3396
-
[22]
D. S. Sfiris, P. A. Tsiliki, and B. K. Papadopoulos. Adaptive fuzzy estimators in control charts for short run production processes.International Journal of Fuzzy Systems, 16(4):435–443, 2014
2014
-
[23]
P. F. Tang and N. Barnett. A comparison of mean and range charts with pre- control having particular reference to short-run production.Quality and Reliabil- ity Engineering International, 10(6):477–485, 1994. doi: 10.1002/qre.4680100606
-
[24]
Kim Duc Tran, Qurat-Ul-Ain Khaliq, Adel Ahmadi Nadi, Thi Hien Nguyen, and Kim Phuc Tran. One-sided Shewhart control charts for monitoring the ratio of two normal variables in short production runs.Journal of Manufacturing Processes, 69:273–289, 2021. doi: 10.1016/j.jmapro.2021.07.031. 37
-
[25]
Kim Phuc Tran, Philippe Castagliola, and Giovanni Celano. Monitoring the ratio of two normal variables using EWMA type control charts.Quality and Reliability Engineering International, 32(5):1853–1869, 2016. doi: 10.1002/qre.1918
-
[26]
Pengwei Zhang, Qin Su, Chenglong Li, and Tiantian Wang. An econom- ically designed sequential probability ratio test control chart for short-run production.Computers & Industrial Engineering, 78:74–83, 2014. doi: 10.1016/j.cie.2014.10.002. 38
discussion (0)
Sign in with ORCID, Apple, or X to comment. Anyone can read and Pith papers without signing in.