`pandemonium`: High Dimensional Analysis in Linked Spaces
Pith reviewed 2026-06-28 23:55 UTC · model grok-4.3
The pith
The pandemonium package clusters one variable space and links visualizations in both predictor and response spaces to explore high-dimensional relationships.
A machine-rendered reading of the paper's core claim, the machinery that carries it, and where it could break.
Core claim
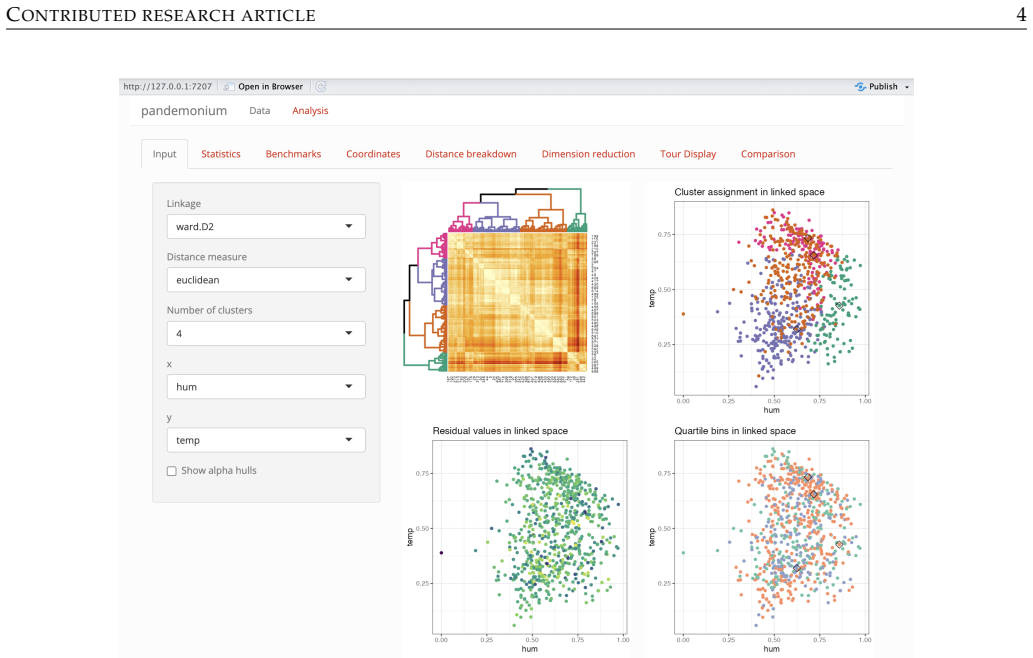
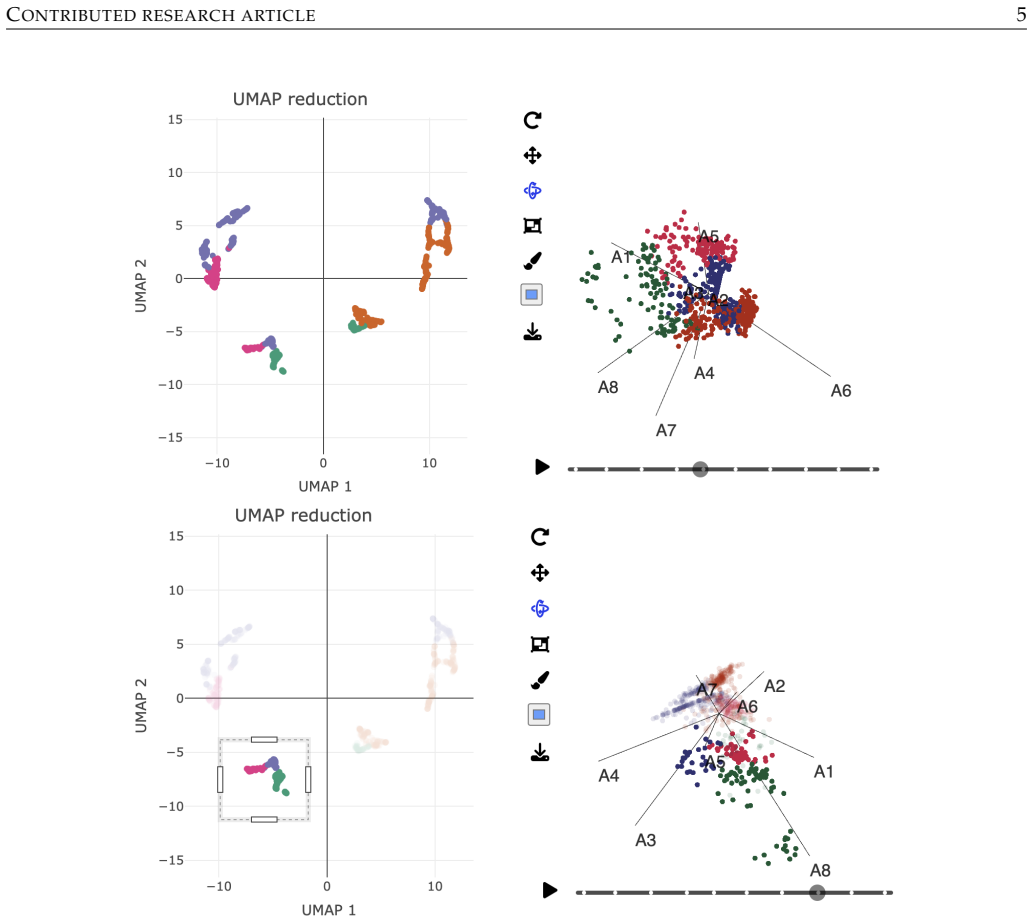
The pandemonium package performs cluster analysis in one set of variables to identify regions with similar patterns, then visualizes the resulting clusters simultaneously in both spaces using linked non-linear dimension reduction and animated tours, allowing users to investigate relationships between predictors and responses in high-dimensional problems.
What carries the argument
Linked non-linear dimension reduction and animated tours applied to clusters identified in one of the two variable spaces.
If this is right
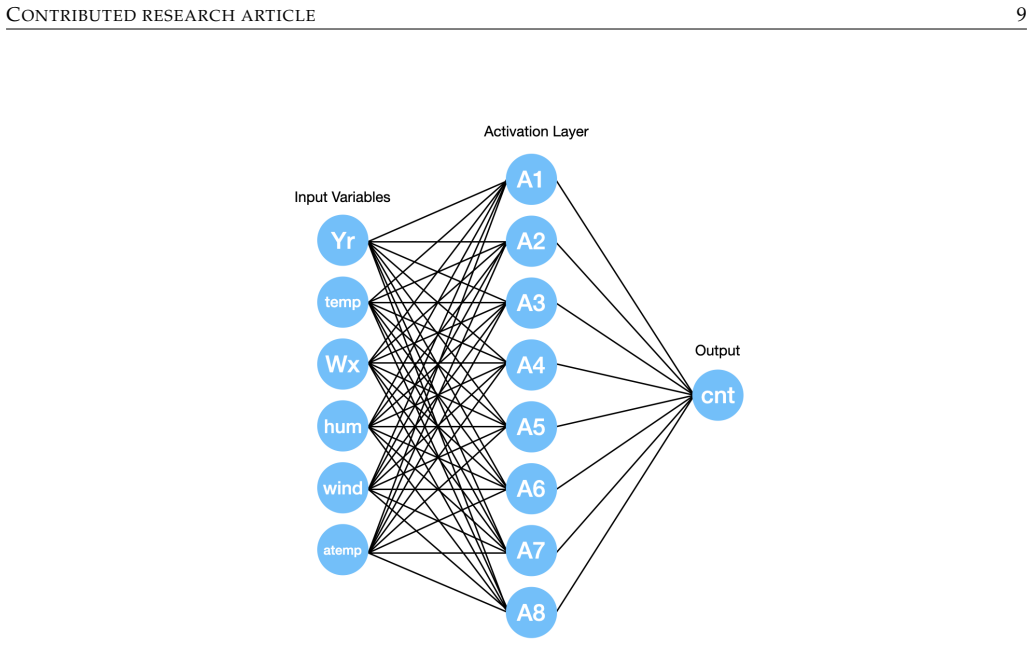
- Input combinations that produce similar latent activations in a neural network can be identified and inspected together.
- Structure in the predictor space of a physics model can be directly related to patterns in the response variables.
- High-dimensional problems become explorable in R without reducing all variables to summary statistics first.
- Two distinct types of linked spaces are supported, one for model internals and one for scientific simulation outputs.
Where Pith is reading between the lines
- The same linking approach could be tested on domains such as genomics to connect gene sets to trait measurements.
- If the tours preserve local cluster geometry reliably, the method may complement purely algebraic techniques like canonical correlation analysis.
- Extending the package to allow user-defined distance metrics in the clustering step could adapt it to problems with known domain-specific similarities.
Load-bearing premise
Clusters formed in one variable space will correspond to meaningful patterns in the second space that the chosen visualization methods display without introducing misleading artifacts.
What would settle it
Applying the package to data with deliberately mismatched cluster structures between the two spaces and observing whether the linked views still suggest false connections.
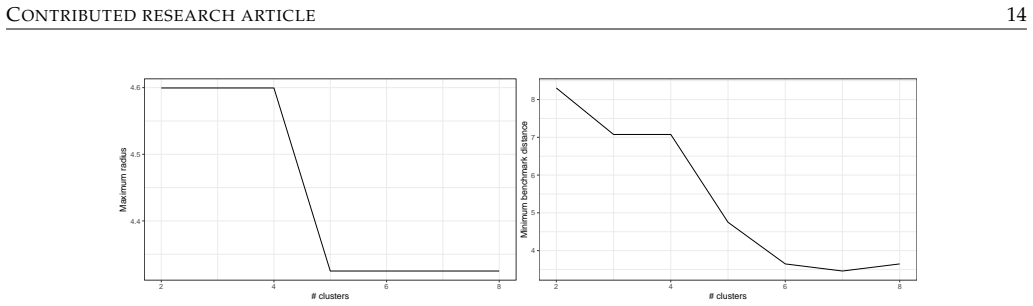
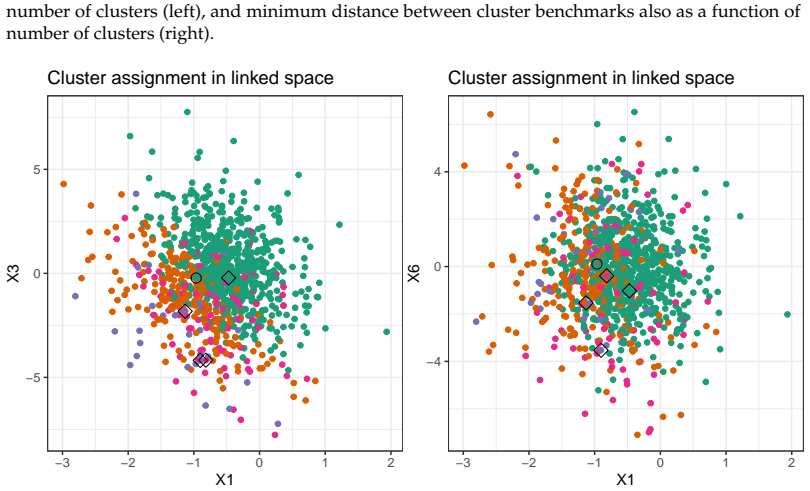
Figures

read the original abstract
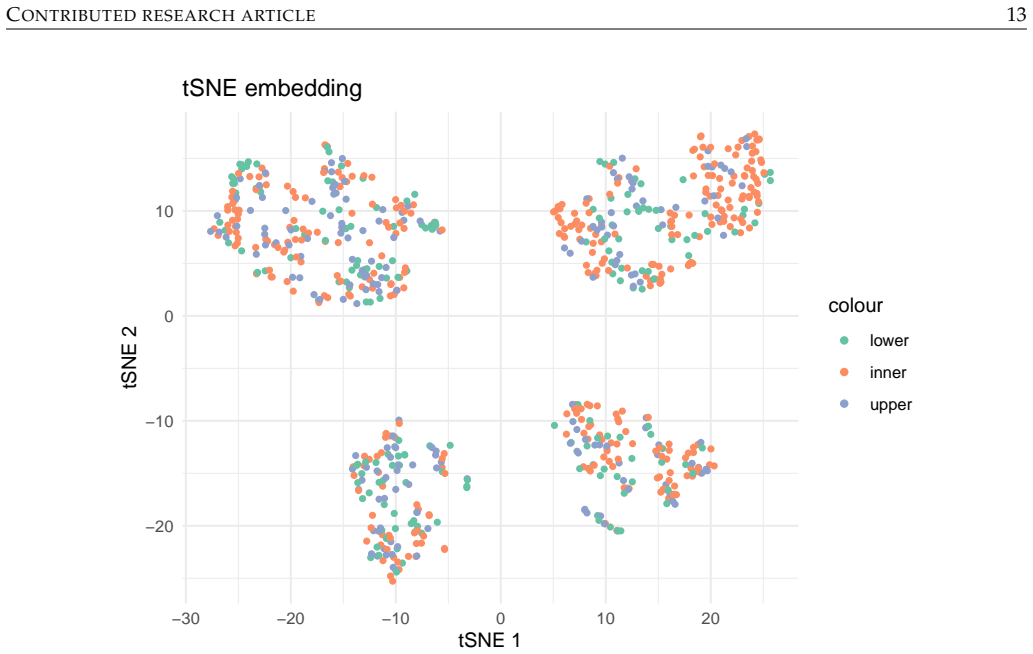
A common challenge in data analysis is uncovering relationships between predictors and responses in problems involving large numbers of both. When the number of predictors and responses is limited, visual approaches are particularly effective. We present an R package, pandemonium, designed to explore such problems by combining cluster analysis with linked visualisations. Clustering is performed in one set of variables to identify regions with similar patterns in that space. The resulting clusters are simultaneously visualised in both spaces using linked views based on non-linear dimension reduction and animated tours. We introduce the package through two examples that illustrate different types of linked spaces. In the first example, we consider how a set of input variables is mapped to latent activations in a neural network regression model, to identify input combinations that result in similar activation patterns. In the second example, we analyse a complex multivariable mathematical model arising in physics to investigate how structure in the predictor space relates to the responses.
Editorial analysis
A structured set of objections, weighed in public.
Referee Report
Summary. The manuscript introduces the R package pandemonium for exploratory analysis of relationships between high-dimensional predictors and responses. Clustering is performed in one variable space, with the resulting groups visualized simultaneously in both spaces via linked non-linear dimension reduction and animated tours. The approach is illustrated through two qualitative case studies: mapping inputs to latent activations in a neural-network regression model, and analyzing structure in a complex multivariable physics model.
Significance. If the linking procedure reliably surfaces non-artifactual cross-space relationships, the package would supply a practical visual workflow for high-dimensional linked data that is currently underserved by existing tools. The work is primarily a software contribution rather than a methodological derivation, so its significance hinges on demonstrated utility rather than theoretical novelty.
major comments (2)
- [Abstract and examples] Abstract and examples sections: the central claim that clustering in one space yields groups whose patterns are meaningfully related to structure in the second space is supported only by two qualitative illustrations. No simulation studies with known ground-truth cross-space mappings, no recovery metrics (e.g., adjusted Rand index or cluster purity across spaces), and no comparison against alternative linking methods are reported, leaving open the possibility that observed alignments are driven by the visualization pipeline.
- [Methods / package description] The manuscript does not specify how the non-linear dimension reduction (e.g., choice of method, hyperparameters) and tour parameters are selected or validated to avoid introducing misleading artifacts when projecting clusters from one space into the other.
minor comments (2)
- [Title and abstract] The package name and citation should be consistently formatted; the title uses backticks around pandemonium while the abstract does not.
- [Examples] No mention of reproducibility: the two examples would benefit from included code or data files so readers can replicate the linked visualizations.
Simulated Author's Rebuttal
We thank the referee for their constructive comments on our manuscript describing the pandemonium R package. The work is positioned as a software tool for exploratory analysis of linked high-dimensional spaces rather than a confirmatory statistical method. We address each major comment below and indicate planned revisions where appropriate.
read point-by-point responses
-
Referee: [Abstract and examples] Abstract and examples sections: the central claim that clustering in one space yields groups whose patterns are meaningfully related to structure in the second space is supported only by two qualitative illustrations. No simulation studies with known ground-truth cross-space mappings, no recovery metrics (e.g., adjusted Rand index or cluster purity across spaces), and no comparison against alternative linking methods are reported, leaving open the possibility that observed alignments are driven by the visualization pipeline.
Authors: We agree that the manuscript presents only qualitative case studies and does not include simulation studies, recovery metrics, or comparisons to alternative methods. pandemonium is intended as an exploratory visualization tool to surface candidate relationships for subsequent investigation, not as a method for recovering known cross-space structure. In such exploratory contexts, quantitative validation against ground truth is often infeasible because the true mappings are unknown by definition. That said, we will add a dedicated limitations subsection discussing the risk of visualization-driven artifacts and recommending user checks such as stability across multiple dimension reductions. This constitutes a partial revision. revision: partial
-
Referee: [Methods / package description] The manuscript does not specify how the non-linear dimension reduction (e.g., choice of method, hyperparameters) and tour parameters are selected or validated to avoid introducing misleading artifacts when projecting clusters from one space into the other.
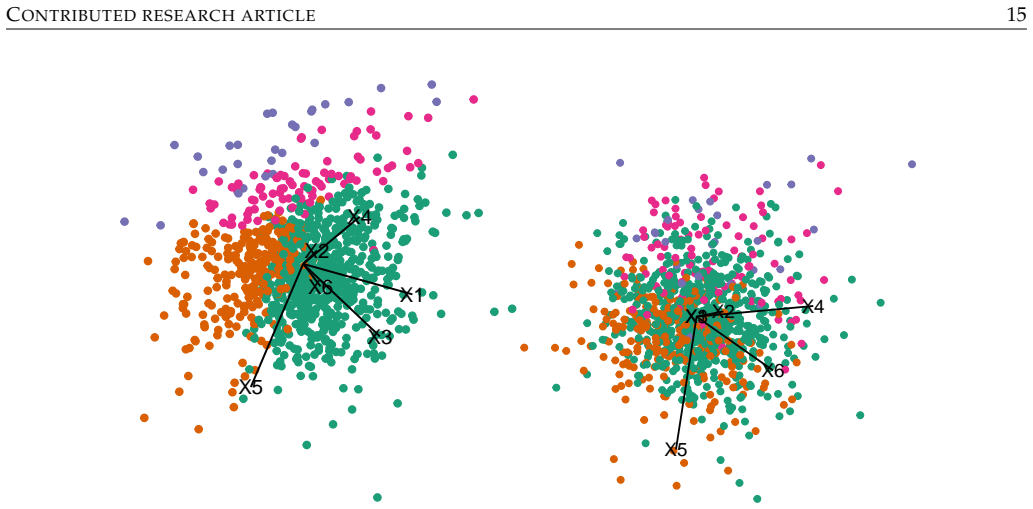
Authors: We acknowledge the lack of explicit detail on dimension reduction and tour parameter choices. The package relies on standard implementations (UMAP and t-SNE via their R packages with default hyperparameters, and tours via the tourr package using the grand tour with default settings). In the revised manuscript we will expand the methods and package description sections to document these defaults, provide user-facing options for customization, and include practical guidance on assessing projection stability (e.g., comparing multiple runs or alternative methods) to reduce the chance of misleading artifacts. revision: yes
Circularity Check
No circularity: software package description with no derivation chain
full rationale
The manuscript presents an R package for linked clustering and visualization in high-dimensional spaces, illustrated via two qualitative case studies. No equations, fitted parameters, predictions, uniqueness theorems, or ansatzes appear in the provided text. The central contribution is a tool and workflow description; it contains no load-bearing mathematical steps that could reduce to self-definition, fitted inputs renamed as predictions, or self-citation chains. This is the expected non-finding for a methods/software paper.
Axiom & Free-Parameter Ledger
Reference graph
Works this paper leans on
-
[1]
doi: 10.1103/PhysRevLett.125.011802. [p13] R. Aaij et al. Comprehensive analysis of local and nonlocal amplitudes in the B0→ K∗0µ+µ− decay. JHEP, 09:026,
-
[2]
doi: 10.1007/JHEP09(2024)026. [p13] J. Allaire and F. Chollet.keras: R Interface to ’Keras’,
-
[3]
doi: 10.1140/epjc/s10052-019-6944-8. [p13] W. Chang, J. Cheng, J. Allaire, C. Sievert, B. Schloerke, Y. Xie, J. Allen, J. McPherson, A. Dipert, and B. Borges.shiny: Web Application Framework for R,
-
[4]
doi: 10.1007/s13748-013-0040-3
ISSN 2192-6352. doi: 10.1007/s13748-013-0040-3. URLhttps://doi.org/10.1007/s13748-013-0040-3. [p8] T. Galili. dendextend: an r package for visualizing, adjusting, and comparing trees of hierarchical clustering.Bioinformatics,
-
[5]
doi: 10.1093/bioinformatics/btv428. URL https://doi.org/10. 1093/bioinformatics/btv428. [p3] C. Hart and E. Wang. Taking the scenic route: Interactive and performant tour animations.The R Journal, 15:307–329,
-
[6]
ISSN 2073-4859. doi: 10.32614/RJ-2023-052. https://doi.org/10.32614/RJ- 2023-052. [p6] C. Hart and E. Wang.detourr: Portable and Performant Tour Animations,
-
[7]
doi: 10.18637/jss.v074.i07. [p2] J. H. Krijthe.Rtsne: T-Distributed Stochastic Neighbor Embedding using Barnes-Hut Implementation,
-
[8]
doi: 10.1140/epjp/s13360-021-02310-1. [p1, 13, 14] U. Laa, D. Cook, and G. Valencia. A slice tour for finding hollowness in high-dimensional data. Journal of Computational and Graphical Statistics, 29(3):681–687,
-
[9]
URL https://doi.org/10. 1080/10618600.2020.1777140. [p6] U. Laa, A. Aumann, D. Cook, and G. Valencia. New and simplified manual controls for projection and slice tours, with application to exploring classification boundaries in high dimensions.Journal of Computational and Graphical Statistics, 32(3):1229–1236,
-
[10]
URL https://doi.org/10.1080/ 10618600.2023.2206459. [p6, 14] E. K. Lee and D. Cook. A projection pursuit index for large p small n data.Statistics and Computing, 20 (3):381–392,
-
[11]
doi: 10.1007/s11222-009-9131-1. [p14] S. Lee, D. Cook, N. da Silva, U. Laa, N. Spyrison, E. Wang, and H. S. Zhang. The state-of-the-art on tours for dynamic visualization of high-dimensional data.WIREs Computational Statistics, 14(4): e1573, 2022a. doi: https://doi.org/10.1002/wics.1573. URL https://wires.onlinelibrary.wiley. com/doi/abs/10.1002/wics.1573...
work page internal anchor Pith review Pith/arXiv arXiv doi:10.1007/s11222-009-9131-1 2073
-
[12]
doi: 10.48550/arXiv.2509.04603. [p1] G. McCoy and G. Valencia
work page internal anchor Pith review Pith/arXiv arXiv doi:10.48550/arxiv.2509.04603
-
[13]
Manuscript in preparation. [p13] L. McInnes, J. Healy, and J. Melville. UMAP: Uniform Manifold Approximation and Projection for Dimension Reduction.arXiv e-prints, art. arXiv:1802.03426, Feb
work page internal anchor Pith review Pith/arXiv arXiv
-
[14]
doi: 10.48550/arXiv.1802.03426. [p5] M. Medl, D. Cook, and U. Laa. Demonstrating the capabilities of the lionfish software for interactive visualization of market segmentation partitions.Austrian Journal of Statistics, 54(3):71–99, Apr
work page internal anchor Pith review Pith/arXiv arXiv doi:10.48550/arxiv.1802.03426
-
[15]
URLhttps://ajs.or.at/index.php/ajs/article/view/2058
doi: 10.17713/ajs.v54i3.2058. URLhttps://ajs.or.at/index.php/ajs/article/view/2058. [p1] J. Melville.uwot: The Uniform Manifold Approximation and Projection (UMAP) Method for Dimensionality Reduction,
-
[16]
URL https://doi.org/10.18637/ jss.v040.i02. [p6] Gabriel McCoy Monash University School of Physics and Astronomy Melbourne, Australia ORCiD: 0009-0008-3570-0361 gabe.mccoy02@gmail.com German Valencia Monash University School of Physics and Astronomy Melbourne, Australia ORCiD: 0000-0001-6600-1290 german.valencia@monash.edu Ursula Laa BOKU University Insti...
2073
discussion (0)
Sign in with ORCID, Apple, or X to comment. Anyone can read and Pith papers without signing in.