REVIEW 5 major objections 6 minor 49 references
Sampling Imbalanced Data with Multi-objective Bilevel Optimization
T0 review · 5 major / 6 minor · reviewed 2026-08-07 · deepseek-v4-flash
Pith's one-line read MOODS treats data sampling as a bilevel F1 maximization problem and reports 1-15% F1 gains over state-of-the-art samplers on seven imbalanced datasets.
desk verdict A plausible GAN-free resampling heuristic with public code, but the new epsilon/delta metric is an unvalidated proxy and the causal claim about diversity driving F1 gains is not supported; worth sending to reviewers for a major revision. read the letter →
The pith
A machine-rendered reading of the paper's core claim, the machinery that carries it, and where it could break.
The reading
What carries the argument
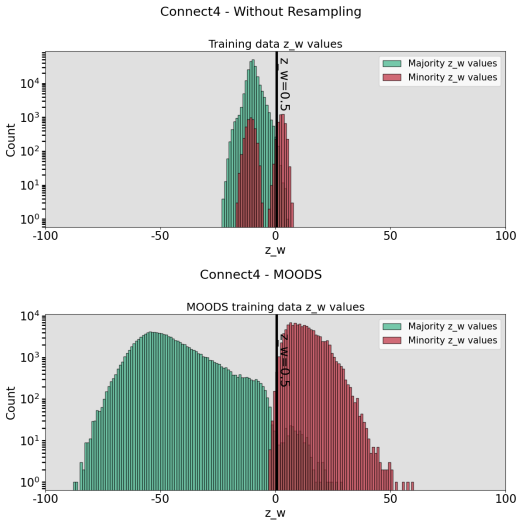
The carrying mechanism is the coupled pair: the MOODS bilevel loop (Algorithm 1) and the $\epsilon/\delta$ non-overlapping diversification metric. In MOODS, the outer loop plays the leader choosing which samples enter training, and the inner loop plays the follower that fully trains the network on those samples; acceptance is decided by simultaneous improvement in both validation F1 objectives. The $\epsilon/\delta$ metric compares the trained network's scalar outputs $z_{w^*}(x)$ for the original imbalanced data and the resampled set: minority overlap is the fraction of minority outputs on the majority side of $z_{w^*} = 1/2$, and diversity is the order-of-magnitude increase in output variance. A set is declared $S^{\epsilon/\delta}$ when overlap falls by at least $\epsilon$ percentage points and variance rises by at least $\delta$ orders of magnitude.
What would settle it
Train MOODS on a dataset constructed so that the model's scalar output is nearly constant or dominated by one feature while meaningful diversity lies in orthogonal feature directions; if $\epsilon/\delta$ still improves but F1 does not, the proxy fails and the claimed mechanism is wrong. Alternatively, if a method that actively worsens $\epsilon/\delta$ still matches MOODS's F1, then diversity is not the driver.
Extended reading notes
Core claim
The central claim is that a training set can be optimized directly for imbalanced classification by treating sampling as a bilevel program: the upper level minimizes $(1 - F1_m)$ and $(1 - F1)$ over candidate training subsets built from original majority points, original minority points, and SVM-SMOTE-generated synthetic minority points, subject to the lower-level condition that the model weights minimize binary cross-entropy loss on that subset. MOODS walks through this space by adding or removing one point at a time and accepting a step only when both F1 scores on disjoint validation data improve. In the paper's experiments this yields balanced training sets, and the accompanying $\epsilon/\delta$ metric shows minority model outputs moving to the correct side of the $z_{w^*} = 1/2$ boundary and output variance rising by roughly 0.7 to 3.1 orders of magnitude, which the paper links to the 1-15% F1 gains.
Load-bearing premise
The load-bearing premise is that the network's scalar output $z_{w^*}(x)$ is a faithful 1-D stand-in for the high-dimensional feature vector $x$, so that variance and overlap of these outputs measure the diversity and overlap of the actual training data.
Editorial extensions
If this is right
- If MOODS is right, sampling methods should be judged by whether they reduce minority overlap and raise output diversity, not by how many synthetic points they generate.
- The bilevel formulation gives a template for optimizing other data-level choices, such as which features to keep, by swapping the upper-level objective.
- The $\epsilon/\delta$ metric can be applied to any pair of training sets, giving researchers a common yardstick to compare sampling algorithms beyond F1.
- Because synthetic data are generated by SVM-SMOTE and then filtered by F1, MOODS inherits SMOTE's boundary-focused proposals but discards those that fail to improve validation performance.
Reading between the lines
- The paper's causal story, that diversity drives F1, is only as strong as the 1-D proxy; a direct test would compute $\epsilon/\delta$ using feature-space distances or a second independent model.
- If the proxy holds, the $\epsilon/\delta$ metric could serve as a cheap validation signal during training, letting samplers stop when overlap and variance targets are met rather than after full retraining.
- The paper reports that it has not yet established convergence of the upper-level problem or a Pareto front; a formal convergence guarantee for the greedy accept/reject scheme would be the natural next step.
- Spambase, the least imbalanced dataset, is the one where MOODS does not lead, suggesting that the method's gains concentrate where minority overlap is severe, a testable prediction for other mildly imbalanced datasets.
Editorial analysis
A structured set of objections, weighed in public.
Referee Report
Summary. The manuscript proposes MOODS, a multi-objective bilevel optimization algorithm for resampling imbalanced training data: an outer loop selects synthetic minority samples (from SVM-SMOTE) and undersamples majority data by optimizing two validation F1 objectives, while an inner loop trains a neural network. The authors also introduce an 'epsilon/delta non-overlapping diversification metric' that measures overlap and diversity of model outputs z_w*(x), and use it to argue that improvements in diversity and overlap drive a 1-15% F1 improvement over state-of-the-art baselines on seven datasets. The paper includes public code and honest statements of limitations, but the central causal claim rests on the validity of the scalar-output proxy.
Significance. If the claims were established, MOODS would be a practical contribution to imbalanced classification, combining bilevel optimization with sampling in a way that could be extended to other objectives. The paper provides a concrete algorithm, evaluates on seven benchmark datasets, and makes code available. However, the contribution's key novelty--the epsilon/delta metric as a validated measure of sampling quality--is not established: the metric is partly circular, thresholds are post hoc, and the proxy from scalar outputs to feature-space diversity is unvalidated. The authors also explicitly state that convergence of the upper-level problem is not confirmed. These issues undermine the paper's main claims.
major comments (5)
- [Sec. 4.1, Def. 4] The overlap measure cSm := {s=(x,1) | z_w*(x) <= 1/2} is exactly the set of minority points misclassified by the trained model under Def. 2. Because Prob. (1) directly maximizes F1_m, any successful optimization reduces this count by construction. Thus the reported decreases in overlap (Table 2, columns Delta(kappa_m)) are not independent evidence of improved feature-space diversity; they are a restatement of the objective being optimized. The causal claim that diversity drives the F1 gains is therefore unsupported by this metric.
- [Sec. 3.1, Algorithm 1] The authors state: 'we did not find a Pareto front so have not yet confirmed convergence nor that the objective is being achieved.' Yet the abstract, Sec. 1, and Sec. 3 refer to 'constructing an optimal training set' and identifying a 'single Pareto optimal point.' Without convergence confirmation or a characterization of the produced point relative to the Pareto set, the optimality claim is not justified and should be either removed or substantially weakened.
- [Sec. 5.2, Table 2] No error bars or significance tests are reported for the F1 comparisons. The text reports MOODS variances (2.58e-6 to 2.37e-4) but not those of baselines, and the '1-15% improvement' claim is a point estimate comparison. On Spambase MOODS ties at 0.92 but is 1% below GBO/SSG; without confidence intervals or paired tests it is unclear which differences are meaningful. The table should include standard errors or confidence intervals, and the comparison to SMOTified-GAN uses published results rather than runs on the same infrastructure, which should be flagged as a limitation.
- [Sec. 5.3, Def. 6] The epsilon/delta thresholds are not specified before evaluation; the paper reports 'We attained five S^{26/1.7} training sets' and 'four S^{52/0.7} ultimate training sets.' These thresholds are chosen post hoc from the observed values (e.g., Table 4), which makes the S^{epsilon/delta} classification descriptive rather than a testable prediction. To be a valid metric, the thresholds should be fixed a priori or derived from an independent criterion.
- [Sec. 4.1, Def. 5] The assertion that the scalar output z_w*(x) is 'a 1-D analog' to the feature vector x is not validated. The variance of scalar logits can increase from training dynamics, softmax saturation, or batch statistics even when the input feature distribution is unchanged. No experiment is provided that correlates output-space variance/overlap with feature-space diversity (e.g., using a held-out feature-space diversity measure). Until such validation is provided, the metric's variance component does not support the conclusion that MOODS improves feature diversity.
minor comments (6)
- [Sec. 2, Def. 1] The cross-entropy expression for the minority loss uses e^{z_w(x)}/(e^{z_w(x)}+e^{1-z_w(x)}), which corresponds to a two-class softmax with logits z and 1-z, not the standard binary cross-entropy with logit z. This unusual parameterization should be justified or corrected.
- [Sec. 3.1, Algorithm 1] The rejection step (line 21) halves p(s) for s in \hat{S}_m^k, but p(s) was initialized over majority training data S_T^M and used to sample majority points in line 5. The role of p(s) for synthetic minority samples is unclear.
- [Sec. 5.1] The comparison with SMOTified-GAN uses published results instead of running the method on the same infrastructure; this should be acknowledged in the experimental setup and considered when interpreting Table 2.
- [Sec. 5.2] The phrase 'Spambase's low F1 scores' is misleading, since 0.92 is among the highest reported in Table 2; the intended point is that MOODS did not surpass the best baseline.
- [Sec. 3.1] The typo 'optmization' appears in the paragraph describing the multi-objective bilevel approach.
- [Sec. 4.1] The notation z_w* = z_w*(x) is introduced but not used consistently; later definitions use z_w* without specifying dependence on x.
Circularity Check
The 'diversity driving F1' claim is partially circular: the metric's overlap term is exactly minority misclassification on the model output, and the epsilon/delta thresholds are fitted post hoc; the F1 comparisons themselves are still externally grounded.
-
renaming known result
[Sec. 4.2, Def. 4 (together with Def. 2)]
"Since for all x ∈ S, e^{zw*} = e^{1−zw*} ⇔ zw* = 1/2 (Def. 2), zw* = 1/2 is a clear choice for the minority/majority decision boundary. We use cSm ⊂ Sm to denote a set of overlapping minority points whose zw* values are on the majority (incorrect) side of zw* = 1/2 where cSm := { s = (x, 1) | zw* ≤ 1/2 }."
By Def. 2, the classifier output satisfies \hat f(s; zw*) = 0 iff zw* ≤ 1/2, so the set cSm is exactly the set of minority training points that the trained model misclassifies. The paper then calls this quantity 'minority zw* overlap' and uses it (Defs. 4–6, Sec. 5.3, Abstract) to conclude that 'improvement in diversity driving a 1−15% increase in F1 scores.' Because F1 is itself computed from the same classification rule, the overlap component is not an independent measure of feature-space overlap or diversity; it is a relabeling of minority misclassification. Moreover, the inner loop trains the model to minimize loss on S, so any reasonably balanced resampled set will tend to shrink this overlap even if the underlying feature distribution is unchanged.
-
fitted input called prediction
[Sec. 5.3]
"We attained five S26/1.7 training sets whose zw∗ minority overlap decreased by at least 26% and zw∗ variance increased by at least 1.7 orders of magnitude. Cut another way, MOODS attained four S52/0.7 ultimate training sets whose zw∗ minority overlap and variance improved by at least 52% and 0.7 orders of magnitude, respectively."
The thresholds 26/1.7 and 52/0.7 are not fixed before the experiments; they are selected after the runs to summarize the observed minima across datasets (e.g., Abalone's 26% overlap decrease and Connect4's 52%/0.7 values in Table 4). Consequently, saying MOODS 'attained' S26/1.7 or S52/0.7 is a post-hoc labeling of the results, not a test of a pre-specified criterion. Using these labels as evidence that the metric verifies MOODS's optimality (Table 4: 'Results for the ϵ/δ metric ... verify MOODS's ability to deliver optimal training data') reduces to fitting the metric's acceptability thresholds to the observed outcomes and then reporting the fit as a success.
full rationale
The paper's central empirical claim is not fully circular: MOODS is compared against seven external baselines on held-out test F1, and those F1 improvements are real measurements, not constructed from the metric. However, the paper's explanatory claim—that the 1–15% F1 gain is 'driven' by improved diversity and reduced overlap—is supported only by a metric whose overlap term is defined as minority misclassification (Def. 4 uses zw* ≤ 1/2, which by Def. 2 is exactly the misclassification condition), and whose variance term measures the spread of the same scalar logits used to compute F1. Since the upper-level objective directly maximizes minority and overall F1, the overlap decrease is largely a restatement of the trained model's improved minority classification rather than evidence about feature-space diversity. The thresholds in Def. 6 are also chosen post hoc, so the S26/1.7 and S52/0.7 labels describe the observed runs rather than test a prediction. The paper itself concedes in Sec. 3.1 that convergence and Pareto optimality are 'not yet confirmed,' which further weakens the 'optimal training set' claim but is a limitation rather than a circularity. No load-bearing self-citation chain is present; the comparisons to MUBO and others are external. Overall, the F1 numbers stand, but the diversity-causes-F1 interpretation is partially circular by construction, warranting a score of 6.
Assumptions & free parameters
free parameters (4)
- Initial majority sample count M0 =
ceil(0.5*|Sm|)
- SVM-SMOTE parameters =
not specified
- epsilon/delta thresholds =
26/1.7, 52/0.7 (reported post hoc)
- Neural network hyperparameters =
lr=1e-4, batch=32, layers 256-128-128
assumptions (4)
- domain assumption Model output zw*(x) is a faithful 1-D analog of feature vector x for measuring diversity and overlap
- domain assumption Increasing variance and reducing overlap of model outputs improves generalization and F1
- ad hoc to paper Stochastic gradient descent exactly solves the lower-level argmin problem
- domain assumption Validation F1 on a disjoint set is a reliable selector for test performance
invented entities (1)
-
epsilon/delta non-overlapping diversification metric
Cite this review
Pith. "Pith review of Sampling Imbalanced Data with Multi-objective Bilevel Optimization." pith.science (2026). https://pith.science/paper/RYVH2C5S
@misc{pith2026250611315,
  author       = {Pith},
  title        = {Pith review of: Sampling Imbalanced Data with Multi-objective Bilevel Optimization},
  year         = {2026},
  howpublished = {\url{https://pith.science/paper/RYVH2C5S}},
  note         = {Machine review of arXiv:2506.11315}
}
abstract
Two-class classification problems are often characterized by an imbalance between the number of majority and minority datapoints resulting in poor classification of the minority class in particular. Traditional approaches, such as reweighting the loss function or na\"ive resampling, risk overfitting and subsequently fail to improve classification because they do not consider the diversity between majority and minority datasets. Such consideration is infeasible because there is no metric that can measure the impact of imbalance on the model. To obviate these challenges, we make two key contributions. First, we introduce MOODS~(Multi-Objective Optimization for Data Sampling), a novel multi-objective bilevel optimization framework that guides both synthetic oversampling and majority undersampling. Second, we introduce a validation metric -- `$\epsilon/ \delta$ non-overlapping diversification metric' -- that quantifies the goodness of a sampling method towards model performance. With this metric we experimentally demonstrate state-of-the-art performance with improvement in diversity driving a $1-15 \%$ increase in $F1$ scores.
Figures


Figures from the paper (6 more)


Reference graph
Works this paper leans on
-
[1]
Md Manjurul Ahsan, Md Shahin Ali, and Zahed Siddique. Enhancing and improving the performance of imbalanced class data using novel GBO and SSG: A comparative analysis. Neural Networks: The Official Journal of the International Neural Network Society, 173:106157, May 2024
work page 2024
-
[2]
RN-SMOTE: Reduced Noise SMOTE based on DBSCAN for enhancing imbalanced data classification
Mohammed Badawy, Nawal El-Fishawy, Marwa Radad, and Ahmed H.Arafa. RN-SMOTE: Reduced Noise SMOTE based on DBSCAN for enhancing imbalanced data classification. Journal of King Saud Univ. - Computer and Information Sciences, 34, June 2022
work page 2022
-
[3]
Su-Yong Bae, Jonga Lee, Jaeseong Jeong, Changwon Lim, and Jinhee Choi. Effective data-balancing methods for class-imbalanced genotoxicity datasets using machine learning algorithms and molecular fingerprints. Computational Toxicology, 20:100178, November 2021
work page 2021
-
[4]
Gustavo E. A. P. A. Batista, Ronaldo C. Prati, and Maria Carolina Monard. A study of the behavior of several methods for balancing machine learning training data. SIGKDD Explor. Newsl., 6(1):20–29, June 2004
work page 2004
-
[5]
Christopher M. Bishop. Neural Networks for Pattern Recognition. Clarendon Press, Oxford, England, 1996
work page 1996
-
[6]
Addressing class imbalance in deep learning for small lesion detection on medical images
Alessandro Bria, Claudio Marrocco, and Francesco Tortorella. Addressing class imbalance in deep learning for small lesion detection on medical images. Computers in Biology and Medicine, 120:103735, May 2020. 10
work page 2020
-
[7]
Marwa Chabbouh, Slim Bechikh, Efrén Mezura-Montes, and Lamjed Ben Said. Imbalanced multi-label data classification as a bi-level optimization problem: application to miRNA-related diseases diagnosis. Neural Computing and Applications, 35:1–19, April 2023
work page 2023
-
[8]
Nadine Chang, Zhiding Yu, Yu-Xiong Wang, Anima Anandkumar, Sanja Fidler, and Jose M. Alvarez. Image-Level or Object-Level? A Tale of Two Resampling Strategies for Long-Tailed Detection, October
Show all 49 references
-
[9]
Enhancing Financial Fraud Detection through Addressing Class Imbalance Using Hybrid SMOTE-GAN Techniques
Patience Chew Yee Cheah, Yue Yang, and Boon Giin Lee. Enhancing Financial Fraud Detection through Addressing Class Imbalance Using Hybrid SMOTE-GAN Techniques. International Journal of Financial Studies, 11(3):110, September 2023. Number: 3 Publisher: Multidisciplinary Digital...
2023
-
[10]
Inverse Weight-Balancing for Deep Long-Tailed Learning
Wenqi Dang, Zhou Yang, Weisheng Dong, Xin Li, and Guangming Shi. Inverse Weight-Balancing for Deep Long-Tailed Learning. Proceedings of the AAAI Conference on Artificial Intelligence, 38(10):11713–11721, March 2024. Number: 10
2024
-
[11]
On Supervised Class-Imbalanced Learning: An Updated Perspective and Some Key Challenges.IEEE Transactions on Artificial Intelligence, 3(6):973–993, December 2022
Swagatam Das, Sankha Subhra Mullick, and Ivan Zelinka. On Supervised Class-Imbalanced Learning: An Updated Perspective and Some Key Challenges.IEEE Transactions on Artificial Intelligence, 3(6):973–993, December 2022
2022
-
[12]
The mnist database of handwritten digit images for machine learning research [best of the web]
Li Deng. The mnist database of handwritten digit images for machine learning research [best of the web]. IEEE Signal Processing Magazine, 29(6):141–142, 2012
2012
-
[13]
Leveraging GANs data augmentation for imbalanced medical image classification
Hongwei Ding, Nana Huang, and Xiaohui Cui. Leveraging GANs data augmentation for imbalanced medical image classification. Applied Soft Computing, 165:112050, November 2024
2024
-
[14]
Legan: Addressing intraclass imbalance in gan-based medical image augmentation for improved imbalanced data classification
Hongwei Ding, Nana Huang, Yaoxin Wu, and Xiaohui Cui. Legan: Addressing intraclass imbalance in gan-based medical image augmentation for improved imbalanced data classification. IEEE Transactions on Instrumentation and Measurement, 73:1–14, 2024
2024
-
[15]
Class-imbalanced semi-supervised learning with adaptive thresholding
Lan-Zhe Guo and Yu-Feng Li. Class-imbalanced semi-supervised learning with adaptive thresholding. In Proceedings of the 39th International Conference on Machine Learning, volume 162 of Proceedings of Machine Learning Research, pages 8082–8094, 2022
2022
-
[16]
Learning from class-imbalanced data: Review of methods and applications
Guo Haixiang, Li Yijing, Jennifer Shang, Gu Mingyun, Huang Yuanyue, and Gong Bing. Learning from class-imbalanced data: Review of methods and applications. Expert Systems with Applications , 73:220–239, May 2017
2017
-
[17]
Feature construction as a bi-level optimization problem
Marwa Hammami, Slim Bechikh, Ali Louati, Mohamed Makhlouf, and Lamjed Ben Said. Feature construction as a bi-level optimization problem. Neural Computing and Applications , 32(17):13783– 13804, September 2020
2020
-
[18]
Borderline-SMOTE: A New Over-Sampling Method in Imbalanced Data Sets Learning
Hui Han, Wen-Yuan Wang, and Bing-Huan Mao. Borderline-SMOTE: A New Over-Sampling Method in Imbalanced Data Sets Learning. In Advances in Intelligent Computing, volume 3644, pages 878–887. Springer Berlin Heidelberg, Berlin, Heidelberg, 2005
2005
-
[19]
Jeni, Jeffrey F
Laszlo A. Jeni, Jeffrey F. Cohn, and Fernando De La Torre. Facing Imbalanced Data–Recommendations for the Use of Performance Metrics. In 2013 Humaine Association Conference on Affective Computing and Intelligent Interaction, pages 245–251, Geneva, Switzerland, September 2013. IEEE
2013
-
[20]
Johnson and Taghi M
Justin M. Johnson and Taghi M. Khoshgoftaar. Survey on deep learning with class imbalance. Journal of Big Data, 6(1):27, March 2019
2019
-
[21]
A Survey of Deep Learning based Online Transactions Fraud Detection Systems
Kanika and Jimmy Singla. A Survey of Deep Learning based Online Transactions Fraud Detection Systems. In 2020 International Conference on Intelligent Engineering and Management (ICIEM), pages 130–136, June 2020
2020
-
[22]
The uci machine learning repository
Markelle Kelly, Rachel Longjohn, and Kolby Nottingham. The uci machine learning repository. https: //archive.ics.uci.edu, 2023
2023
-
[23]
Khan, Munawar Hayat, Mohammed Bennamoun, Ferdous A
Salman H. Khan, Munawar Hayat, Mohammed Bennamoun, Ferdous A. Sohel, and Roberto Togneri. Cost-Sensitive Learning of Deep Feature Representations From Imbalanced Data. IEEE Transactions on Neural Networks and Learning Systems, 29(8):3573–3587, August 2018
2018
-
[24]
Kingma and Jimmy Ba
Diederik P. Kingma and Jimmy Ba. Adam: A Method for Stochastic Optimization, January 2017. arXiv:1412.6980 [cs]
2017 arXiv
-
[25]
Deep learning-based imbalanced data classification for drug discovery
Selcuk Korkmaz. Deep learning-based imbalanced data classification for drug discovery. Journal of Chemical Information and Modeling, pages 4180–4190, 2020. 11
2020
-
[26]
An empirical comparison and evaluation of minority oversampling techniques on a large number of imbalanced datasets
György Kovács. An empirical comparison and evaluation of minority oversampling techniques on a large number of imbalanced datasets. Applied Soft Computing, 83:105662, October 2019
2019
-
[27]
Classification of Imbalanced Data:Review of Methods and Applications
Pradeep Kumar, Roheet Bhatnagar, Kuntal Gaur, and Anurag Bhatnagar. Classification of Imbalanced Data:Review of Methods and Applications. IOP Conference Series: Materials Science and Engineering, 1099(1):012077, March 2021
2021
-
[28]
AutoBalance: Optimized Loss Functions for Imbalanced Data, January 2022
Mingchen Li, Xuechen Zhang, Christos Thrampoulidis, Jiasi Chen, and Samet Oymak. AutoBalance: Optimized Loss Functions for Imbalanced Data, January 2022. arXiv:2201.01212 [cs]
2022 arXiv
-
[29]
DARTS: Differentiable Architecture Search, April
Hanxiao Liu, Karen Simonyan, and Yiming Yang. DARTS: Differentiable Architecture Search, April
-
[30]
A hybrid sampling method for highly imbalanced and overlapped data classification with complex distribution
Yansong Liu, Li Zhu, Lei Ding, He Sui, and Wenli Shang. A hybrid sampling method for highly imbalanced and overlapped data classification with complex distribution. Information Sciences, 661:120117, March 2024
2024
-
[31]
Scalable Gradient-Based Tuning of Continuous Regularization Hyperparameters, June 2016
Jelena Luketina, Mathias Berglund, Klaus Greff, and Tapani Raiko. Scalable Gradient-Based Tuning of Continuous Regularization Hyperparameters, June 2016. arXiv:1511.06727 [cs]
2016 arXiv
-
[32]
Ctgan-mos: Conditional generative adversarial network based minority-class-augmented oversampling scheme for imbalanced problems
Abdul Majeed and Seong Oun Hwang. Ctgan-mos: Conditional generative adversarial network based minority-class-augmented oversampling scheme for imbalanced problems. IEEE Access, 11, 2023
2023
-
[33]
An Experimental Study With Imbalanced Classification Approaches for Credit Card Fraud Detection
Sara Makki, Zainab Assaghir, Yehia Taher, Rafiqul Haque, Mohand-Said Hacid, and Hassan Zeineddine. An Experimental Study With Imbalanced Classification Approaches for Credit Card Fraud Detection. IEEE Access, 7:93010–93022, 2019
2019
-
[34]
A bilevel optimization framework for imbalanced data classification, 2024
Karen Medlin, Sven Leyffer, and Krishnan Raghavan. A bilevel optimization framework for imbalanced data classification, 2024. arXiv:2410.11171v2 [cs]
2024 arXiv
-
[35]
Nguyen, Eric W
Hien M. Nguyen, Eric W. Cooper, and Katsuari Kamei. Borderline over-sampling for imbalanced data classification. Int. J. Knowl. Eng. Soft Data Paradigm., 3(1):4–21, April 2011
2011
-
[36]
PyTorch: An Imperative Style, High-Performance Deep Learning Library, December 2019
Adam Paszke, Sam Gross, Francisco Massa, Adam Lerer, James Bradbury, Gregory Chanan, Trevor Killeen, Zeming Lin, Natalia Gimelshein, Luca Antiga, Alban Desmaison, Andreas Köpf, Edward Yang, Zach DeVito, Martin Raison, Alykhan Tejani, Sasank Chilamkurthy, Benoit Steiner, Lu Fan...
2019 arXiv
-
[37]
Radius- smote: A new oversampling technique of minority samples based on radius distance for learning from imbalanced data
Gede Angga Pradipta, Retantyo Wardoyo, Aina Musdholifah, and I Nyoman Hariyasa Sanjaya. Radius- smote: A new oversampling technique of minority samples based on radius distance for learning from imbalanced data. IEEE Access, 9:74763–74777, 2021
2021
-
[38]
Handling Imbalanced Classification Problems With Support Vector Machines via Evolutionary Bilevel Optimization.IEEE Transactions on Cybernetics, 53(8):4735–4747, August 2023
Alejandro Rosales-Pérez, Salvador García, and Francisco Herrera. Handling Imbalanced Classification Problems With Support Vector Machines via Evolutionary Bilevel Optimization.IEEE Transactions on Cybernetics, 53(8):4735–4747, August 2023. arXiv:2204.10231 [cs]
2023 arXiv
-
[39]
SMOTified-GAN for Class Imbal- anced Pattern Classification Problems
Anuraganand Sharma, Prabhat Kumar Singh, and Rohitash Chandra. SMOTified-GAN for Class Imbal- anced Pattern Classification Problems. IEEE Access, 10:30655–30665, 2022
2022
-
[40]
Credit Card Fraud Detection under Extreme Imbalanced Data: A Comparative Study of Data-level Algorithms
Amit Singh, Ranjeet Kumar Ranjan, and Abhishek Tiwari. Credit Card Fraud Detection under Extreme Imbalanced Data: A Comparative Study of Data-level Algorithms. Journal of Experimental & Theoretical Artificial Intelligence, 34(4):571–598, July 2022
2022
-
[41]
A multi-objective optimisation approach for class imbalance learning
Paolo Soda. A multi-objective optimisation approach for class imbalance learning. Pattern Recognition, 44(8):1801–1810, 2011
2011
-
[42]
Toward Robustness in Multi-label Classification: A Data Augmentation Strategy against Imbalance and Noise, December 2023
Hwanjun Song, Minseok Kim, and Jae-Gil Lee. Toward Robustness in Multi-label Classification: A Data Augmentation Strategy against Imbalance and Noise, December 2023. arXiv:2312.07087 [cs]
2023 arXiv
-
[43]
A Survey on GAN Techniques for Data Augmentation to Address the Imbalanced Data Issues in Credit Card Fraud Detection
Emilija Strelcenia and Simant Prakoonwit. A Survey on GAN Techniques for Data Augmentation to Address the Imbalanced Data Issues in Credit Card Fraud Detection. Machine Learning and Knowledge Extraction, 5(1):304–329, March 2023
2023
-
[44]
IMWMOTE: A novel oversampling technique for fault diagnosis in heterogeneous imbalanced data
Jiaxin Wang, Jianan Wei, Haisong Huang, Long Wen, Yage Yuan, Hualin Chen, Rui Wu, and Jinxing Wu. IMWMOTE: A novel oversampling technique for fault diagnosis in heterogeneous imbalanced data. Expert Systems with Applications, 251:123987, October 2024. 12
2024
-
[45]
A Diversity-Based Synthetic Oversampling Using Clustering for Handling Extreme Imbalance
Yuxuan Yang, Hadi Akbarzadeh Khorshidi, and Uwe Aickelin. A Diversity-Based Synthetic Oversampling Using Clustering for Handling Extreme Imbalance. SN Computer Science, 4(6):848, November 2023
2023
-
[46]
Learning from class-imbalanced data using misclassification-focusing generative adversarial networks
Jaesub Yun and Jong-Seok Lee. Learning from class-imbalanced data using misclassification-focusing generative adversarial networks. Expert Systems with Applications, 240:122288, April 2024
2024
-
[47]
Theory-Inspired Path-Regularized Differential Network Architecture Search
Pan Zhou, Caiming Xiong, Richard Socher, and Steven Chu Hong Hoi. Theory-Inspired Path-Regularized Differential Network Architecture Search. In Advances in Neural Information Processing Systems , volume 33, pages 8296–8307. Curran Associates, Inc., 2020. A Technical Appendices...
2020
-
[2019]
arXiv:1806.09055 [cs]
-
[2021]
arXiv:2104.05702 [cs]
Reviewed August 7, 2026 · model on record in the stance chip above.
Discussion (0). Continue with ORCID to comment.