REVIEW 5 major objections 5 minor 41 references
Synthetic Elastography using B-mode Ultrasound through a Deep Fully-Convolutional Neural Network
T0 review · 5 major / 5 minor · reviewed 2026-08-14 · deepseek-v4-flash
Pith's one-line read A deep network synthesizes shear-wave elastography images from B-mode ultrasound alone.
desk verdict A clean proof-of-principle that a U-Net can map B-mode prostate ultrasound to SWE-like stiffness maps, with honest limitations but an overstated error claim and a test set too small to carry the weight. read the letter →
The pith
A machine-rendered reading of the paper's core claim, the machinery that carries it, and where it could break.
The reading
What carries the argument
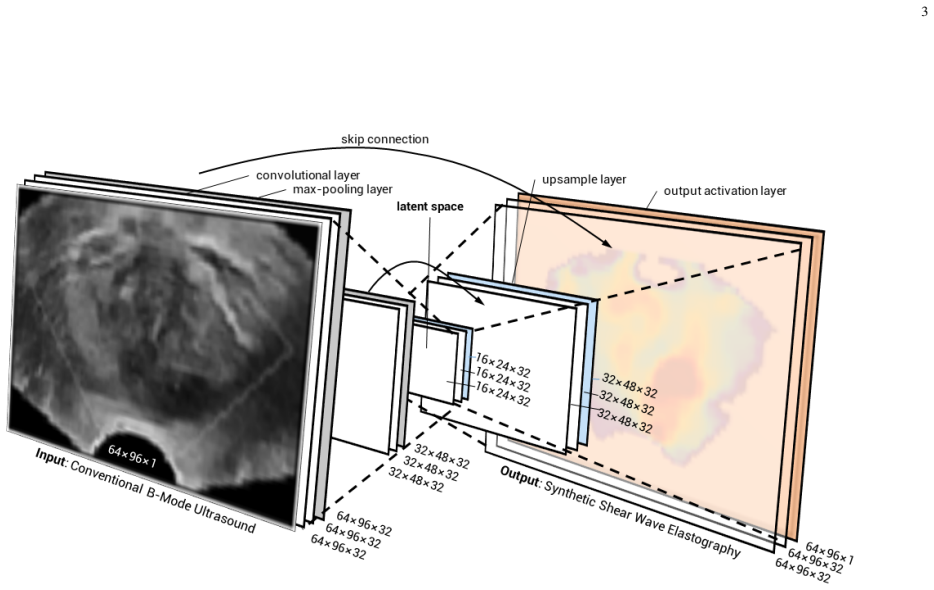
The central object is a U-net-like fully-convolutional encoder-decoder that maps $96\times64$-pixel B-mode images to normalized stiffness maps in one pass. The encoder compresses B-mode texture into a latent feature space through $3\times3$ convolutions, leaky ReLU activations, and max-pooling; the decoder mirrors this structure and up-samples back to image resolution, while direct skip connections from encoder to decoder layers let the network combine fine detail with coarse context. A sigmoid output layer maps the result to normalized Young's modulus, concentrating sensitivity in the clinically relevant range. Training minimizes root-mean-square error with the Adam optimizer, uses dropout and heavy data augmentation for regularization, and backpropagates loss only at pixels whose SWE confidence exceeds 0.75.
What would settle it
Acquire paired B-mode and SWE images in a new patient cohort using a different scanner or systematically varied gain settings, apply the already-trained network, and compare the synthetic map against the measured SWE; if the per-pixel mean absolute error rises well above 4.5 kPa or the location of stiff lesions shifts, the claimed B-mode-to-elasticity mapping is not robust.
Extended reading notes
Core claim
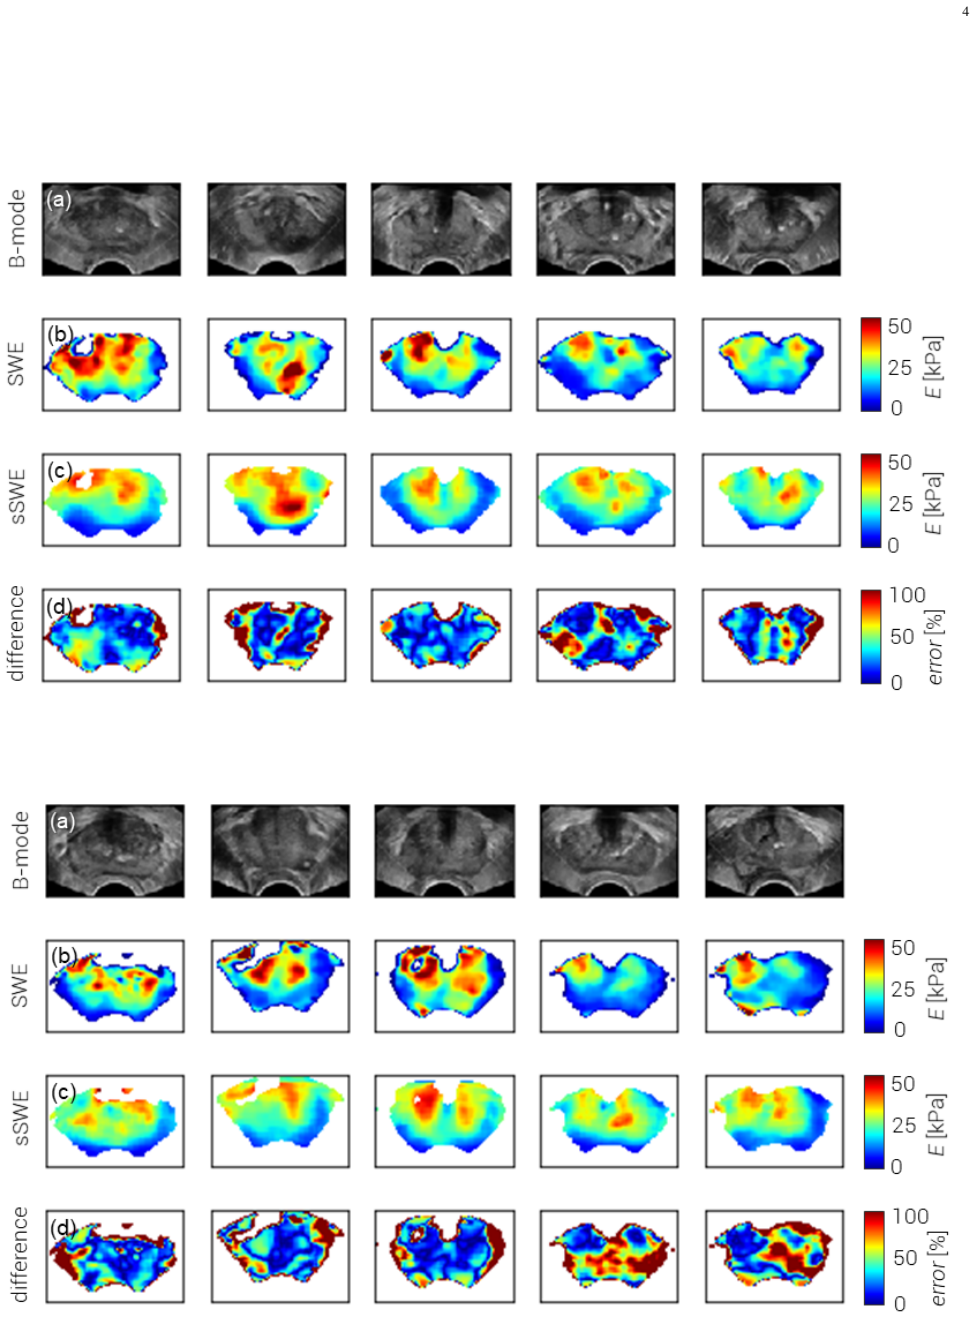
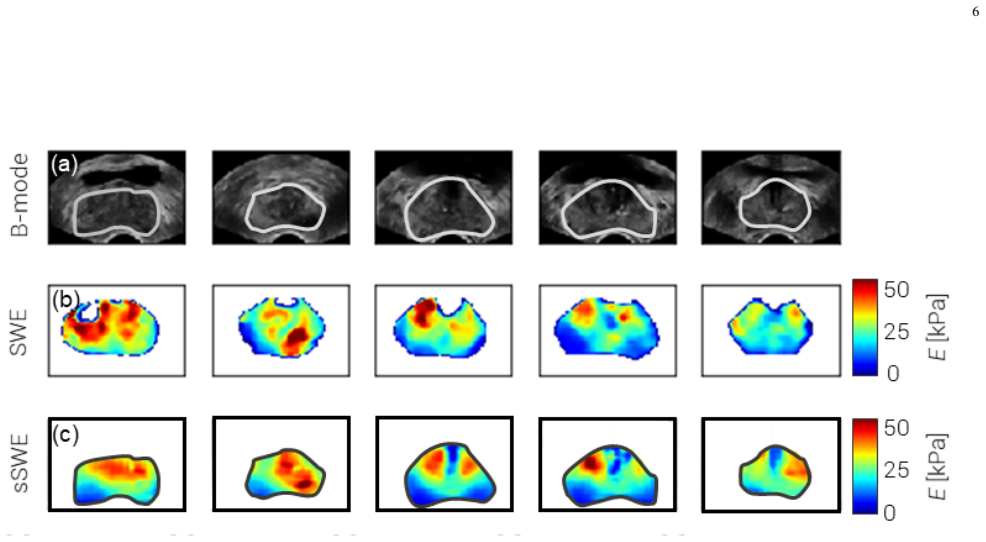
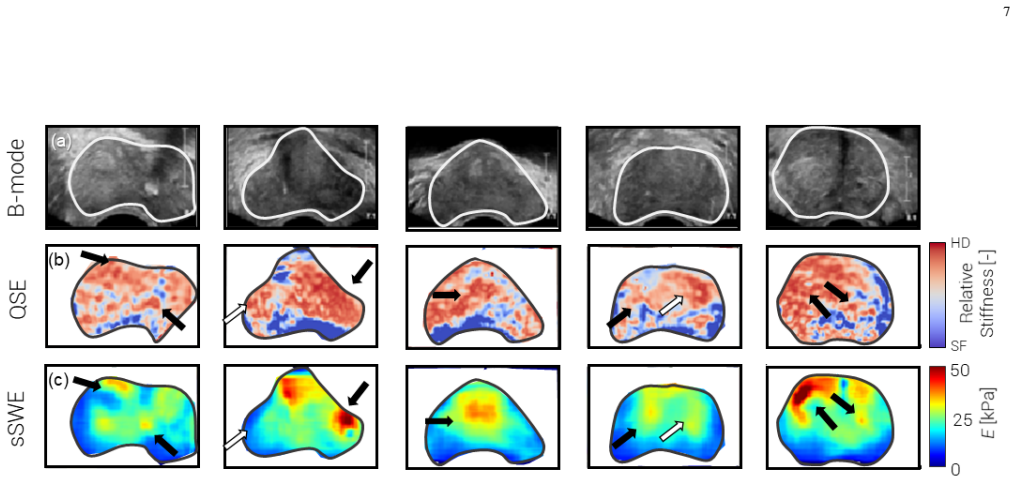
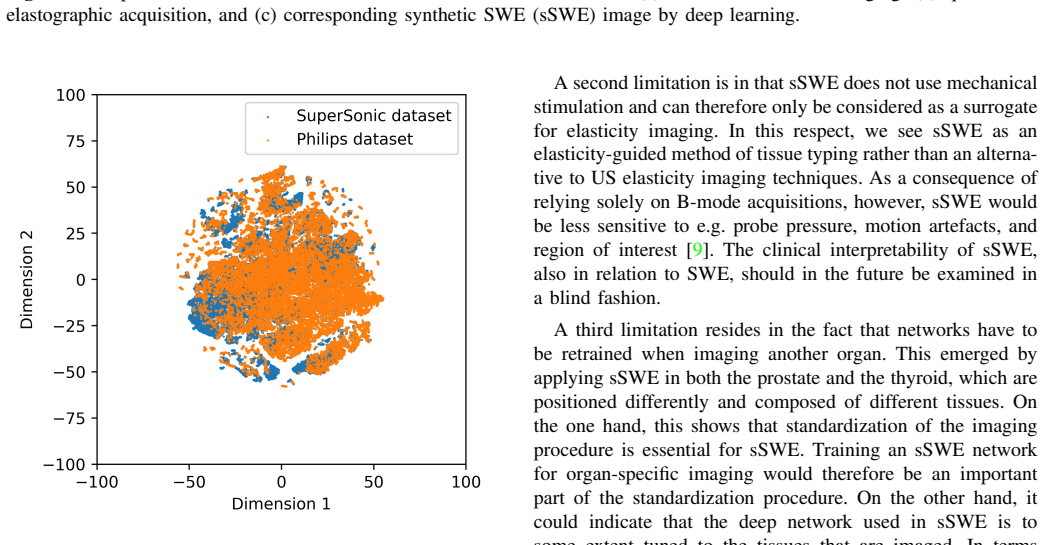
On the paper's own terms, the central discovery is that a U-net-like fully-convolutional encoder-decoder, trained end-to-end on aligned B-mode and shear-wave elastography images, learns a mapping from B-mode texture to Young's-modulus maps that generalizes to held-out patients. On a test set of 30 full-prostate images from 10 patients, the synthetic maps reach a pixel-wise mean absolute error of $4.5\pm0.96$ kPa and an RMSE of $8.8\pm1.7$ kPa, with a slight bias toward higher stiffness (mean error $-1.6\pm1.6$ kPa). Stiff regions that look like tumours on measured SWE are qualitatively preserved in the synthetic maps. Retraining the same architecture on thyroid data yields synthetic shear-wave-speed maps with a mean absolute error of $0.34\pm0.14$ m/s, and a t-SNE dimensionality-reduction visualization of the network's latent features shows substantial overlap between two scanners, suggesting the learned features are not tied to one machine.
Load-bearing premise
The load-bearing premise is that the side-by-side B-mode and shear-wave elastography images are accurately aligned after the described alignment and regridding, so the reported 4.5 kPa error measures the mapping's error rather than alignment error.
Editorial extensions
If this is right
- Since sSWE uses only B-mode input, ultrasound systems without SWE hardware could offer stiffness-like imaging after deploying the trained network.
- The thyroid results show the method is organ-specific but transferable: the same architecture, retrained, produces useful synthetic maps in a different tissue type.
- The latent-feature overlap across two scanners suggests the learned mapping is at least partly machine-independent, so cross-scanner deployment may require only light adaptation rather than full retraining.
- Because sSWE is computed from B-mode alone, it would be insensitive to SWE-specific artefacts from probe pressure, motion, and shear-wave voids, and could be generated from already-stored B-mode images.
- The model's slight bias toward higher stiffness (mean error $-1.6\pm1.6$ kPa) would matter in any clinical threshold application.
Reading between the lines
- If the mapping holds across acquisition protocols, sSWE could be applied retrospectively to historical B-mode-only datasets, producing elasticity estimates where no SWE was ever acquired.
- The decisive clinical test is lesion-level, not pixel-level: comparing sSWE-identified stiff regions against whole-mount histology would settle whether a 4.5 kPa mean absolute error is good enough for cancer detection.
- A domain-adaptation layer trained on a small amount of data from a new scanner could reduce the retraining burden the paper identifies, since its t-SNE results suggest the feature spaces of different scanners already overlap heavily.
- The reported error should be read relative to the stiffness contrast of prostate cancer; whether 4.5 kPa is acceptable depends on where a clinician would set the decision threshold, not on the pixel metric alone.
Signed reviews
Editorial analysis
A structured set of objections, weighed in public.
Referee Report
Summary. The paper proposes a fully convolutional U-Net that synthesizes shear-wave elastography (SWE) images from B-mode ultrasound, trained on side-by-side B-mode/SWE recordings from 50 prostate cancer patients. On a held-out test set of 30 full-prostate images from 10 patients, the method achieves a pixel-wise MAE of 4.5±0.96 kPa, RMSE of 8.8±1.7 kPa, and ME of -1.6±1.6 kPa. The paper additionally reports an augmentation ablation, a qualitative generalization to full-screen B-mode images, a t-SNE analysis suggesting scanner-independent features, a qualitative comparison with quasi-static elastography on a non-SWE device, and a separately trained thyroid SWE network. The authors acknowledge limitations including small dataset size, need for organ-specific retraining, and the requirement for standardized acquisition protocols.
Significance. If the quantitative claim holds, the work is useful because it suggests that conventional B-mode ultrasound, available on low-end systems, may provide SWE-like elasticity information without specialized shear-wave hardware. The study has several genuine methodological strengths: the patient-level train/test split ensures that the reported MAE is a real prediction on unseen patients rather than a re-fit; the augmentation ablation is evaluated with paired tests; and the inclusion of a second scanner and a second organ provides an honest probe of generalizability. However, the central quantitative claim depends on an unvalidated image-alignment step, and the interpretation of the MAE is not calibrated against baselines or SWE repeatability. The current evidence therefore supports a proof-of-concept but not yet a quantitative equivalence between B-mode-derived and measured elasticity.
major comments (5)
- [II-A] The pixel-wise MAE/RMSE evaluation presupposes that the B-mode and SWE panels are accurately co-registered before the 96×64 regridding, but the alignment step is described only as 'alignment of the side-by-side B-mode and SWE data' and is never validated. After downsampling to a 96×64 grid from 600×400 pixels, a 1–2 pixel misregistration can shift stiffness values across tissue boundaries by several kPa, in which case the reported 4.5±0.96 kPa MAE would partly measure alignment error rather than the B-mode-to-elasticity mapping. Please specify the registration method, quantify residual registration error, and provide a sensitivity analysis (e.g., perturbing alignment and recomputing MAE) or use an evaluation metric that tolerates small misalignments.
- [IV (Discussion)] The statement that a pixel-wise MAE of 4.5±0.96 kPa corresponds to 'less than 10% deviation in the clinically-relevant elasticity range of 0–70 kPa' is an overstatement. MAE is an average absolute error over all pixels; for the many pixels with stiffness below 10 kPa, a 4.5 kPa error exceeds 45% relative error, and the 10% figure only arises if one interprets MAE as a fraction of the full 70 kPa display range. Please report relative errors stratified by stiffness, or qualify the claim as 'about 6% of the display range' rather than 'less than 10% deviation'.
- [II-D / III] The evaluation contains no baseline or repeatability comparison, so the clinical meaning of the reported MAE is unclear. A trivial predictor such as the per-patient mean SWE image could achieve a similar pixel-wise MAE if elastograms are spatially smooth, and the intrinsic test-retest or inter-operator variability of SWE in this acquisition protocol is not reported. Please add at least one baseline (constant/mean image, B-mode intensity, or a classical image-regression method) and, if possible, an SWE repeatability measurement on the same patients to calibrate the 4.5 kPa figure.
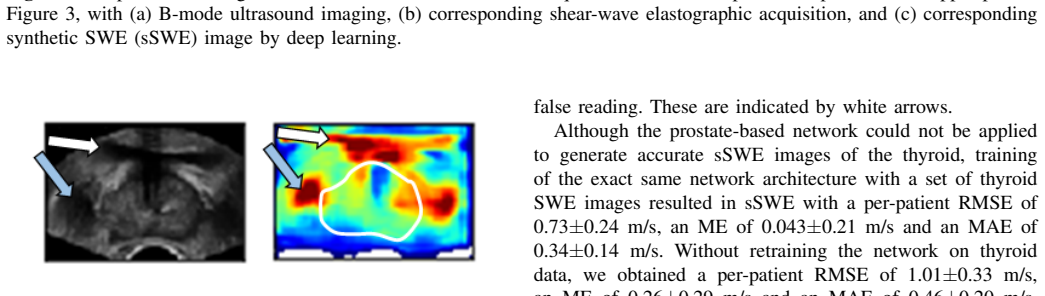
- [III (Figure 4)] The generalization to full-screen B-mode acquisitions obtained outside the SWE module is supported only qualitatively. Because the network is trained on side-by-side panels, it could in principle exploit the fixed spatial offset between the B-mode and SWE fields; the full-screen examples in Figure 4 do not provide a quantitative check of this. Please add a quantitative evaluation on full-screen images with manual or registered ROIs, even for a small number of cases, or explicitly limit the claim to a qualitative demonstration.
- [II-D / III] The test set comprises 30 images from only 10 patients, and the reported standard deviations and paired t-tests are based on that small sample. While this is acknowledged as preliminary, the headline accuracy should be presented with patient-level error ranges and the exact number of paired observations for the augmentation comparison; otherwise the 4.5±0.96 kPa figure conveys a precision that a 10-patient sample cannot support.
minor comments (5)
- [II-B] The phrase 'combine fine and course level information' contains a typo; 'course' should be 'coarse'.
- [II-C] The data-augmentation sentence ends with a duplicated period after 'axially' ('axially..'); remove the extra period.
- [Figures 3 and 8] The percentage error maps are dominated by low-stiffness pixels; showing absolute kPa error or masking low-confidence regions would make the spatial error distribution more interpretable.
- [II-A] The phrase 'cyclic manual pressure asserted by the ultrasound operator' should likely be 'applied by the ultrasound operator' or 'exerted by the ultrasound operator'.
- [III (Figure 7)] The t-SNE overlap is interpreted as indicating scanner independence, but t-SNE is sensitive to hyperparameters and the overlap is not quantified; a quantitative domain-shift measure would strengthen this claim.
Circularity Check
No significant circularity: the headline accuracy is measured on a held-out patient test set, and the derivation is a standard supervised regression.
full rationale
The central claim, that sSWE images can be generated from B-mode with a pixel-wise MAE of 4.5±0.96 kPa, is evaluated on a held-out test set of 10 patients (30 images) that was not used for training or validation, so the metric is a genuine prediction rather than a refit of training data. The network is trained by minimizing RMSE (Eq. 1) and evaluated with MAE (Eq. 2), which are standard independent supervised-learning quantities. Hyperparameters were selected on a validation subset drawn from the training patients, which is normal model selection and does not compromise the held-out test result. Self-citations appear only for acquisition protocol, prior clinical examination of SWE images, and related methodological context; none is load-bearing for the derivation or invoked as a uniqueness theorem or to force the network design. The alignment of side-by-side B-mode and SWE panels is a potential validation concern, but it is not a circularity: the paper does not define the prediction in terms of the target or fit the test metric. No equation, construction, or self-citation chain reduces the reported result to its own inputs.
Assumptions & free parameters
free parameters (5)
- DCNN weights =
158,177 trainable parameters
- Confidence threshold =
0.75
- Normalization constants =
100 kPa (prostate), 10 m/s (thyroid)
- Data augmentation parameters =
90% of mini-batch; 5% crop; 50% contrast; 10 deg rotation; 50% lateral / 10% axial translation
- Architecture hyperparameters =
batch size 64, 2100 epochs, encoder with 4 conv + 2 pooling layers
assumptions (5)
- domain assumption B-mode echogenicity and tissue elasticity are linked through their common dependence on underlying tissue structure
- domain assumption SWE provides an accurate, operator-independent estimate of Young's modulus and shear-wave speed
- domain assumption Side-by-side B-mode and SWE images are accurately co-registered after alignment and regridding
- domain assumption The patient-level train/test split yields independent samples
- standard math Adam optimization and U-Net architecture are valid tools for this regression task
Cite this review
Pith. "Pith review of Synthetic Elastography using B-mode Ultrasound through a Deep Fully-Convolutional Neural Network." pith.science (2026). https://pith.science/paper/S2LKWVRW
@misc{pith2026190803573,
  author       = {Pith},
  title        = {Pith review of: Synthetic Elastography using B-mode Ultrasound through a Deep Fully-Convolutional Neural Network},
  year         = {2026},
  howpublished = {\url{https://pith.science/paper/S2LKWVRW}},
  note         = {Machine review of arXiv:1908.03573}
}
read the original abstract
Shear-wave elastography (SWE) permits local estimation of tissue elasticity, an important imaging marker in biomedicine. This recently-developed, advanced technique assesses the speed of a laterally-travelling shear wave after an acoustic radiation force "push" to estimate local Young's moduli in an operator-independent fashion. In this work, we show how synthetic SWE (sSWE) images can be generated based on conventional B-mode imaging through deep learning. Using side-by-side-view B-mode/SWE images collected in 50 patients with prostate cancer, we show that sSWE images with a pixel-wise mean absolute error of 4.5+/-0.96 kPa with regard to the original SWE can be generated. Visualization of high-level feature levels through t-Distributed Stochastic Neighbor Embedding reveals substantial overlap between data from two different scanners. Qualitatively, we examined the use of the sSWE methodology for B-mode images obtained with a scanner without SWE functionality. We also examined the use of this type of network in elasticity imaging in the thyroid. Limitations of the technique reside in the fact that networks have to be retrained for different organs, and that the method requires standardization of the imaging settings and procedure. Future research will be aimed at development of sSWE as an elasticity-related tissue typing strategy that is solely based on B-mode ultrasound acquisition, and the examination of its clinical utility.
Figures

Figures from the paper (5 more)

Reference graph
Works this paper leans on
-
[1]
Ultrasound elastography of the prostate: State of the art,
J.-M. Correas, A.-M. Tissier, A. Khairoune, G. Khoury, D. Eiss, and O. H ´el´enon, “Ultrasound elastography of the prostate: State of the art,” Diagnostic and Interventional Imaging, vol. 94, no. 5, pp. 551–560, may 2013
work page 2013
-
[2]
F. Sebag, J. Vaillant-Lombard, J. Berbis, V . Griset, J. F. Henry, P. Petit, and C. Oliver, “Shear Wave Elastography: A New Ultrasound Imaging Mode for the Differential Diagnosis of Benign and Malignant Thyroid Nodules,” The Journal of Clinical Endocrinology & Metabolism, vol. 95, no. 12, pp. 5281–5288, dec 2010
work page 2010
-
[3]
Shear wave liver elastography,
R. G. Barr, “Shear wave liver elastography,” Abdominal Radiology , vol. 43, no. 4, pp. 800–807, 2018
work page 2018
-
[4]
J. M. Chang, W. K. Moon, N. Cho, A. Yi, H. R. Koo, W. Han, D.-Y . Noh, H.-G. Moon, and S. J. Kim, “Clinical application of shear wave elastography (SWE) in the diagnosis of benign and malignant breast diseases,” Breast Cancer Research and Treatment , vol. 129, no. 1, pp. 89–97, 2011
work page 2011
-
[5]
Shear-Wave Elastography: Ba- sic Physics and Musculoskeletal Applications,
M. S. Taljanovic, L. H. Gimber, G. W. Becker, L. D. Latt, A. S. Klauser, D. M. Melville, L. Gao, and R. S. Witte, “Shear-Wave Elastography: Ba- sic Physics and Musculoskeletal Applications,” RadioGraphics, vol. 37, no. 3, pp. 855–870, may 2017
work page 2017
-
[6]
Ultrasound elastography: review of techniques and clinical applications,
R. M. S. Sigrist, J. Liau, A. El Kaffas, M. C. Chammas, and J. K. Willmann, “Ultrasound elastography: review of techniques and clinical applications,” Theranostics, vol. 7, no. 5, p. 1303, 2017
work page 2017
-
[7]
Ultrasound elastography: Principles and techniques,
J.-L. Gennisson, T. Deffieux, M. Fink, and M. Tanter, “Ultrasound elastography: Principles and techniques,” Diagnostic and Interventional Imaging, vol. 94, no. 5, pp. 487–495, 2013
work page 2013
-
[8]
Acoustic Radiation Force Impulse (ARFI) Imaging: a Review,
K. Nightingale, “Acoustic Radiation Force Impulse (ARFI) Imaging: a Review,” Current medical imaging reviews , vol. 7, no. 4, pp. 328–339, nov 2011
work page 2011
Show all 41 references
-
[9]
Artifacts and Technical Restrictions in 2D Shear Wave Elastography TT - Artefakte und technische Einschr ¨ankungen bei der 2D-Scherwellen-Elastografie,
P. Bouchet, J.-L. Gennisson, A. Podda, M. Alilet, M. Carri ´e, and S. Aubry, “Artifacts and Technical Restrictions in 2D Shear Wave Elastography TT - Artefakte und technische Einschr ¨ankungen bei der 2D-Scherwellen-Elastografie,” Ultraschall in Med , no. EFirst, 2018
2018
-
[10]
Shear wave elasticity imaging: a new ultrasonic technology of medical diagnostics,
A. P. Sarvazyan, O. V . Rudenko, S. D. Swanson, J. Fowlkes, and S. Y . Emelianov, “Shear wave elasticity imaging: a new ultrasonic technology of medical diagnostics,” Ultrasound in Medicine & Biology , vol. 24, no. 9, pp. 1419–1435, 1998
1998
-
[11]
A deep learning frame- work for single sided sound speed inversion in medical ultrasound,
M. Feigin, D. Freedman, and B. W. Anthony, “A deep learning frame- work for single sided sound speed inversion in medical ultrasound,” arXiv preprint arXiv:1810.00322 , 2018
2018 arXiv
-
[12]
Direct reconstruction of ultrasound elastography using an end-to-end deep neural network,
S. Wu, Z. Gao, Z. Liu, J. Luo, H. Zhang, and S. Li, “Direct reconstruction of ultrasound elastography using an end-to-end deep neural network,” in International Conference on Medical Image Computing and Computer- Assisted Intervention. Springer, 2018, pp. 374–382
2018
-
[13]
GLUENet: Ultrasound Elastography Using Convolutional Neural Network BT - Simulation, Image Processing, and Ultrasound Systems for Assisted Diagnosis and Navigation
M. G. Kibria and H. Rivaz, “GLUENet: Ultrasound Elastography Using Convolutional Neural Network BT - Simulation, Image Processing, and Ultrasound Systems for Assisted Diagnosis and Navigation.” Cham: Springer International Publishing, 2018, pp. 21–28
2018
-
[14]
SHEAR-net: An End-to-End Deep Learning Approach for Single Push Ultrasound Shear Wave Elasticity Imaging,
T. Ahmed and M. Hasan, “SHEAR-net: An End-to-End Deep Learning Approach for Single Push Ultrasound Shear Wave Elasticity Imaging,” arXiv preprint arXiv:1902.04845 , 2019
1902 arXiv
-
[15]
C. K. Mannaerts, R. R. Wildeboer, A. W. Postema, J. Hagemann, L. Bud ¨aus, D. Tilki, M. Mischi, H. Wijkstra, and G. Salomon, “Multi- parametric ultrasound: evaluation of greyscale, shear wave elastography and contrast-enhanced ultrasound for prostate cancer detection and local...
2018
-
[16]
U-net: Convolutional networks for biomedical image segmentation,
O. Ronneberger, P. Fischer, and T. Brox, “U-net: Convolutional networks for biomedical image segmentation,” International Conference on Med- ical image computing and computer-assisted intervention , vol. 18, pp. 234–241, 2015
2015
-
[17]
Segnet: A deep con- volutional encoder-decoder architecture for image segmentation,
V . Badrinarayanan, A. Kendall, and R. Cipolla, “Segnet: A deep con- volutional encoder-decoder architecture for image segmentation,” IEEE transactions on pattern analysis and machine intelligence , vol. 39, no. 12, pp. 2481–2495, 2017
2017
-
[18]
Learning deconvolution network for semantic segmentation,
H. Noh, S. Hong, and B. Han, “Learning deconvolution network for semantic segmentation,” in Proceedings of the IEEE international con- ference on computer vision , 2015, pp. 1520–1528
2015
-
[19]
MRbased synthetic CT generation using a deep convolutional neural network method,
X. Han, “MRbased synthetic CT generation using a deep convolutional neural network method,” Medical physics, vol. 44, no. 4, pp. 1408–1419, 2017
2017
-
[20]
Rectifier nonlinearities im- prove neural network acoustic models,
A. L. Maas, A. Y . Hannun, and A. Y . Ng, “Rectifier nonlinearities im- prove neural network acoustic models,” in30 th International Conference on Machine Learning , Atlanta, Georgia, 2013
2013
-
[21]
Unsuper- vised learning of invariant feature hierarchies with applications to object recognition
F.-J. H. Marc’Aurelio Ranzato, Y .-L. Boureau, and Y . LeCun, “Unsuper- vised learning of invariant feature hierarchies with applications to object recognition.”
-
[22]
The influence of the sigmoid function parameters on the speed of backpropagation learning,
J. Han and C. Moraga, “The influence of the sigmoid function parameters on the speed of backpropagation learning,” in International Workshop on Artificial Neural Networks . Springer, 1995, pp. 195–201
1995
-
[23]
Stiffness of benign and malignant prostate tissue measured by shear-wave elastography: a preliminary study,
O. Rouvi `ere, C. Melodelima, A. Hoang Dinh, F. Bratan, G. Pagnoux, T. Sanzalone, S. Crouzet, M. Colombel, F. M `ege-Lechevallier, and R. Souchon, “Stiffness of benign and malignant prostate tissue measured by shear-wave elastography: a preliminary study,” European Radiology, ...
2017
-
[24]
Ultrasound elastography of the thyroid: principles and current status,
C.-K. Zhao and H.-X. Xu, “Ultrasound elastography of the thyroid: principles and current status,” Ultrasonography, vol. 38, no. 2, p. 106, 2019
2019
-
[25]
Adam: A method for stochastic optimization,
D. P. Kingma and J. Ba, “Adam: A method for stochastic optimization,” arXiv preprint arXiv:1412.6980 , 2014
2014 arXiv
-
[26]
Importance sampling for minibatches,
D. Csiba and P. Richt ´arik, “Importance sampling for minibatches,” The Journal of Machine Learning Research , vol. 19, no. 1, pp. 962–982, 2018
2018
-
[27]
Imagenet classification with deep convolutional neural networks,
A. Krizhevsky, I. Sutskever, and G. E. Hinton, “Imagenet classification with deep convolutional neural networks,” in Advances in neural infor- mation processing systems , 2012, pp. 1097–1105
2012
-
[28]
Dropout: a simple way to prevent neural networks from over- fitting,
N. Srivastava, G. Hinton, A. Krizhevsky, I. Sutskever, and R. Salakhut- dinov, “Dropout: a simple way to prevent neural networks from over- fitting,” The Journal of Machine Learning Research , vol. 15, no. 1, pp. 1929–1958, 2014
1929
-
[29]
Visualizing data using t-SNE,
L. van der Maaten and G. Hinton, “Visualizing data using t-SNE,” Journal of machine learning research , vol. 9, no. Nov, pp. 2579–2605, 2008
2008
-
[30]
Estimating CT image from MRI data using structured random forest and auto-context model,
T. Huynh, Y . Gao, J. Kang, L. Wang, P. Zhang, J. Lian, and D. Shen, “Estimating CT image from MRI data using structured random forest and auto-context model,”IEEE transactions on medical imaging, vol. 35, no. 1, pp. 174–183, 2016
2016
-
[31]
Deep MR to CT synthesis using unpaired data,
J. M. Wolterink, A. M. Dinkla, M. H. F. Savenije, P. R. Seevinck, C. A. T. van den Berg, and I. I ˇsgum, “Deep MR to CT synthesis using unpaired data,” in International Workshop on Simulation and Synthesis in Medical Imaging. Springer, 2017, pp. 14–23
2017
-
[32]
Deep ct to mr synthesis using paired and unpaired data,
C.-B. Jin, W. Jung, S. Joo, E. Park, A. Y . Saem, I. H. Han, J. I. Lee, and X. Cui, “Deep ct to mr synthesis using paired and unpaired data,” arXiv preprint arXiv:1805.10790 , 2018
2018 arXiv
-
[33]
Accuracy of shear wave elastography for the diagnosis of prostate cancer: A meta-analysis,
L. Sang, X.-M. Wang, D.-Y . Xu, and Y .-F. Cai, “Accuracy of shear wave elastography for the diagnosis of prostate cancer: A meta-analysis,” Scientific reports, vol. 7, no. 1, p. 1949, may 2017
1949
-
[34]
Comparison of image-guided targeted biopsies versus systematic randomized biopsies in the detection of prostate cancer: a systematic literature review of well-designed studies,
A. van Hove, P.-H. Savoie, C. Maurin, S. Brunelle, G. Gravis, N. Salem, and J. Walz, “Comparison of image-guided targeted biopsies versus systematic randomized biopsies in the detection of prostate cancer: a systematic literature review of well-designed studies,” World journal...
2014
-
[35]
C. K. Mannaerts, R. R. Wildeboer, S. Remmers, R. A. van Kollenburg, A. Kajtazovic, J. Hagemann, A. W. Postema, R. J. van Sloun, M. Roobol, D. Tilki, M. Mischi, H. Wijkstra, and G. Salomon, “Multiparametric ultrasound for prostate cancer detection and localization: Correlation ...
2019
-
[36]
Deep visual domain adaptation: A survey,
M. Wang and W. Deng, “Deep visual domain adaptation: A survey,” Neurocomputing, vol. 312, pp. 135–153, 2018
2018
-
[37]
Viscoelasticity Mapping by Identification of Local Shear Wave Dynamics,
R. van Sloun, R. Wildeboer, H. Wijkstra, and M. Mischi, “Viscoelasticity Mapping by Identification of Local Shear Wave Dynamics,” IEEE Transactions on Ultrasonics, Ferroelectrics, and Frequency Control , vol. 64, no. 11, pp. 1666–1673, 2017
2017
-
[38]
Quantitative Characterization of Viscoelastic Properties of Human Prostate Correlated with Histology,
M. Zhang, P. Nigwekar, B. Castaneda, K. Hoyt, J. V . Joseph, A. di Sant’Agnese, E. M. Messing, J. G. Strang, D. J. Rubens, and K. J. Parker, “Quantitative Characterization of Viscoelastic Properties of Human Prostate Correlated with Histology,” Ultrasound in Medicine & Biology...
2008
-
[39]
Accurate vali- dation of ultrasound imaging of prostate cancer: a review of challenges in registration of imaging and histopathology,
R. R. Wildeboer, R. J. G. van Sloun, A. W. Postema, C. K. Mannaerts, M. Gayet, H. P. Beerlage, H. Wijkstra, and M. Mischi, “Accurate vali- dation of ultrasound imaging of prostate cancer: a review of challenges in registration of imaging and histopathology,” Journal of Ultraso...
2018
-
[40]
R. J. van Sloun, R. R. Wildeboer, C. K. Mannaerts, A. W. Postema, M. Gayet, H. P. Beerlage, G. Salomon, H. Wijkstra, and M. Mischi, “Deep Learning for Real-time, Automatic, and Scanner-adapted Prostate (Zone) Segmentation of Transrectal Ultrasound, for Example, Magnetic Resona...
2019
-
[41]
Computer-Aided Detection and diagnosis for prostate cancer based on mono and multi-parametric MRI: A review,
G. Lema ˆıtre, R. Mart´ı, J. Freixenet, J. C. Vilanova, P. M. Walker, and F. Meriaudeau, “Computer-Aided Detection and diagnosis for prostate cancer based on mono and multi-parametric MRI: A review,” Computers in Biology and Medicine , vol. 60, pp. 8–31, may 2015
2015
Reviewed August 14, 2026 · model on record in the stance chip above.
Discussion (0). Continue with ORCID to comment.