REVIEW 4 major objections 3 minor 35 references
Landmark Map: An Extension of the Self-Organizing Map for a User-Intended Nonlinear Projection
T0 review · 4 major / 3 minor · reviewed 2026-08-14 · deepseek-v4-flash
Pith's one-line read The landmark map extends the self-organizing map so that a few user-chosen data-to-node pairs steer the projection toward a designated semantic layout.
desk verdict Genuinely new SOM extension, but the landmark-retention claim is undercut by the paper's own convergence plots and the evaluation is mostly qualitative. read the letter →
The pith
A machine-rendered reading of the paper's core claim, the machinery that carries it, and where it could break.
The reading
What carries the argument
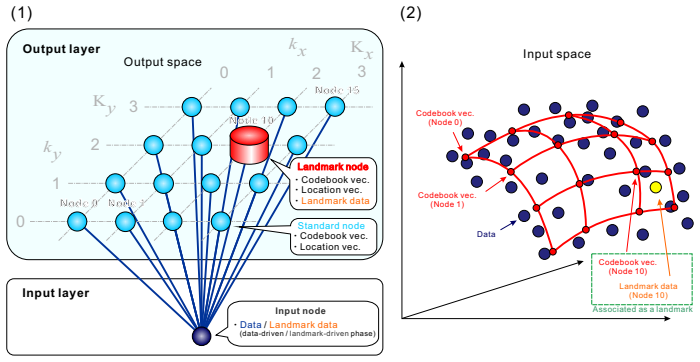
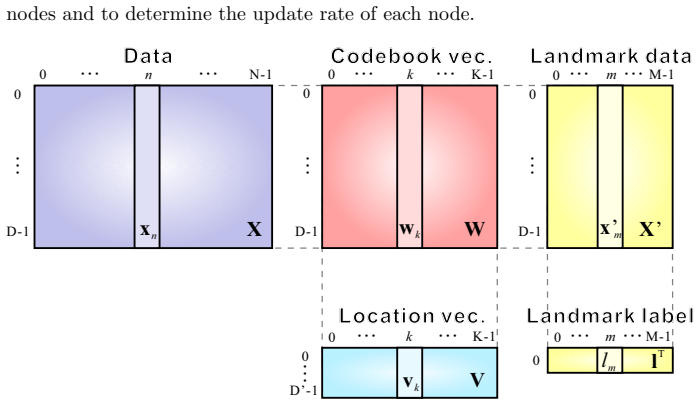
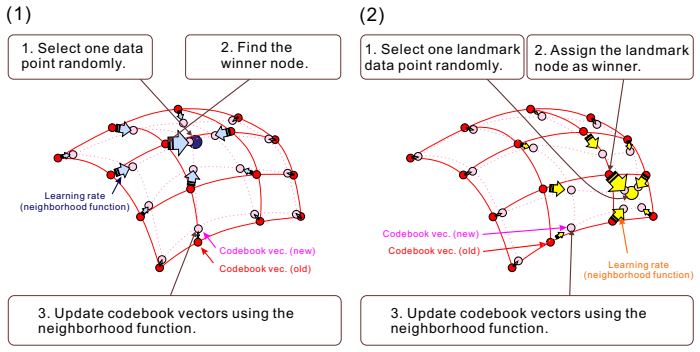
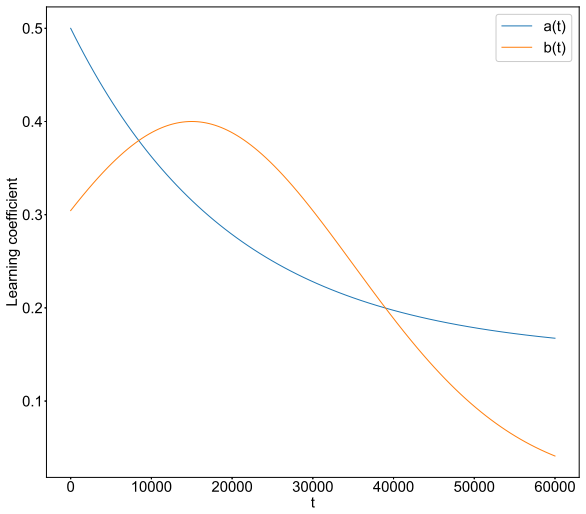
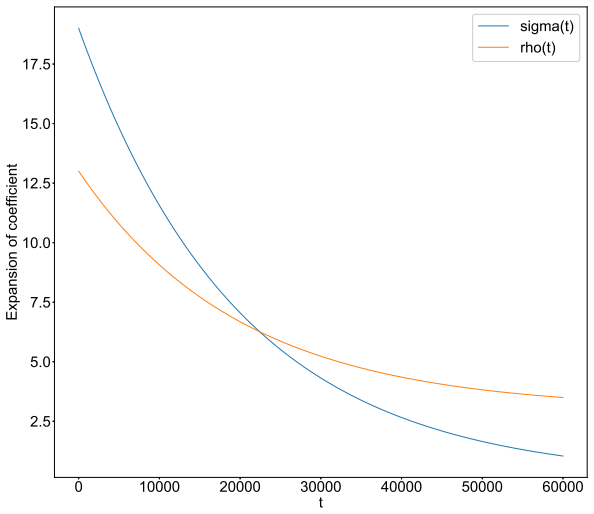
The load-bearing mechanism is the alternating update with two independent neighborhood functions. A landmark node is an output-grid node with a location vector $v_k$ and a reference vector $w_k$ that is paired to a landmark data point $x'_m$. In the landmark-driven phase, winner selection is overridden ($k_l(m)=l_m$), so the update is $w_k \leftarrow w_k + \beta_k(t)(x'_m-w_k)$ with $\beta_k(t)=b(t)\exp(-\|v_{k_l}-v_k\|^2/2\rho^2(t))$; here $b(t)$ is a Gaussian over training time with a peak at $t_{\rm center}$. This pulls the designated codebook vector toward its landmark data and, more weakly, pulls output-space neighbors toward that data, bending the input-space mesh without tearing its adjacency.
What would settle it
Run LAMA many times on the artificial formant dataset with the paper's landmarks, but with a grid search over $p_{\rm th}$, $b_{\min}$, $b_{\max}$, $t_{\rm center}$, $\rho_b$, $\rho_{\min}$, and $\rho_{\max}$; if every configuration that drives the landmark quantization error near zero also produces a wrinkled or self-intersecting mesh, with square topographic error well above the plain SOM's, then user-intended projections are not reliably attainable at the claimed level of generality.
Extended reading notes
Core claim
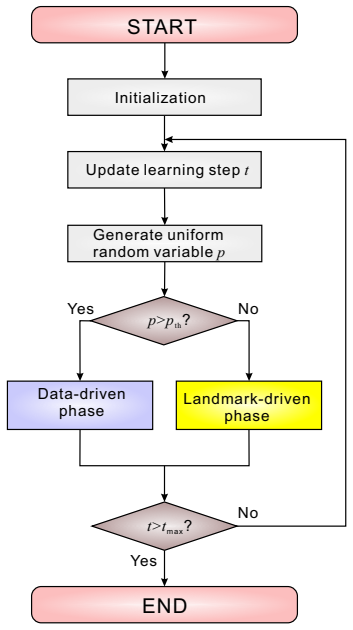
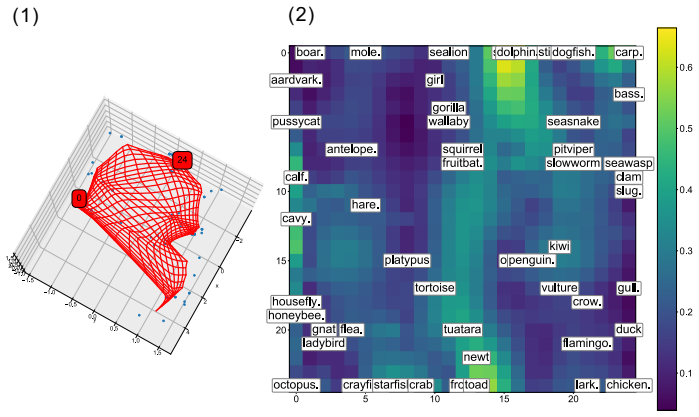
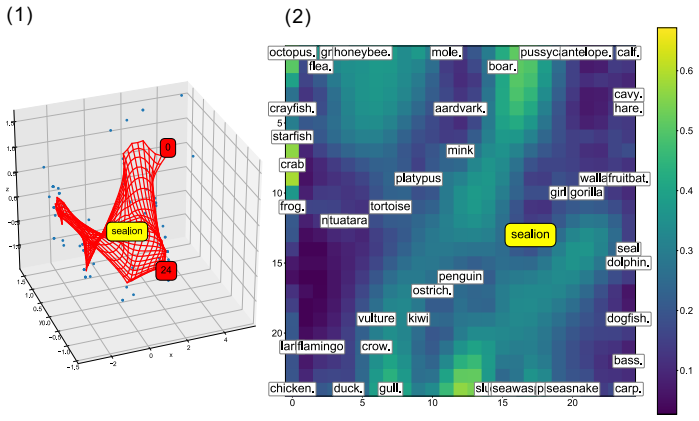
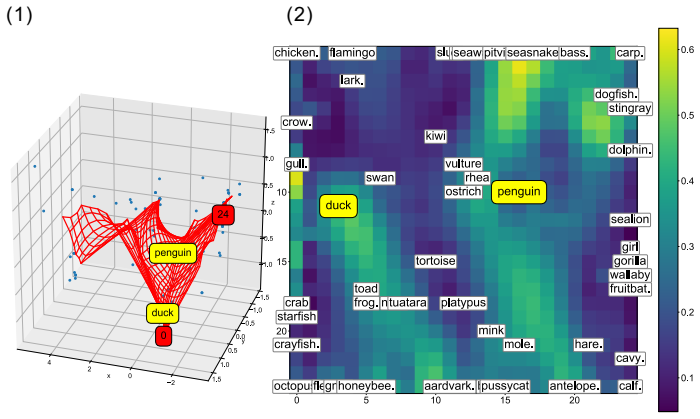
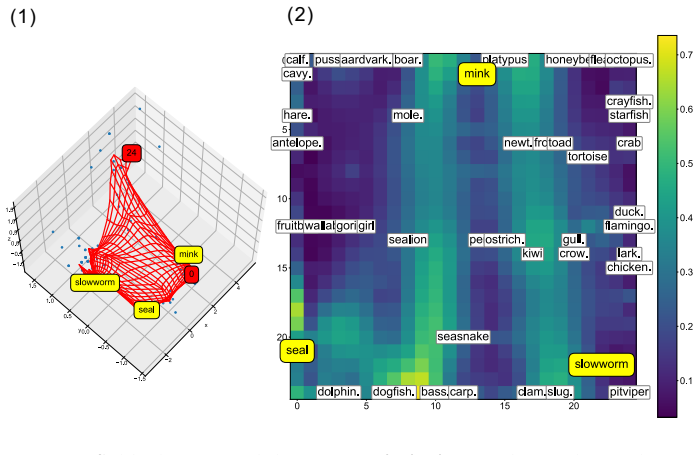
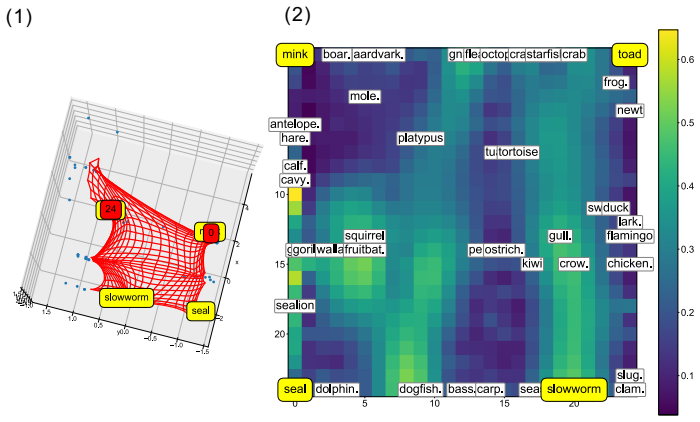
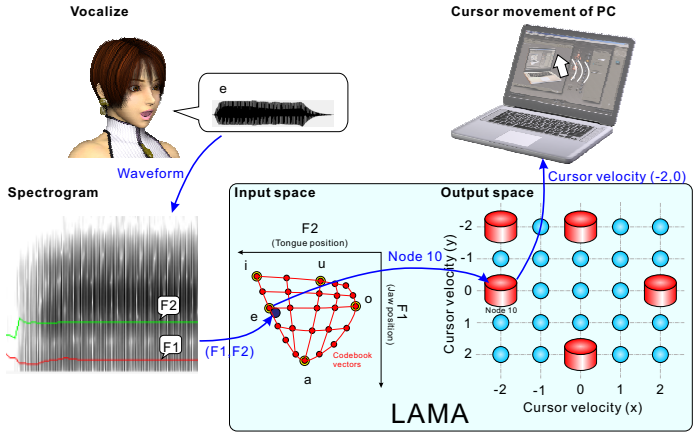
The paper claims that a self-organizing map can be made to honor user-chosen constraints by adding a small number of landmark nodes, each a fixed pair of a data point in input space and a grid node in output space. Training alternates, with probability $p_{\rm th}$, the ordinary SOM update with a landmark-driven update: the paired node is forced to be the winner for its landmark data, and all codebook vectors are pulled toward that landmark data through a Gaussian neighborhood centered at the landmark node. Because the landmark-driven neighborhood has its own schedule, peaking in the middle of training and decaying differently from the data-driven neighborhood, the grid bends toward the landmarks while mostly retaining its ordering. On the Zoo dataset this produces landmark-centered views with one, two, three, and four landmarks; on the artificial formant dataset it maps tongue movement from /e/ to /o/ to horizontal cursor movement and jaw movement from /u/ to /a/ to vertical cursor movement. The numerical indices show that the data fit stays close to the SOM's while the landmark fit remains low in most configurations.
Load-bearing premise
The claim assumes that for any user-chosen set of landmark pairs, some setting of the many learning parameters exists and can be found by manual tuning that keeps the map's grid smooth while placing the landmark nodes' reference points at their assigned data points.
Editorial extensions
If this is right
- A user can produce several deliberately different views of the same dataset by changing landmark placements, as shown by the four Zoo configurations: centered, between two anchors, inside a triangle of anchors, and inside a square of edge anchors.
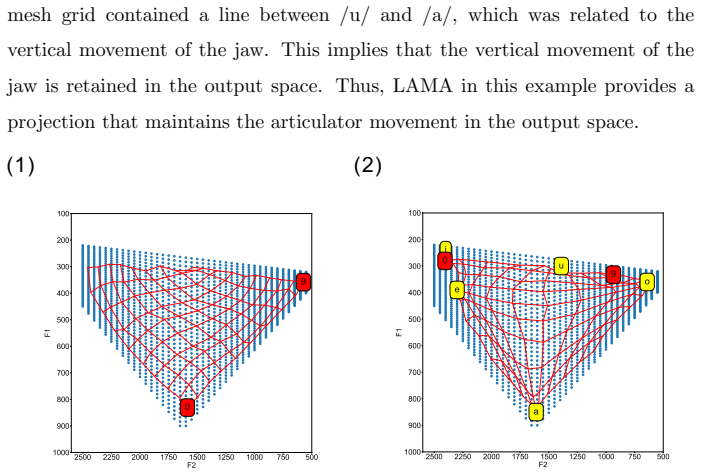
- The projection can align chosen semantic directions with output axes: in the formant experiment, moving from /e/ to /o/ in the input space corresponds to horizontal motion in the output space, and moving from /u/ to /a/ corresponds to vertical motion.
- Landmark data do not have to be training points; the formant landmarks are externally defined mean values, so LAMA can pull a projection toward reference prototypes outside the observed set.
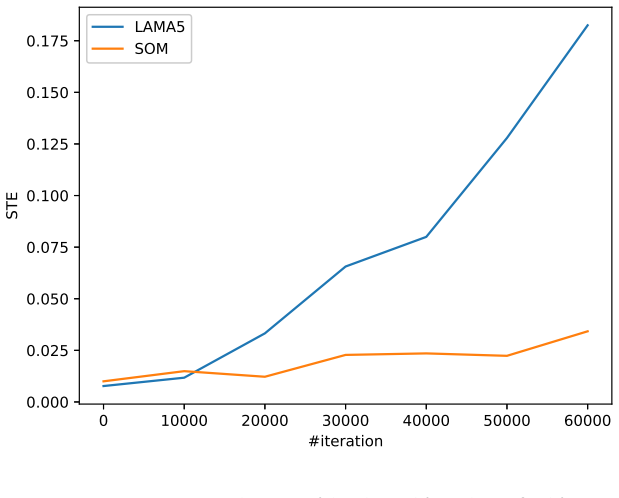
- The cost of landmark constraints appears where the two objectives conflict: stronger landmark forcing can distort the codebook mesh and raise square topographic error, so parameter tuning by inspecting visualizations is part of the method as presented.
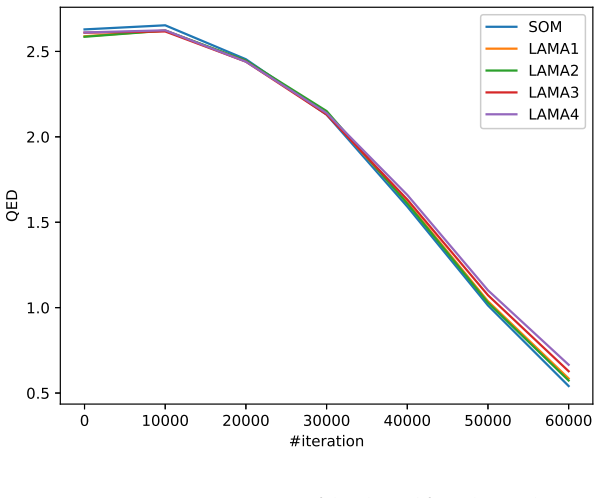
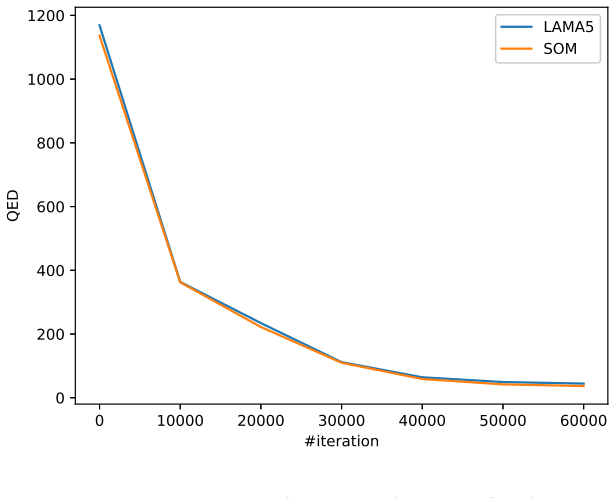
- The quantization error on the data stays comparable to the plain SOM at the end of training, so landmark constraints can be added without abandoning the map's fit to the whole dataset.
Reading between the lines
- Inference: LAMA turns projection design into an interactive loop: after inspecting a current view, a user could add one more pairwise anchor and re-train; the paper does not describe such an interface, but the landmark formulation supports it.
- Inference: The formant experiment is static and offline; a natural extension is an online version where landmark targets are fixed mean formant values and incoming formant estimates update the map continuously, which would test whether the intended cursor mapping persists under real speech variability.
- Inference: If landmark fit and grid smoothness conflict in general, then a testable design principle is to place landmarks only where a preliminary map already puts them and to automate the schedule search; this would quantify how far from the unconstrained solution a user-intended projection can be pushed before wrinkles appear.
- Inference: Because landmarks are point-to-node pairs rather than class labels, the same machinery could enforce invariance constraints in other unsupervised projections, for example pinning known stable or prototype points to fixed screen positions, a use the paper does not discuss.
Signed reviews
Editorial analysis
A structured set of objections, weighed in public.
Referee Report
Summary. The paper proposes LAMA, an extension of the self-organizing map in which a user designates landmark pairs, each pairing a data point with a specific output-space node. Training alternates a data-driven SOM phase with a landmark-driven phase that moves the landmark node's codebook vector toward its assigned landmark data. The paper evaluates LAMA on the UCI Zoo dataset with four landmark configurations and on an artificial formant dataset intended to associate tongue/jaw movement with cursor movement. The central claim is that, by setting a small number of landmarks, a user can obtain a nonlinear projection that preserves SOM-like topology while imposing chosen semantic constraints, leading to landmark-centered visualization and HCI applications.
Significance. If validated, LAMA would fill a real gap: existing supervised or semi-supervised SOM variants use class labels, whereas LAMA directly expresses the user's intended correspondence between data points and locations in the output space. The algorithm is clearly specified through explicit equations (Eqs. 1-18), the learning rules are transparent, and the Zoo examples do illustrate a qualitatively different view from a standard SOM. The main weakness is that the quantitative evidence is not independent of the training objective: QEL is the term minimized by the landmark-driven update, and the central success claim rests on hand-selected landmark placements and manually tuned parameters. With additional quantitative, final-state evaluation and a more principled parameter protocol, the contribution would be of interest to the SOM and visualization communities.
major comments (4)
- [Section 2.4.2 (Eq. 14) and Section 5] QEL is not an independent success measure. Eq. (14) measures the distance between each landmark data point and its assigned landmark codebook vector, which is precisely the quantity that Eq. (11) reduces during the landmark-driven phase. Therefore the low QEL values reported in Sections 3.3 and 4.3 largely confirm that the optimization objective was met, not that the resulting projection is semantically useful. I recommend adding an independent evaluation, such as testing on held-out landmark pairs, measuring how well the projected layout matches the intended semantic directions, or comparing against a baseline that optimizes the same objective without the SOM topology term.
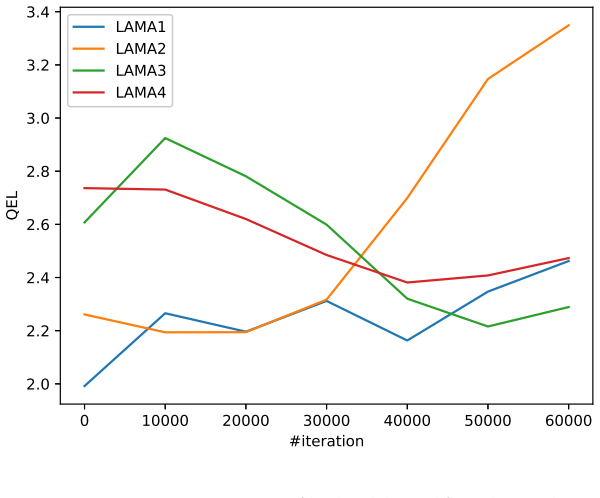
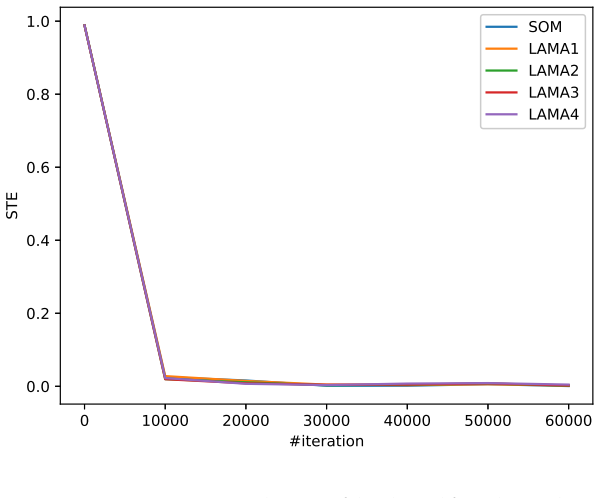
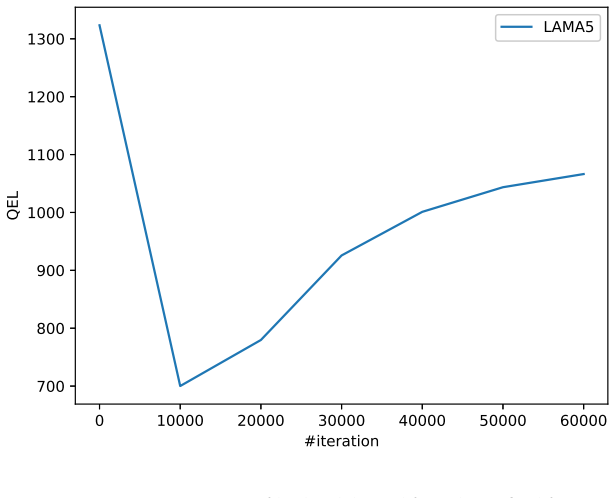
- [Sections 3.3 and 4.3, Figures 8-11 and 16] The paper does not establish that the reported visualizations come from the converged final state. Section 3.3 states that the QEL of LAMA2 'increased toward the final iteration,' and Section 4.3 states that the QEL of LAMA5 'increased toward the end of learning,' while Fig. 19 shows an increasing STE for LAMA5. Yet the training iteration that produced Figures 8-11 and 16 is not stated. Since the central claim concerns what LAMA learns, not a transient mid-training configuration, the visualization and all error indices should be reported for the final iteration t = tmax, and the final values with variability across the 100 runs should be given explicitly.
- [Section 5] The parameter-setting premise is load-bearing but unsupported. The paper concedes that there is 'no strict rule for setting the parameters' and that missetting can cause the mesh grid to be twisted or wrinkled. Every reported LAMA variant uses a different manual combination of bmin, pth, ρb, ρmin, and other parameters, and the choice of landmarks is itself hand-picked. The manuscript therefore does not demonstrate that a typical user can discover a parameter setting that yields a smooth grid satisfying arbitrary landmark constraints. I ask for a sensitivity analysis over the parameter ranges, a proposed automatic or semi-automatic tuning rule, or at least multiple landmark configurations with fixed shared parameters to show that the result is not specific to the chosen hand-tuned runs.
- [Section 4.2] The formant experiment's success claim is supported only by visual inspection. The text says that the mesh grid has 'a line between /e/ and /o/' and 'a line between /u/ and /a/', but no numerical measure quantifies how well the tongue and jaw directions align with the horizontal and vertical axes of the output space. Because this is the paper's main demonstration of a user-intended projection for HCI, I recommend a quantitative alignment measure, such as the angle between the landmark-pair direction in codebook space and the corresponding output-space axis, evaluated over multiple random initializations.
minor comments (3)
- [Fig. 2 caption] The caption says 'The number of codebook vectors (N) is the same as that of location vectors,' but the number of codebook/location vectors is K, not N; N is the number of data points. Please correct this notation error.
- [Section 2.2.2, Eq. (8)] The text after Eq. (8) refers to τb as the parameter controlling the distribution over steps, but Eq. (8) uses ρb. Please make the text and equations consistent.
- [Sections 4.2 and 4.3] The formant experiment is called 'LAMA' in Table 2 and Section 4.2, but Section 4.3 introduces the name 'LAMA5' without warning. Use a single label consistently, or explicitly state that LAMA5 is the same configuration.
Circularity Check
QEL-based evidence is partly circular because Eq. (11) directly minimizes Eq. (14); the visual landmark maps provide the main independent support.
-
fitted input called prediction
[Sections 2.2.2, 2.4.2, and 3.3 (Eq. 11 vs. Eq. 14)]
"The landmark-driven phase makes the codebook vector of the landmark node close to its landmark data ... wk← wk +βk(t)· (x′m− wk),∀k. ... The QEL should be small if landmark data and corresponding landmark nodes are closely located in the input space."
Equation (11) is the landmark-driven update that moves w_lm toward x'_m, and with neighborhood weighting also moves nearby codebooks toward x'_m. Equation (14) defines QEL as the mean over landmarks of ||x'_m - w_kl(m)||, exactly the distance that Eq. (11) decreases when β>0. Thus, reporting low QEL for LAMA1/3/4 in Section 3.3, and the QEL curves in Section 4.3, checks that the training objective was optimized; it is not an independent verification that LAMA 'retains relationships between the landmark data and the landmark nodes.' The landmark-centered visualizations and the formant orientation are more independent, but the quantitative landmark-retention metric reduces to the training update by construction.
full rationale
The paper is an algorithm proposal rather than a derivation of a prediction from first principles, so most of the usual circularity patterns do not appear. There are no load-bearing self-citations, no imported uniqueness theorems, and no ansatz smuggled in via prior work; the LAMA update rules and error indices are defined in the paper. The one partial circularity is that QEL, the main quantitative index for landmark retention, is literally the loss being minimized by the landmark-driven phase: Eq. (11) pulls landmark codebook vectors toward landmark data, and Eq. (14) measures the residual distance. Consequently, low QEL values are expected by construction and cannot by themselves validate the central claim. The visual landmark-centered maps and the artificial formant experiment provide independent, if qualitative, evidence that the algorithm can realize user-specified landmark configurations. Two separate concerns reduce the force of the demonstrations without being circularity: the paper reports that QEL increased toward the final iteration for LAMA2 and LAMA5, yet does not state which learning iteration generated the figures; and Section 5 concedes that all parameters are manually adjusted by inspecting the codebook-vector visualization, so the displayed outcomes may reflect tuning rather than a robust, automatically discovered configuration. On balance, the central claim still has independent visual content, but the quantitative landmark-retention evidence is partly circular.
Assumptions & free parameters
free parameters (9)
- pth (phase mixing probability) =
0.01, 0.05, 0.07, 0.09, 0.1 across LAMA1-4 and formant LAMA
- bmax (max landmark learning rate) =
0.4 (Zoo), 0.3 (formant)
- bmin (min landmark learning rate) =
0.01, 0.075, 0.1 (Zoo), 0.08 (formant)
- tcenter (landmark peak step) =
15000 (Zoo), 30000 (formant)
- rhob (temporal width of landmark learning) =
20000 and 25000 (Zoo), 15000 (formant)
- rhomax (initial landmark neighborhood width) =
13 (Zoo), 2 (formant)
- rhomin (final landmark neighborhood width) =
3, 0.7, 1, 1.5 (Zoo), 0.8 (formant)
- Shared SOM hyperparameters =
amax 0.3 to 0.5, amin 0.05 to 0.15, sigma_max 4 to 19, sigma_min 0.1 to 0.4, tau_a and tau_sigma = tmax/3 - 1
- Landmark assignments (data-to-node pairs) =
Zoo: sea lion:312; duck:303 and penguin:321; mink:37, seal:552 and slowworm:572; mink:0, toad:24, seal:600 and…
assumptions (5)
- domain assumption SOM neighborhood updates preserve topology in input space.
- ad hoc to paper The alternating data and landmark update converges to a stable or acceptable configuration.
- domain assumption Euclidean distance in input space is the right similarity for the projection and for landmarks.
- domain assumption Formant frequencies F1 and F2 correspond to tongue and jaw movement as cited from [29].
- ad hoc to paper User-specified landmark pairs are realizable without excessively distorting the grid.
Cite this review
Pith. "Pith review of Landmark Map: An Extension of the Self-Organizing Map for a User-Intended Nonlinear Projection." pith.science (2026). https://pith.science/paper/S5CIHEIP
@misc{pith2026190807124,
  author       = {Pith},
  title        = {Pith review of: Landmark Map: An Extension of the Self-Organizing Map for a User-Intended Nonlinear Projection},
  year         = {2026},
  howpublished = {\url{https://pith.science/paper/S5CIHEIP}},
  note         = {Machine review of arXiv:1908.07124}
}
read the original abstract
The self-organizing map (SOM) is an unsupervised artificial neural network that is widely used in, e.g., data mining and visualization. Supervised and semi-supervised learning methods have been proposed for the SOM. However, their teacher labels do not describe the relationship between the data and the location of nodes. This study proposes a landmark map (LAMA), which is an extension of the SOM that utilizes several landmarks, e.g., pairs of nodes and data points. LAMA is designed to obtain a user-intended nonlinear projection to achieve, e.g., the landmark-oriented data visualization. To reveal the learning properties of LAMA, the Zoo dataset from the UCI Machine Learning Repository and an artificial formant dataset were analyzed. The analysis results of the Zoo dataset indicated that LAMA could provide a new data view such as the landmark-centered data visualization. Furthermore, the artificial formant data analysis revealed that LAMA successfully provided the intended nonlinear projection associating articular movement with vertical and horizontal movement of a computer cursor. Potential applications of LAMA include data mining, recommendation systems, and human-computer interaction.
Figures
Figures from the paper (16 more)
Reference graph
Works this paper leans on
-
[1]
T. Kohonen, Self-organizing maps, 3rd Edition, Springer series in informa- tion sciences, 30, Springer, 2001
work page 2001
-
[2]
Kohonen, Essentials of the self-organizing map, Neural Networks 37 (2013) 52–65
T. Kohonen, Essentials of the self-organizing map, Neural Networks 37 (2013) 52–65
work page 2013
-
[3]
M. A. Kraaijveld, J. Mao, A. K. Jain, A nonlinear projection method based on kohonen’s topology preserving maps, IEEE Transactions on neural net- works 6 (3) (1995) 548–559
work page 1995
-
[4]
E. A. Uriarte, F. D. Mart´ ın, Topology preservation in SOM, International Journal of Applied Mathematics and Computer Sciences 1 (1) (2005) 19–22
work page 2005
-
[5]
Ultsch, Kohonen’s self organizing feature maps for exploratory data analysis, Proc
A. Ultsch, Kohonen’s self organizing feature maps for exploratory data analysis, Proc. INNC90 (1990) 305–308. 36
work page 1990
-
[6]
Ultsch, U * -matrix : A tool to visualize clusters in high dimensional data, Tech
A. Ultsch, U * -matrix : A tool to visualize clusters in high dimensional data, Tech. Rep. 36 (2003)
work page 2003
-
[7]
J. Vesanto, E. Alhoniemi, Clustering of the self-organizing map, IEEE Transactions on Neural Networks 11 (3) (2000) 586–600
work page 2000
- [8]
Show all 35 references
-
[9]
Sulkava, A
M. Sulkava, A. M. Sepponen, M. Yli-Heikkil¨ a, A. Latukka, Clustering of the self-organizing map reveals profiles of farm profitability and upscaling weights, Neurocomputing 147 (1) (2015) 197–206
2015
-
[10]
Belkhiri, L
L. Belkhiri, L. Mouni, A. Tiri, T. S. Narany, R. Nouibet, Spatial anal- ysis of groundwater quality using self-organizing maps, Groundwater for Sustainable Development 7 (June 2017) (2018) 121–132
2018
-
[11]
Ultsch, F
A. Ultsch, F. M¨ orchen, ESOM-maps: Tools for clustering, visualization, and classification with emergent SOM, Tech. rep. (2005)
2005
-
[12]
Al-Ketbi, M
O. Al-Ketbi, M. Conrad, Supervised ANN vs. unsupervised SOM to classify EEG data for BCI: Why can GMDH do better?, International Journal of Computer Applications 74 (4) (2013) 37–44
2013
-
[13]
Lawrence, C
S. Lawrence, C. L. Giles, A. C. Tsoi, A. D. Back, Face recognition: A convo- lutional neural-network approach, IEEE Transactions on Neural Networks 8 (1) (1997) 98–113
1997
-
[14]
Coleca, A
F. Coleca, A. State, S. Klement, E. Barth, T. Martinetz, Self-organizing maps for hand and full body tracking, Neurocomputing 147 (1) (2015) 174–184
2015
-
[15]
H. Chen, Q. Gao, T. Feng, Y. Liu, X. Xiao, Body falling gesture recogni- tion based on SOM and triaxial acceleration information, in: Proceedings of 37 the 2016 international conference on commpunications, information man- agement and network security, Vol. 47, 2016, pp. 70–73
2016
-
[16]
H. Yu, F. Khan, V. Garaniya, Risk-based fault detection using self- organizing map, Reliability Engineering and System Safety 139 (2015) 82– 96
2015
-
[17]
H. Liu, J. Wang, C. Zheng, Using self-organizing map for mental tasks classification in brain-computer interface, Advances in Neural Networks ISNN Second International Symposium on Neural Networks 2 (2005) 327– 332
2005
-
[18]
Khosrowabadi, H
R. Khosrowabadi, H. C. Quek, A. Wahab, K. K. Ang, EEG-based emotion recognition using self-organizing map for boundary detection, 2010 20th International Conference on Pattern Recognition (2010) 4242–4245
2010
-
[19]
Majumder, L
A. Majumder, L. Behera, V. K. Subramanian, Emotion recognition from geometric facial features using self-organizing map, Pattern Recognition 47 (3) (2014) 1282–1293
2014
-
[20]
Selmanaj, M
D. Selmanaj, M. Corno, S. M. Savaresi, Hazard detection for motorcycles via accelerometers: A self-organizing map approach, IEEE Transactions on Cybernetics 47 (11) (2017) 3609–3620
2017
-
[21]
Kohonen, The ’neural’ phonetic typewriter, Computer 21 (3) (1988) 11–22
T. Kohonen, The ’neural’ phonetic typewriter, Computer 21 (3) (1988) 11–22
1988
-
[22]
Fessant, P
F. Fessant, P. Aknin, L. Oukhellou, S. Midenet, Comparison of supervised self-organizing maps using euclidian or mahalanobis distance in classifica- tion context, in: International Work-Conference on Artificial Neural Net- works, Springer, 2001, pp. 637–644
2001
-
[23]
Goren-Bar, T
D. Goren-Bar, T. Kuflik, D. Lev, Supervised learning for automatic clas- sification of documents using self-organizing maps, in: DELOS Workshop: Information Seeking, Searching and Querying in Digital Libraries, 2000. 38
2000
-
[24]
Kohonen, P
T. Kohonen, P. Somervuo, Self-organizing maps of symbol strings, Neuro- computing 21 (1-3) (1998) 19–30
1998
-
[25]
Hagenbuchner, A
M. Hagenbuchner, A. C. Tsoi, A supervised training algorithm for self- organizing maps for structures, Pattern Recognition Letters 26 (12) (2005) 1874–1884
2005
-
[26]
F. Shen, H. Yu, Y. Kamiya, O. Hasegawa, An online incremental semi- supervised learning method, Journal of Advanced Computational Intelli- gence and Intelligent Informatics 14 (6) (2010) 593–605
2010
-
[27]
Herrmann, A
L. Herrmann, A. Ultsch, Label propagation for semi-supervised learning in self-organizing maps, in: In The 6th International Workshop on Self- Organizing Maps (WSOM 2007), 2007, pp. 3–6
2007
-
[28]
G. J. Meschino, D. S. Comas, V. L. Ballarin, A. G. Scandurra, L. I. Passoni, Automatic design of interpretable fuzzy predicate systems for clustering using self-organizing maps, Neurocomputing 147 (1) (2015) 47–59
2015
-
[29]
Nakagawa, H
S. Nakagawa, H. Shirakata, M. Yamao, T. Sakai, Differences in feature parameters of japanese vowels with sex and age, Sutudia Phonologica XIV (1980) 33–52
1980
-
[30]
Uemi, A study of a human interface device controlled by formant fre- quencies for the disabled, in: International Conference on Cross-Cultural Design, Springer, 2013, pp
N. Uemi, A study of a human interface device controlled by formant fre- quencies for the disabled, in: International Conference on Cross-Cultural Design, Springer, 2013, pp. 340–345
2013
-
[31]
Rauber, D
A. Rauber, D. Merkl, M. Dittenbach, The growing hierarchical self- organizing map: Exploratory analysis of high-dimensional data, IEEE Transactions on Neural Networks 13 (6) (2002) 1331–1341
2002
-
[32]
Iwasaki, T
T. Iwasaki, T. Furukawa, Tensor SOM and tensor GTM: Nonlinear tensor analysis by topographic mappings, Neural Networks 77 (2016) 107–125
2016
-
[33]
Furukawa, SOM of SOMs, Neural Networks 22 (4) (2009) 463–478
T. Furukawa, SOM of SOMs, Neural Networks 22 (4) (2009) 463–478. 39
2009
-
[34]
C. M. Bishop, M. Svens´ en, C. K. I. Williams, GTM: The Generative To- pographic Mapping, Neural Computation 10 (1) (1998) 215–234
1998
-
[35]
Vatanen, M
T. Vatanen, M. Osmala, T. Raiko, K. Lagus, M. Sysi-Aho, M. Oreˇ siˇ c, T. Honkela, H. L¨ ahdesm¨ aki, Self-organization and missing values in SOM and GTM, Neurocomputing 147 (1) (2015) 60–70. 40
2015
Reviewed August 14, 2026 · model on record in the stance chip above.
Discussion (0). Continue with ORCID to comment.