REVIEW 4 major objections 6 minor 17 references
Comparative Analysis of Community Detection Algorithms on the SNAP Social Circles Dataset
T0 review · 4 major / 6 minor · reviewed 2026-08-09 · deepseek-v4-flash
Pith's one-line read Louvain and label propagation emerge as the most robust community detection algorithms on the SNAP Facebook graph.
desk verdict A routine benchmark that ships code but whose headline ranking rests on circular metrics and ignores the dataset's ground-truth labels. read the letter →
The pith
A machine-rendered reading of the paper's core claim, the machinery that carries it, and where it could break.
The reading
What carries the argument
The carrying object is a comparison protocol rather than a new algorithm or theorem: the SNAP Social Circles Facebook graph, treated as a single network of 4,039 nodes and more than 88,000 edges, is partitioned by each algorithm and then each partition is scored by six internal quality metrics. The metrics translate qualitative notions of a good community—dense internal connections, few edges between communities, compact clusters, well-separated centers—into numbers that can be ranked. The protocol works because it treats the algorithms symmetrically, so differences in metric scores are attributed to algorithmic behavior rather than to the evaluator.
What would settle it
Re-score all six partitions against the dataset's ground-truth circles using normalized mutual information or the adjusted Rand index; if Infomap or the leading eigenvector method matches the known circles better than Louvain and Label Propagation, the paper's conclusion that the latter two are the most robust choices would be contradicted.
Extended reading notes
Core claim
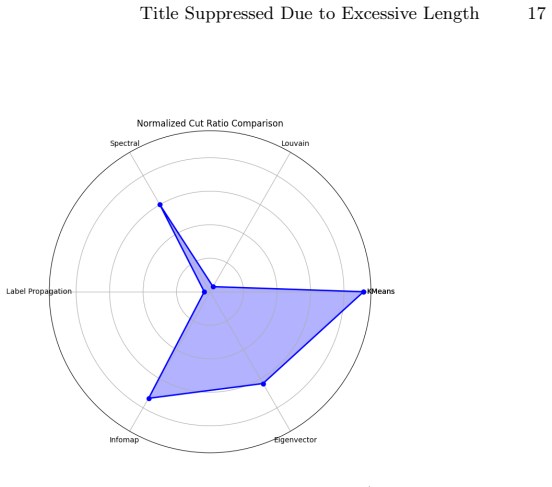
The paper's central claim is that, among K-Means, Louvain, Spectral Clustering, Label Propagation, Infomap, and Leading Eigenvector, the Louvain and Label Propagation algorithms are the most robust choices for detecting communities in the SNAP Social Circles Facebook network. The claim rests on comparing each algorithm's partition with modularity, normalized cut ratio, silhouette score, compactness, Calinski-Harabasz score, and separability. No single algorithm dominates every metric; each has strengths, but Louvain and Label Propagation score well across a wider range, leading the authors to recommend them for general use and to caution that algorithm selection should depend on the dataset and objective.
Load-bearing premise
The ranking assumes that internal quality metrics computed on an algorithm's own output are sufficient to judge community detection, so the ground-truth circles in the SNAP dataset can be ignored.
Editorial extensions
If this is right
- On Facebook-like social graphs, Louvain and Label Propagation can serve as safe defaults when no ground-truth communities are available, with less risk of trailing badly on any single metric.
- Algorithms such as Infomap and the leading eigenvector method produce many small communities in this dataset, so they are better suited to tasks that need fine-grained structure rather than a few large clusters.
- Researchers comparing algorithms on their own networks can reuse the same metric suite to rank methods without relying on labels.
- Because no algorithm dominates every metric, evaluation should report several metrics rather than a single headline score when choosing a community detection method.
Reading between the lines
- Because the comparison ignores the ground-truth circles that ship with the SNAP dataset, the ranking reflects internal cohesion and separation, not agreement with real friend lists; measuring agreement with those circles could plausibly reorder the winners.
- The paper treats the dataset as one aggregated 4,039-node graph, although the ground truth is defined per ego network; running the same metrics separately on each ego network is a natural test of whether the ranking survives the aggregation.
- The number of communities each algorithm finds varies widely—from around 13 for Louvain to 93 for Infomap—so part of what the metrics capture may be partition granularity; a fairer comparison might hold the number of communities fixed.
Editorial analysis
A structured set of objections, weighed in public.
Referee Report
Summary. The paper reports an empirical comparison of six community detection algorithms (K-Means, Louvain, spectral clustering, label propagation, Infomap, and leading eigenvector) on the SNAP Facebook Social Circles dataset. The authors compute modularity, normalized cut ratio, silhouette score, compactness, Calinski-Harabasz score, and separability for each algorithm, and conclude in Section 7 that Louvain and label propagation are 'particularly robust choices.' The paper provides visualizations and a link to code.
Significance. The topic is of practical interest, and the paper has the merit of making its code public and covering standard algorithms. If the central ranking were established through external validation against the ground-truth circles, the paper could be a useful practical reference. However, the current design—internal metrics that partly coincide with the algorithms' objectives, no ground-truth baseline, no error bars, and an unspecified node embedding—means the headline conclusion is not currently established. The significance is therefore limited unless the evaluation is substantially strengthened.
major comments (4)
- [Section 6, Fig. 12; Section 7] The headline conclusion that Louvain and Label Propagation are 'particularly robust choices' is not supported by the reported evidence, because several of the metrics are the objective functions of the algorithms being compared. Modularity (Eq. 1) is the objective optimized by Louvain; normalized cut (Eq. 2) is the criterion spectral clustering is designed to minimize; compactness (Eq. 6) and, indirectly, the Calinski-Harabasz score (Eq. 7) are the K-Means objective. A ranking that rewards each algorithm partly for optimizing its own objective cannot establish robustness. Since the SNAP Social Circles dataset includes ground-truth circles, the paper should report agreement measures such as NMI or adjusted Rand index against those circles; without this external anchor, the claim that the detected communities are 'meaningful' (Abstract) is unjustified.
- [Section 5.5A; Eqs. (3)-(6), (8)] The K-Means and spectral clustering results depend on a vector embedding of nodes that is never described. The silhouette score (Eq. 3), compactness (Eq. 6), and separability (Eq. 8) all require pairwise distances d(i,j) or distances to centroids; for a graph, these quantities are undefined unless an embedding or distance model is specified. The paper must state the embedding used and justify it; otherwise the metric values for K-Means and spectral clustering cannot be interpreted or reproduced.
- [Section 5.1; Section 7] The dataset is described only as 'more than 4000 nodes having more than 88,000 edges.' The SNAP Social Circles dataset is a collection of ego networks, each with its own ground-truth circles. The paper appears to analyze a single aggregated graph, but it never states how the ego networks were combined, whether isolated nodes were removed, or how ground-truth circles would transfer to the aggregated graph. This omission affects both the internal-metric analysis and any external validation; the authors should describe the graph construction precisely.
- [Section 6, Fig. 12; Section 5.5] Louvain, Label Propagation, K-Means, spectral clustering, and the leading eigenvector method are stochastic or initialization-dependent. The paper reports a single value per metric with no error bars, no repeated runs, and no significance tests. The observed differences between algorithms could therefore be run-to-run noise. The authors should report means and standard deviations over multiple random seeds, or otherwise demonstrate stability.
minor comments (6)
- [Section 4.2, Eq. (2)] There is a typo: 'number od edges' should read 'number of edges.'
- [Section 6.1 vs. Section 7] Section 6.1 says six algorithms were tested on 'five separate metrics,' while Section 7 counts 'six key metrics'; the metric list actually contains six entries. Please make the count consistent.
- [Section 5.5F] The 'Leading Eigenvector Algorithm' is described as 'frequently called the Newman-Girvan algorithm,' but Newman-Girvan is a different betweenness-based divisive algorithm. The lead eigenvector method is a separate spectral method (Newman 2006). Also, the sentence 'The Infomap Algorithm identified 18 communities' in this section appears to be a typo; it should refer to the leading eigenvector method.
- [Figure captions 14, 15, 18] The captions are inconsistent with the definitions in Section 4.2: normalized cut is better when lower, compactness is better when lower, and silhouette score is better when higher. The captions state the opposite directions and should be corrected.
- [Section 6.1, Fig. 12] Figure 12 is a screenshot; the numeric metric values should be provided in a table so that the results are reproducible from the written paper alone.
- [Keywords] 'Commuity Detection' should be 'Community Detection.'
Circularity Check
Metric columns double as algorithm objectives (modularity for Louvain, compactness for K-Means), making part of the comparison self-referential, but the robustness claim still rests on other metrics.
-
self definitional
[Section 4.2 Eq. (1); Section 5.5 B; Section 6.1 Figure 12]
"Modularity : ... Q = 1/2m Σ [Aij − kikj/2m]δ(ci,cj) (1). ... The Louvain method, developed by Vincent D. Blondel et al., is based on the optimization of modularity, a metric that measures the quality of a partition of a network into communities."
The comparison table in Figure 12 includes Modularity Score as one of the six metrics. Louvain's own algorithm is defined as greedy modularity maximization, so a high modularity score for Louvain is produced by its objective function rather than discovered by an independent judge. Using that column as evidence that Louvain is 'robust' partially scores the algorithm on its own loss function.
-
self definitional
[Section 4.2 Eq. (6) and Section 5.5 A Eq. (9)]
"Compactness = Σ_{i=1}^k (1/|C_i|) Σ_{x⊂C_i} dist(x, μ_i)^2 (6). ... arg min_S Σ_{i=1}^k Σ_{x⊂S_i} ||x − μ_i||^2 (9)"
K-Means is defined by minimizing the sum of squared distances of points to their assigned centroid. Compactness is the size-averaged version of the same within-cluster squared distances. Therefore K-Means' compactness score is essentially its own training objective renamed as an evaluation metric; the compactness comparison is not an independent test of community quality for K-Means.
full rationale
The paper is a comparative benchmark rather than a derivation, and most of its machinery is self-contained. The concrete circularity is partial: two of the six evaluation metrics coincide with the objective functions of two tested algorithms. Louvain's modularity score is the exact quantity Louvain maximizes (Eq. 1 vs. Sec. 5.5B), and Compactness (Eq. 6) is the size-averaged within-cluster sum of squares that K-Means minimizes (Eq. 9). Thus the Figure 12 columns for Modularity and Compactness are not neutral adjudicators for those algorithms. The headline conclusion nevertheless names Louvain and Label Propagation as robust 'across multiple metrics,' and the remaining metrics — normalized cut, silhouette, Calinski-Harabasz, separability — are not objectives of Louvain or Label Propagation, so the central claim retains independent content and is not fully forced. There is no load-bearing self-citation, no imported uniqueness theorem, and no fitted parameter renamed as a prediction; the absence of ground-truth-circle agreement (NMI/ARI) and error bars is a validity limitation, not circularity. A score of 4 reflects partial metric-objective circularity without total reduction.
Assumptions & free parameters
free parameters (3)
- Number of clusters k for K-Means =
15
- Number of clusters for Spectral Clustering
- Random seed or initialization for stochastic algorithms
assumptions (3)
- domain assumption Internal clustering metrics evaluated on an algorithm's own output are treated as valid measures of community detection quality, without reference to ground-truth circles.
- domain assumption The SNAP Social Circles dataset is represented as a single aggregated undirected graph for all algorithms.
- ad hoc to paper K-Means and spectral clustering are applied to some vector embedding of nodes, although the embedding is never described.
Cite this review
Pith. "Pith review of Comparative Analysis of Community Detection Algorithms on the SNAP Social Circles Dataset." pith.science (2026). https://pith.science/paper/SB3P4CNS
@misc{pith2026250204341,
  author       = {Pith},
  title        = {Pith review of: Comparative Analysis of Community Detection Algorithms on the SNAP Social Circles Dataset},
  year         = {2026},
  howpublished = {\url{https://pith.science/paper/SB3P4CNS}},
  note         = {Machine review of arXiv:2502.04341}
}
read the original abstract
In network research, Community Detection has always been a topic of significant interest in network science, with numerous papers and algorithms proposing to uncover the underlying structures within networks. In this paper, we conduct a comparative analysis of several prominent community detection algorithms applied to the SNAP Social Circles Dataset, derived from the Facebook Social Media network. The algorithms implemented include Louvain, Girvan-Newman, Spectral Clustering, K-Means Clustering, etc. We evaluate the performance of these algorithms based on various metrics such as modularity, normalized cut-ratio, silhouette score, compactness, and separability. Our findings reveal insights into the effectiveness of each algorithm in detecting various meaningful communities within the social network, shedding light on their strength and limitations. This research contributes to the understanding of community detection methods and provides valuable guidance for their application in analyzing real-world social networks.
Figures


Figures from the paper (15 more)




Reference graph
Works this paper leans on
-
[1]
Fortunato, Santo. "Community detection in graphs." Physics reports 486.3-5 (2010): 75-174
work page 2010
-
[2]
Community detection in networks: A user guide
Fortunato, Santo, and Darko Hric. "Community detection in networks: A user guide." Physics reports 659 (2016): 1-44
work page 2016
-
[3]
Community detection algorithms: a comparative analysis
Lancichinetti, Andrea, and Santo Fortunato. "Community detection algorithms: a comparative analysis." Physical review E 80.5 (2009): 056117. 20 Yash Malode, Amit Aylani , Arvind Bhardwaj, and Deepak Hajoary
work page 2009
-
[4]
Community detection in networks: A multidisci- plinary review
Javed, Muhammad Aqib, et al. "Community detection in networks: A multidisci- plinary review." Journal of Network and Computer Applications 108 (2018): 87-111
work page 2018
-
[5]
Community detection in social networks
Bedi, Punam, and Chhavi Sharma. "Community detection in social networks." Wi- ley interdisciplinary reviews: Data mining and knowledge discovery 6.3 (2016): 115- 135
work page 2016
-
[6]
Snap: A general-purpose network analysis and graph-mining library
Leskovec, Jure, and Rok Sosič. "Snap: A general-purpose network analysis and graph-mining library." ACM Transactions on Intelligent Systems and Technology (TIST) 8.1 (2016): 1-20
work page 2016
-
[7]
Review on determining number of Cluster in K-Means Clustering
Kodinariya, Trupti M., and Prashant R. Makwana. "Review on determining number of Cluster in K-Means Clustering." International Journal 1.6 (2013): 90-95
work page 2013
-
[8]
Unsupervised K-means clustering algo- rithm
Sinaga, Kristina P., and Miin-Shen Yang. "Unsupervised K-means clustering algo- rithm." IEEE access 8 (2020): 80716-80727
work page 2020
Show all 17 references
-
[9]
Fast unfolding of communities in large networks
Blondel, Vincent D., et al. "Fast unfolding of communities in large networks." Jour- nal of statistical mechanics: theory and experiment 2008.10 (2008): P10008
2008
-
[10]
Fast unfolding of communities in large networks: 15 years later
Blondel, Vincent, Jean-Loup Guillaume, and Renaud Lambiotte. "Fast unfolding of communities in large networks: 15 years later." arXiv preprint arXiv:2311.06047 (2023)
2023 arXiv
-
[11]
Spectral clustering with graph neural networks for graph pooling
Bianchi, Filippo Maria, Daniele Grattarola, and Cesare Alippi. "Spectral clustering with graph neural networks for graph pooling." International conference on machine learning. PMLR, 2020
2020
-
[12]
On spectral clustering: Analysis and an algorithm
Ng, Andrew, Michael Jordan, and Yair Weiss. "On spectral clustering: Analysis and an algorithm." Advances in neural information processing systems 14 (2001)
2001
-
[13]
A tutorial on spectral clustering
Von Luxburg, Ulrike. "A tutorial on spectral clustering." Statistics and computing 17 (2007): 395-416
2007
-
[14]
A new attributed graph clustering by using label prop- agation in complex networks
Berahmand, Kamal, et al. "A new attributed graph clustering by using label prop- agation in complex networks." Journal of King Saud University-Computer and In- formation Sciences 34.5 (2022): 1869-1883
2022
-
[15]
Near linear time algorithm to detect community structures in large-scale networks
Raghavan, Usha Nandini, Réka Albert, and Soundar Kumara. "Near linear time algorithm to detect community structures in large-scale networks." Physical review E 76.3 (2007): 036106
2007
-
[16]
& Bergstrom, C
Rosvall, M., Axelsson, D. & Bergstrom, C. The map equation. Eur. Phys. J. Spec. Top. 178, 13–23 (2009). https://doi.org/10.1140/epjst/e2010-01179-1
2009 doi
-
[17]
Finding community structure in networks using the eigenvec- tors of matrices
Newman, Mark EJ. "Finding community structure in networks using the eigenvec- tors of matrices." Physical review E 74.3 (2006): 036104
2006
Reviewed August 9, 2026 · model on record in the stance chip above.
Discussion (0). Continue with ORCID to comment.