REVIEW 4 major objections 4 minor 1 cited by
Enabling DBSCAN for Very Large-Scale High-Dimensional Spaces
T0 review · 4 major / 4 minor · reviewed 2026-08-12 · deepseek-v4-flash
Pith's one-line read This paper proposes a spectral data-compression method that lets DBSCAN run on very large, high-dimensional datasets, cutting runtime by orders of magnitude and often improving clustering accuracy.
desk verdict A coherent but thinly evidenced transplant of the author's own spectral compression into DBSCAN; the headline quality and speed claims do not survive contact with the paper's own tables and figures. read the letter →
The pith
A machine-rendered reading of the paper's core claim, the machinery that carries it, and where it could break.
The reading
What carries the argument
The load-bearing mechanism is spectral-similarity compression. Starting from a k-nearest-neighbor graph of the data, the first $r$ eigenvectors of the graph Laplacian produce a spectral embedding $X$; the spectral similarity $s_{uv} = |(X_u,X_v)|^2/((X_u,X_u)(X_v,X_v))$ measures the squared cosine between two embedded points and is read as the proportion of variance one explains by regression on the other. Points with high mutual spectral similarity are collected into subsets, and each subset's mean feature vector becomes one pseudo-sample fed to DBSCAN. Iterating this aggregation compresses the dataset further while, according to the paper, preserving the spectral structure that determines the clusters.
What would settle it
A concrete test is to take a dataset with two dense clusters connected by a thin, low-density bridge of points that are spectrally correlated with one cluster, run full DBSCAN and the compressed pipeline on the same data, and compare labels: if the bridge points are labeled as members of the cluster under compression but as noise or a separate region under full DBSCAN, the fidelity assumption fails. A quantitative version is to compute per-point label agreement between full and compressed DBSCAN on a small labeled dataset and show that disagreements are not concentrated at cluster borders.
Extended reading notes
Core claim
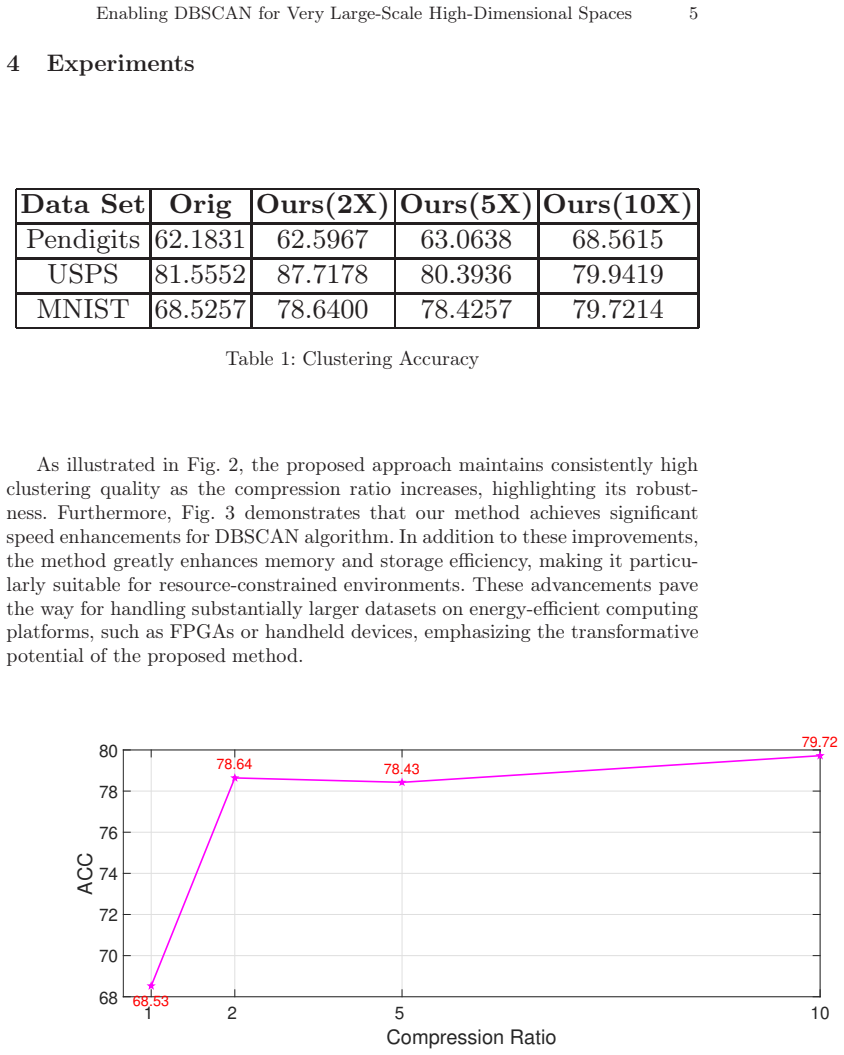
The central claim is that spectrum-preserving data compression makes DBSCAN feasible in very large-scale, high-dimensional spaces while keeping or improving the quality of the clustering. The author's construction is: form a k-nearest-neighbor graph on the data, embed the graph with the first $r$ eigenvectors of its Laplacian, measure spectral similarity between embedded points as $s_{uv} = |(X_u,X_v)|^2/((X_u,X_u)(X_v,X_v))$, and average points with high spectral correlation into pseudo-samples. DBSCAN is run on the pseudo-samples, and each original point is assigned the cluster label of its pseudo-sample. The paper reports that this pipeline, applied to Pendigits, USPS, and MNIST, preserves clustering quality and can improve it, for example raising MNIST accuracy from 68.53 to 79.72 percent at 10x compression while cutting DBSCAN runtime from roughly 1872 to 13 seconds.
Load-bearing premise
The load-bearing premise is that averaging points that look similar in the spectral embedding produces pseudo-samples whose density clusters faithfully represent the original data's clusters, so that each original point can safely inherit its pseudo-sample's cluster label.
Editorial extensions
If this is right
- Datasets with millions of high-dimensional points become tractable for DBSCAN because the expensive pairwise range queries run on the compressed pseudo-samples rather than on all original points.
- The compression ratio acts as a speed-accuracy control knob: the paper's MNIST results show accuracy improving up to 10x compression while runtime falls by more than a hundredfold.
- Outlier detection survives the compression, since noise points are identified during the same DBSCAN run on pseudo-samples and the label inheritance propagates the noise designation back to original points.
- Storing only the pseudo-samples sharply reduces memory and storage needs, which the paper connects to running DBSCAN on resource-constrained or energy-efficient platforms such as FPGAs and handheld devices.
Reading between the lines
- The same spectral pseudo-sample pipeline could plausibly accelerate other density-based or graph-based clustering algorithms, since the compression does not depend on DBSCAN-specific mechanics beyond the final label inheritance.
- Varying the number of eigenvectors and the subset size creates a multi-scale view of cluster structure, which could make the method useful as an exploratory tool rather than only a speedup.
- A direct test of the inheritance step is to compare, on a small labeled dataset, the labels assigned by full DBSCAN with those obtained by mapping pseudo-sample labels back; disagreements concentrated at cluster borders would show where averaging is most likely to misassign.
- Ablating the kNN-graph neighborhood size and the eigenvector count $r$ would map the method's sensitivity and likely be the first experiment a practitioner runs before deploying it on a new dataset.
Signed reviews
Editorial analysis
A structured set of objections, weighed in public.
Referee Report
Summary. The paper proposes a spectral data compression method intended to enable DBSCAN to scale to very large, high-dimensional datasets. The method constructs a kNN graph, computes a spectral embedding, groups points into pseudo-samples based on spectral correlation, runs DBSCAN on the compressed pseudo-samples, and finally assigns each original point the cluster label of its pseudo-sample. The authors claim that this approach accelerates DBSCAN without compromising solution quality and, moreover, significantly improves clustering quality. Experiments on three benchmark datasets (Pendigits, USPS, MNIST) report accuracy at compression ratios of 2X, 5X, and 10X, and figures show DBSCAN runtime decreasing with compression on MNIST. The paper is very short and lacks algorithmic details, complexity analysis, statistical validation, and comparisons to existing DBSCAN acceleration methods.
Significance. If the central claims were established, the method would be of practical interest for large-scale density-based clustering, since DBSCAN's quadratic complexity is a well-known bottleneck. The paper does provide a concrete empirical setup on real datasets and reports accuracy numbers, which is a useful starting point. However, the evidence in its current form does not support the strength of the claims: the reported speedups omit preprocessing overhead, the quality claim is contradicted by the paper's own USPS results at higher compression ratios, and no statistical or comparative validation is provided. The method's reliance on the author's earlier spectral aggregation work (ref. [3]) is acknowledged, but its applicability to DBSCAN is not justified by theory or controlled experiments.
major comments (4)
- [Section 4, Table 1] The central claim that the method 'significantly enhances the quality' of DBSCAN is contradicted by the paper's own data: on USPS, accuracy drops from 81.5552 (original) to 80.3936 at 5X compression and 79.9419 at 10X compression, below the baseline. No error bars, multiple seeds, or statistical tests are provided, so it is impossible to determine whether the observed improvements on Pendigits and MNIST are significant or merely noise. This issue is load-bearing because the quality guarantee is the main advertised contribution.
- [Section 3.1 and Fig. 3] The reported speedup measures only 'DBSCAN Time' on the compressed pseudo-samples, not the end-to-end runtime of the proposed pipeline. The preprocessing steps described in Section 3.1—kNN graph construction, spectral embedding via the first r eigenvectors, computation of pairwise spectral similarities (Eq. 2), and aggregation into pseudo-samples—are omitted from the timing. For large n and D, these steps can cost O(n^2 D) or more, potentially matching or exceeding the original DBSCAN cost. Without an end-to-end timing comparison or a complexity analysis that accounts for all phases, the acceleration claim is unsupported. The paper also does not compare against any existing DBSCAN acceleration method, such as DBSCAN++ (ref. [2]).
- [Section 3.1, Eq. (2)] The core assumption that clustering the pseudo-samples and then assigning each original point its pseudo-sample's label yields a faithful clustering of the original data is stated without proof or analysis. No bound, invariant, or empirical validation is given for the transfer of cluster memberships, nor is there a discussion of conditions under which averaging points within spectral-correlated subsets could destroy cluster structure or create spurious clusters. This assumption is load-bearing, since the quality of the final clustering depends entirely on it.
- [Section 3.1] The compression procedure is insufficiently specified for reproducibility. The paper states that samples are 'divided into subsets such that samples within the same subset exhibit high spectral correlation' but does not describe the algorithm for forming these subsets, the number of subsets at a given compression ratio, the choice of embedding dimension r, the kNN parameter k, or the DBSCAN parameters (epsilon, MinPts) used in the experiments. Without these details, the empirical results cannot be reproduced or independently assessed, which is a serious issue for a paper whose claims are entirely empirical.
minor comments (4)
- [Abstract and Section 1] There are several typos and grammatical errors, e.g., 'DBSCAN become s computationally infeasible' in the abstract and 'ou r proposed method' in Section 1; these should be corrected.
- [Fig. 1] The captions for panels (c) and (d) are incomplete or duplicated ('orig space the two circles data set'), and the text below the figure appears to have inconsistent labels; the figures themselves are not referenced in the main text with enough explanation.
- [Section 4] Fig. 2 and Fig. 3 report only single runs with no indication of variance, and the y-axis label in Fig. 2 is simply 'ACC' without a dataset label or description of what accuracy measure is used (e.g., adjusted Rand index, cluster purity, or classification-based accuracy).
- [References] The paper cites only seven references and omits a substantial body of work on scalable DBSCAN, such as grid-based, sampling-based, and approximate nearest-neighbor approaches; a comparison with at least one such method would be necessary to support the claim that existing methods 'invariably face a trade-off between speed and accuracy.'
Circularity Check
No significant circularity: the reported accuracy and timing results are empirical measurements, not predictions forced by construction.
full rationale
The paper's derivation chain is a data-processing pipeline: construct a kNN graph, embed via Laplacian eigenvectors, compute spectral similarities, aggregate points into pseudo-samples, run DBSCAN on the pseudo-samples, and inherit labels for original points. No parameter is fitted to the accuracy numbers, and the reported accuracies in Table 1 and times in Fig. 3 are measurements rather than outputs of a model fitted to those same targets. The central validity assumption, that clusters found on pseudo-samples transfer faithfully to the original points, is asserted without proof and may be a correctness gap, but it is not a circular reduction: DBSCAN on pseudo-samples is not equivalent by construction to DBSCAN on the original data, and the accuracy values are not baked into the algorithm's definition. The only self-referential element is reference [3], an earlier ICPR paper by the same author, but it is not cited in the body and no load-bearing claim in the present paper is justified by invoking it. Equation (2) is attributed to external reference [5], and spectral embedding to external reference [7]. The omission of kNN-graph and eigendecomposition overhead in the speed comparison is a serious empirical weakness, but it concerns the validity and completeness of the evaluation, not circularity.
Assumptions & free parameters
free parameters (6)
- spectral embedding dimension r (or number of eigenvectors K)
- kNN graph parameter k
- DBSCAN epsilon
- DBSCAN MinPts
- compression ratio =
2X, 5X, 10X
- subsampling threshold for spectral correlation
assumptions (3)
- domain assumption Spectral graph embedding preserves the clustering structure of the data.
- domain assumption Averaging points within spectral-correlated subsets preserves DBSCAN clusters.
- standard math The spectral similarity s_uv from [5] is a valid measure of spectral correlation.
Cite this review
Pith. "Pith review of Enabling DBSCAN for Very Large-Scale High-Dimensional Spaces." pith.science (2026). https://pith.science/paper/SD725TGK
@misc{pith2026241111421,
  author       = {Pith},
  title        = {Pith review of: Enabling DBSCAN for Very Large-Scale High-Dimensional Spaces},
  year         = {2026},
  howpublished = {\url{https://pith.science/paper/SD725TGK}},
  note         = {Machine review of arXiv:2411.11421}
}
abstract
DBSCAN is one of the most important non-parametric unsupervised data analysis tools. By applying DBSCAN to a dataset, two key analytical results can be obtained: (1) clustering data points based on density distribution and (2) identifying outliers in the dataset. However, the time complexity of the DBSCAN algorithm is $O(n^2 \beta)$, where $n$ is the number of data points and $\beta = O(D)$, with $D$ representing the dimensionality of the data space. As a result, DBSCAN becomes computationally infeasible when both $n$ and $D$ are large. In this paper, we propose a DBSCAN method based on spectral data compression, capable of efficiently processing datasets with a large number of data points ($n$) and high dimensionality ($D$). By preserving only the most critical structural information during the compression process, our method effectively removes substantial redundancy and noise. Consequently, the solution quality of DBSCAN is significantly improved, enabling more accurate and reliable results.
Figures


Forward citations
Cited by 1 Pith paper
-
Advanced Clustering Framework for Semiconductor Image Analytics Integrating Deep TDA with Self-Supervised and Transfer Learning Techniques
An integrated Deep TDA plus self-supervised plus transfer learning framework clusters semiconductor wafer maps into groups that visually match known defect patterns, without using labels during training.
Reference graph
Works this paper leans on
-
[3]
Y. Wang, ``Improving spectral clustering using spectrum-preserving node aggregation,'' in 2022 26th International Conference on Pattern Recognition (ICPR). 1em plus 0.5em minus 0.4em IEEE, 2022, pp. 3063--3068
work page 2022
-
[2]
J. Jang and H. Jiang, ``Dbscan++: Towards fast and scalable density clustering,'' in International conference on machine learning. 1em plus 0.5em minus 0.4em PMLR, 2019, pp. 3019--3029
work page 2019
-
[1]
M. Ester, H.-P. Kriegel, J. Sander, X. Xu et al., ``A density-based algorithm for discovering clusters in large spatial databases with noise,'' in kdd, vol. 96, no. 34, 1996, pp. 226--231
work page 1996
-
[4]
F. R. Chung, Spectral graph theory. 1em plus 0.5em minus 0.4em American Mathematical Soc., 1997, vol. 92
work page 1997
-
[5]
O. E. Livne and A. Brandt, ``Lean algebraic multigrid (lamg): Fast graph laplacian linear solver,'' SIAM Journal on Scientific Computing, vol. 34, no. 4, pp. B499--B522, 2012
work page 2012
-
[6]
A. Strehl and J. Ghosh, ``Cluster ensembles---a knowledge reuse framework for combining multiple partitions,'' Journal of machine learning research, vol. 3, no. Dec, pp. 583--617, 2002
work page 2002
-
[7]
M. Belkin and P. Niyogi, ``Laplacian eigenmaps for dimensionality reduction and data representation,'' Neural computation, vol. 15, no. 6, pp. 1373--1396, 2003
work page 2003
-
[8]
, " * write output.state after.block = add.period write
ENTRY address author booktitle chapter doi edition editor eid howpublished institution journal key month note number organization pages publisher school series title type url volume year label INTEGERS output.state before.all mid.sentence after.sentence after.block FUNCTION init.state.consts #0 'before.all := #1 'mid.sentence := #2 'after.sentence := #3 '...
Show all 9 references
-
[9]
write newline
" write newline "" before.all 'output.state := FUNCTION n.dashify 't := "" t empty not t #1 #1 substring "-" = t #1 #2 substring "--" = not "--" * t #2 global.max substring 't := t #1 #1 substring "-" = "-" * t #2 global.max substring 't := while if t #1 #1 substring * t #2 gl...
Reviewed August 12, 2026 · model on record in the stance chip above.
Discussion (0). Continue with ORCID to comment.