GSED: The Galactic Stellar Extinction Database
Pith reviewed 2026-07-01 04:53 UTC · model grok-4.3
The pith
A neural network corrects systematic offsets across six 3D extinction catalogues to produce a unified database of 1.9 billion stars.
A machine-rendered reading of the paper's core claim, the machinery that carries it, and where it could break.
Core claim
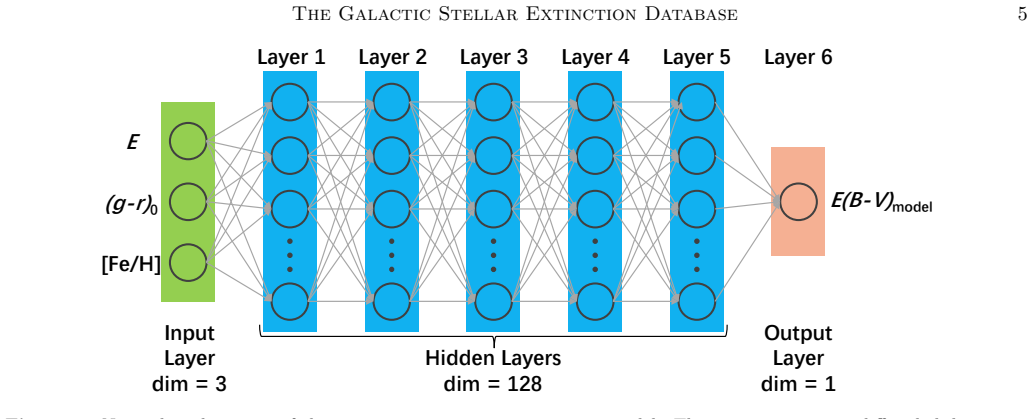
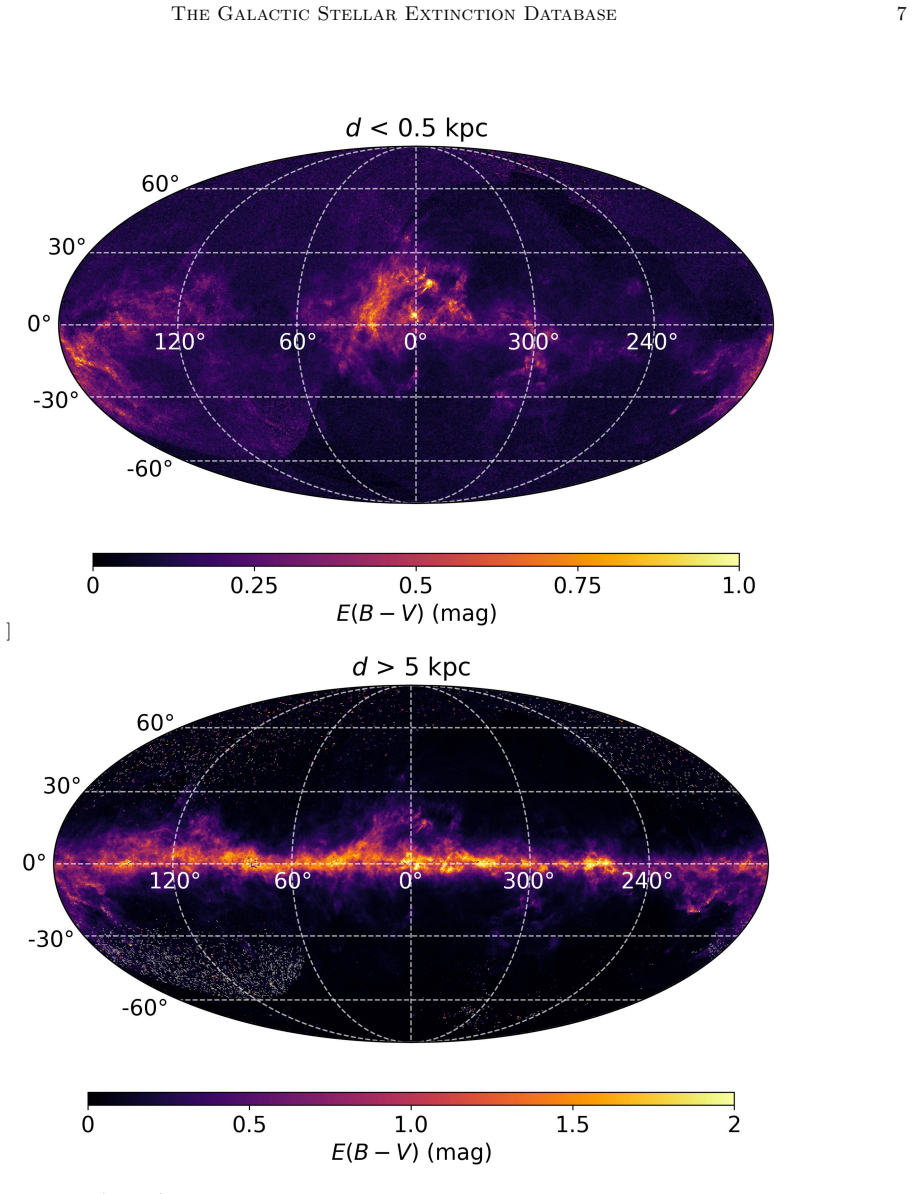
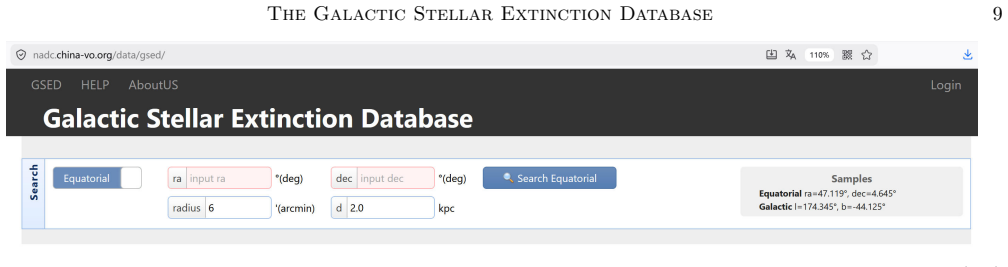
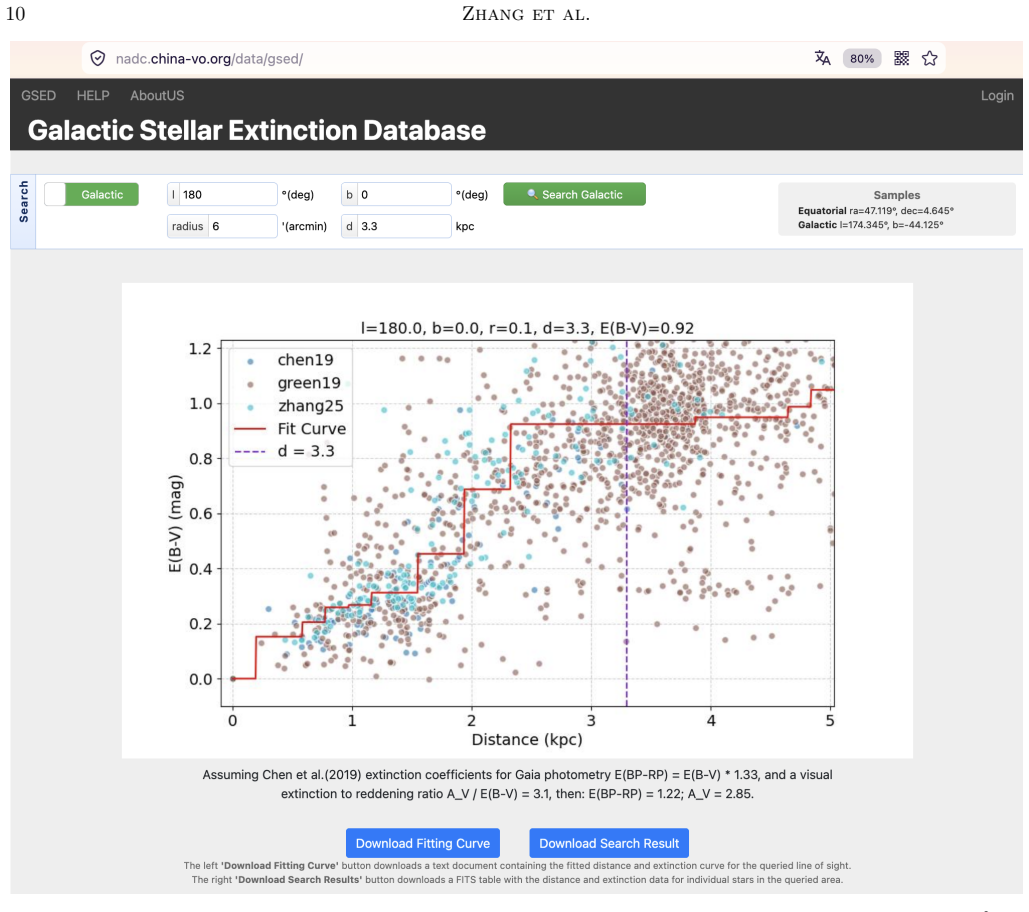
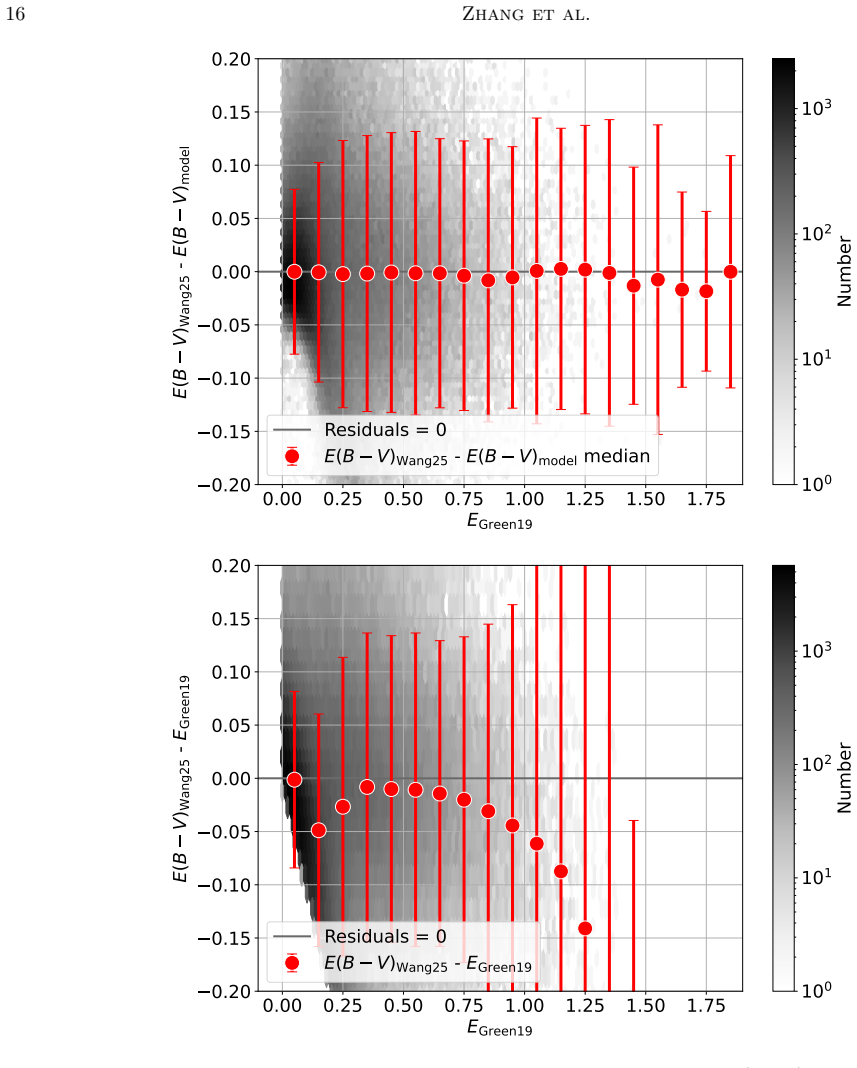
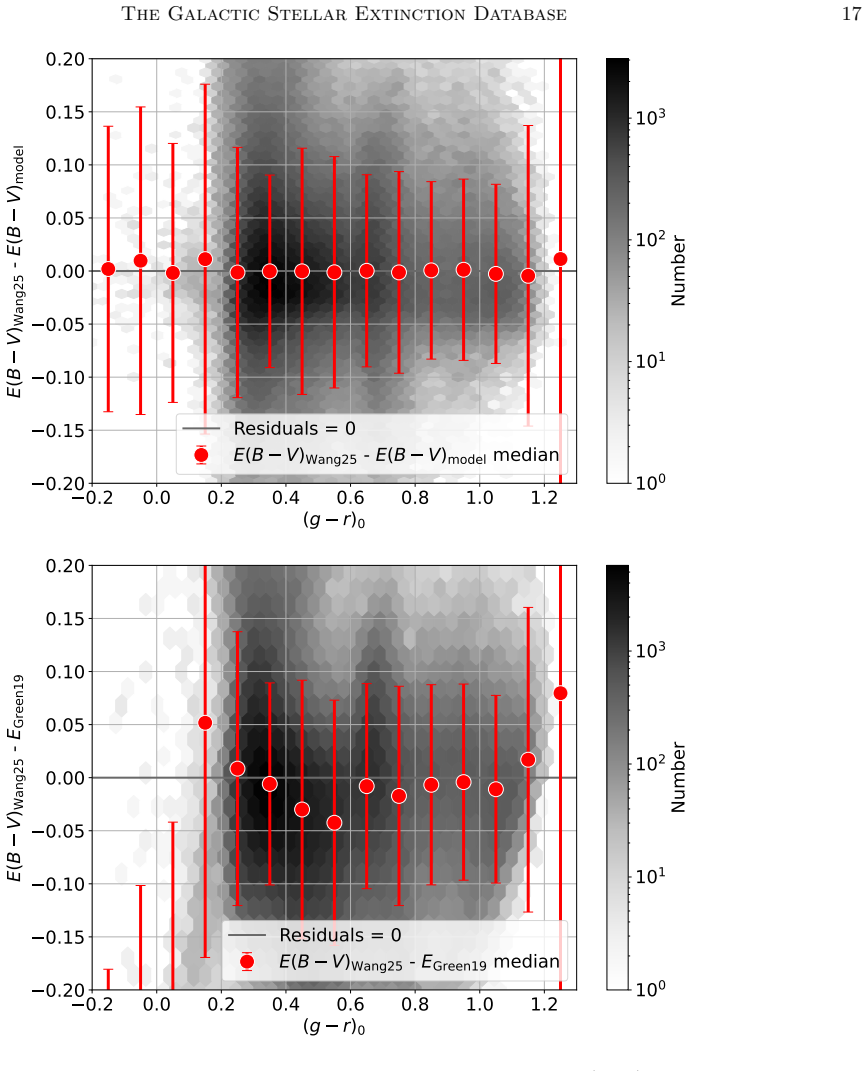
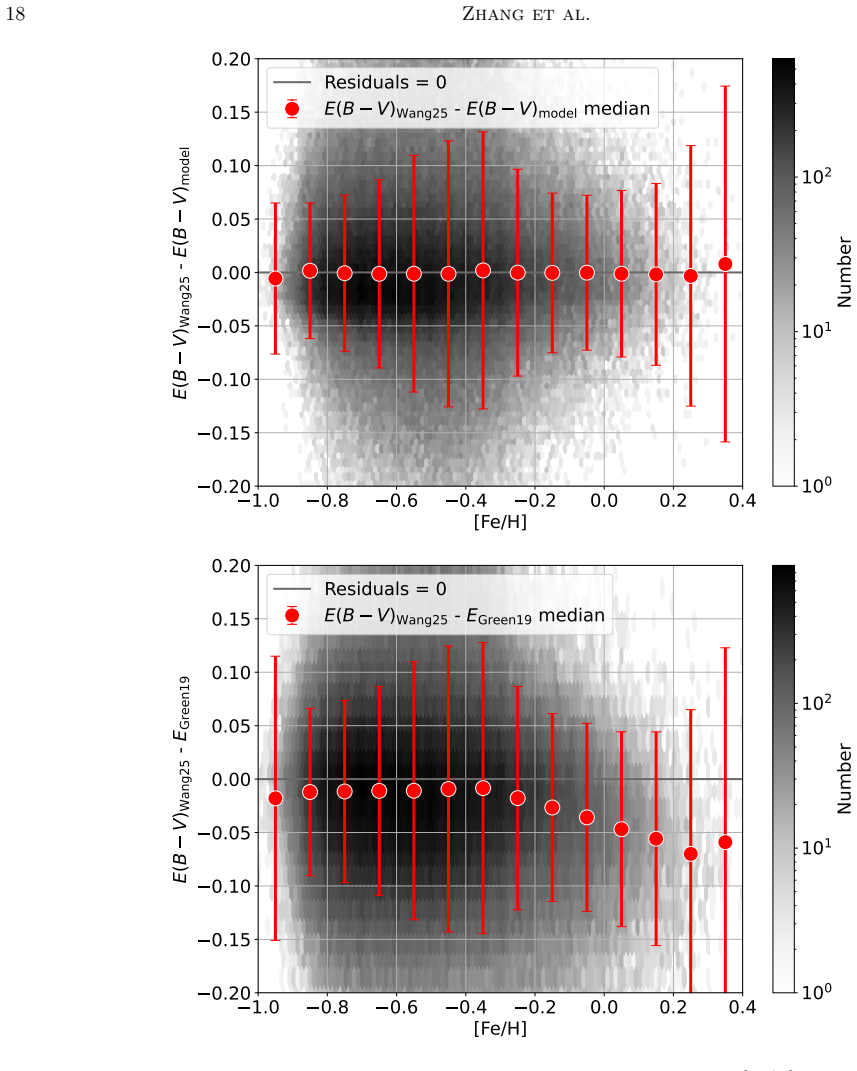
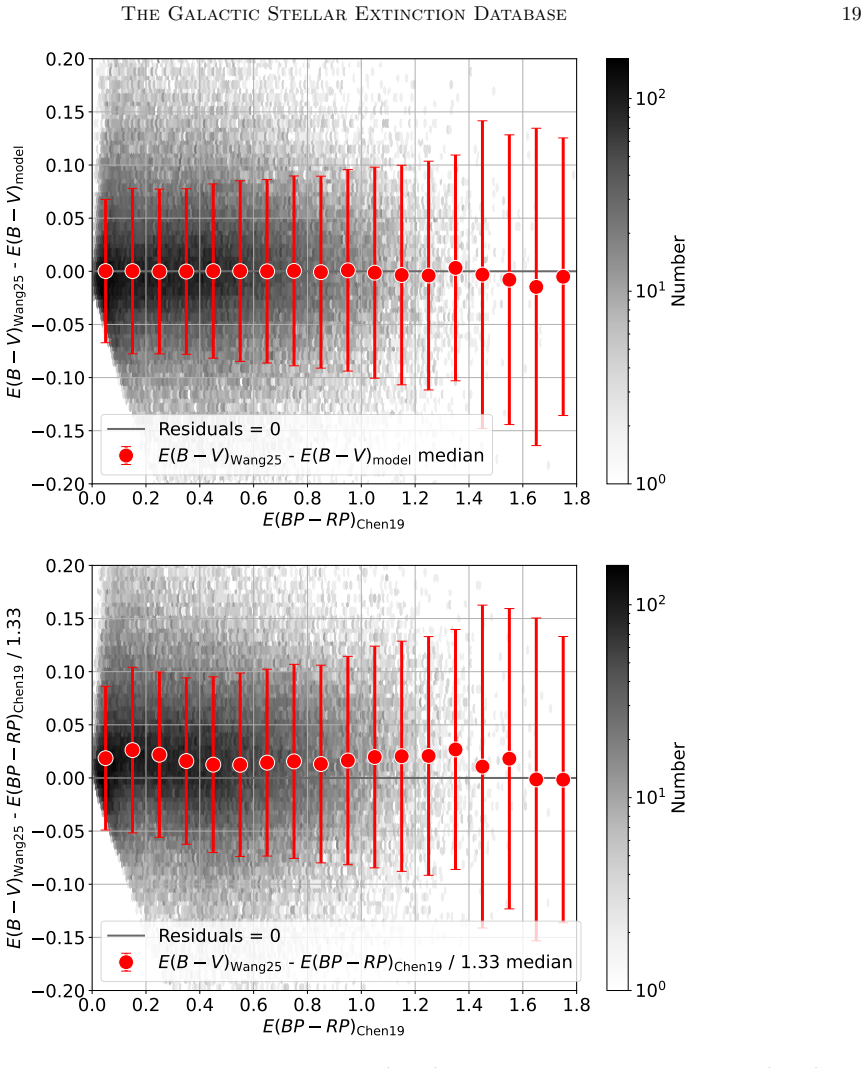
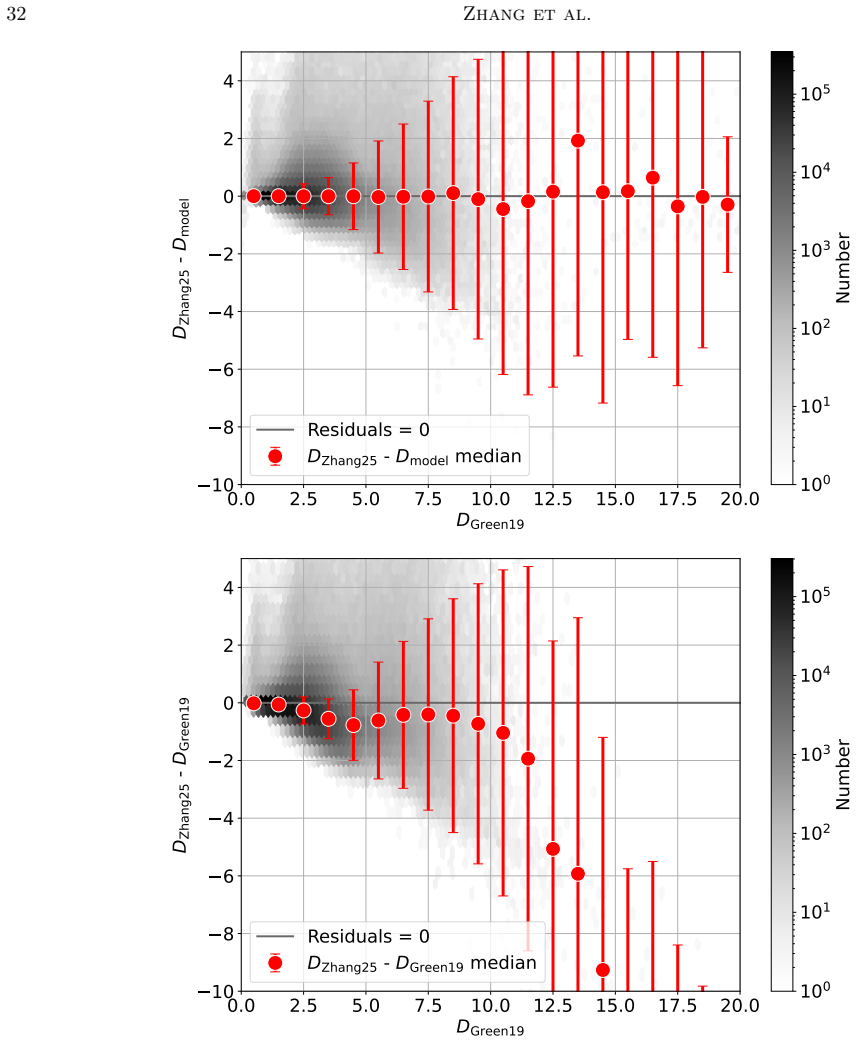
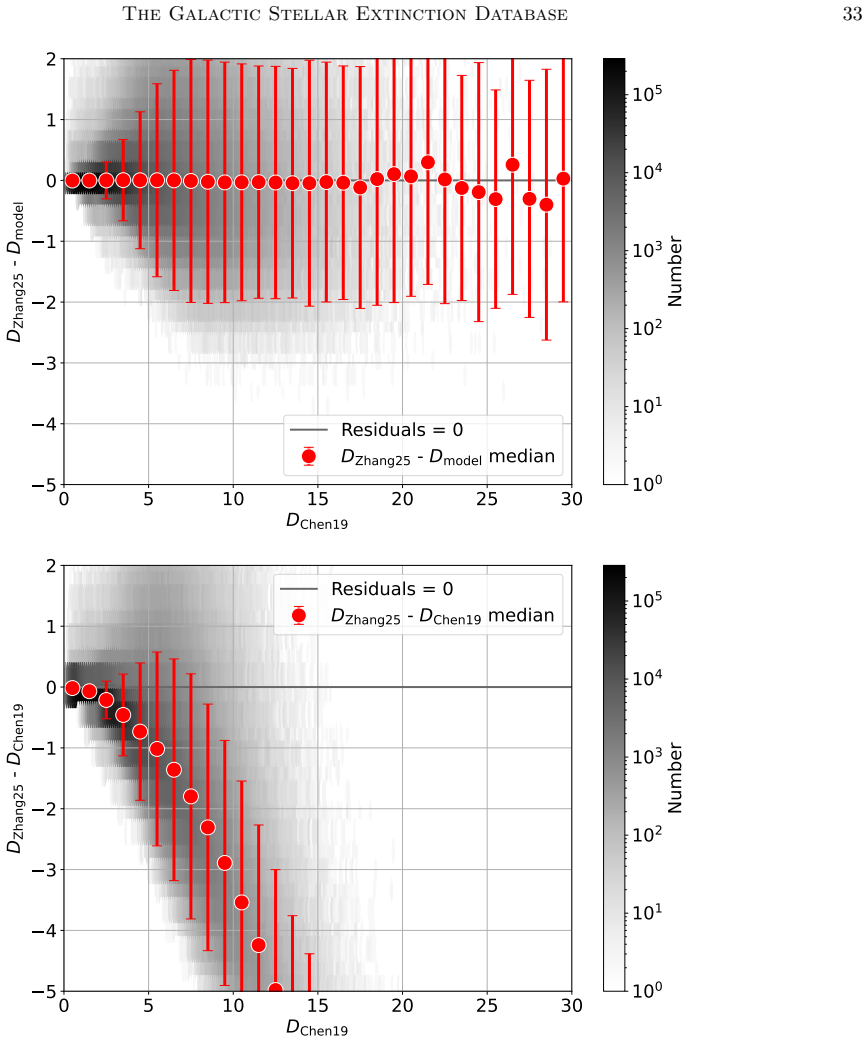
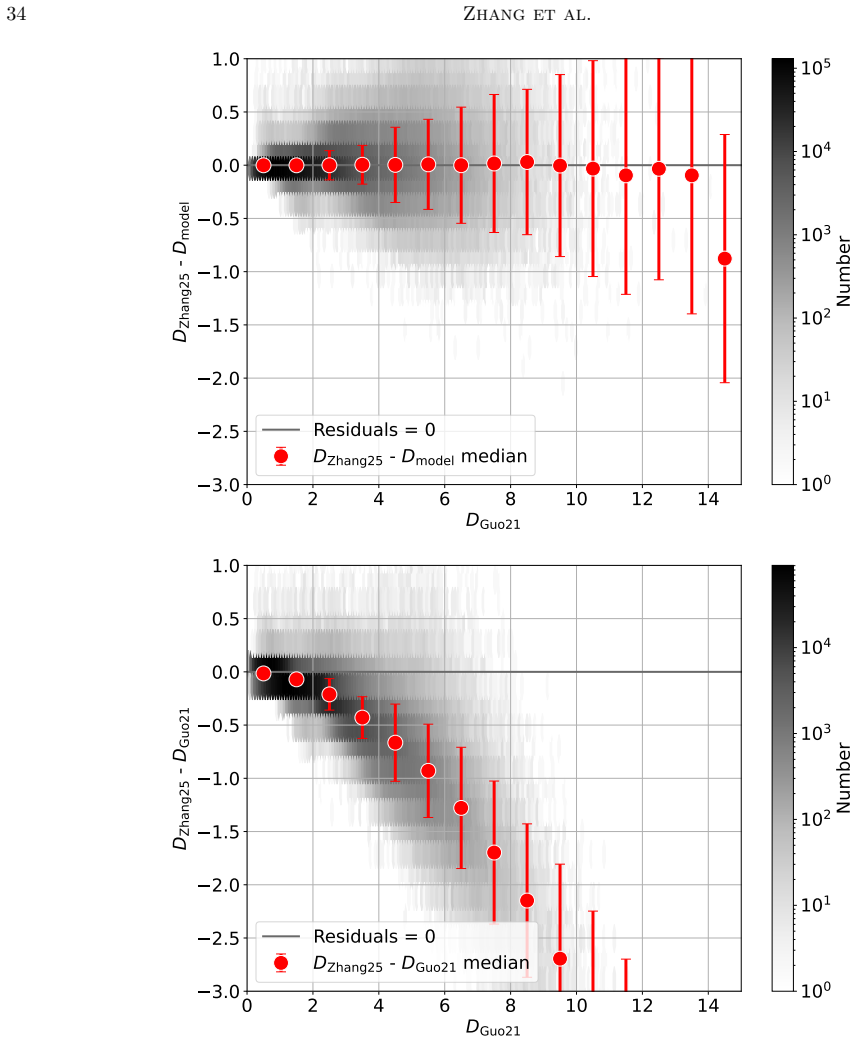
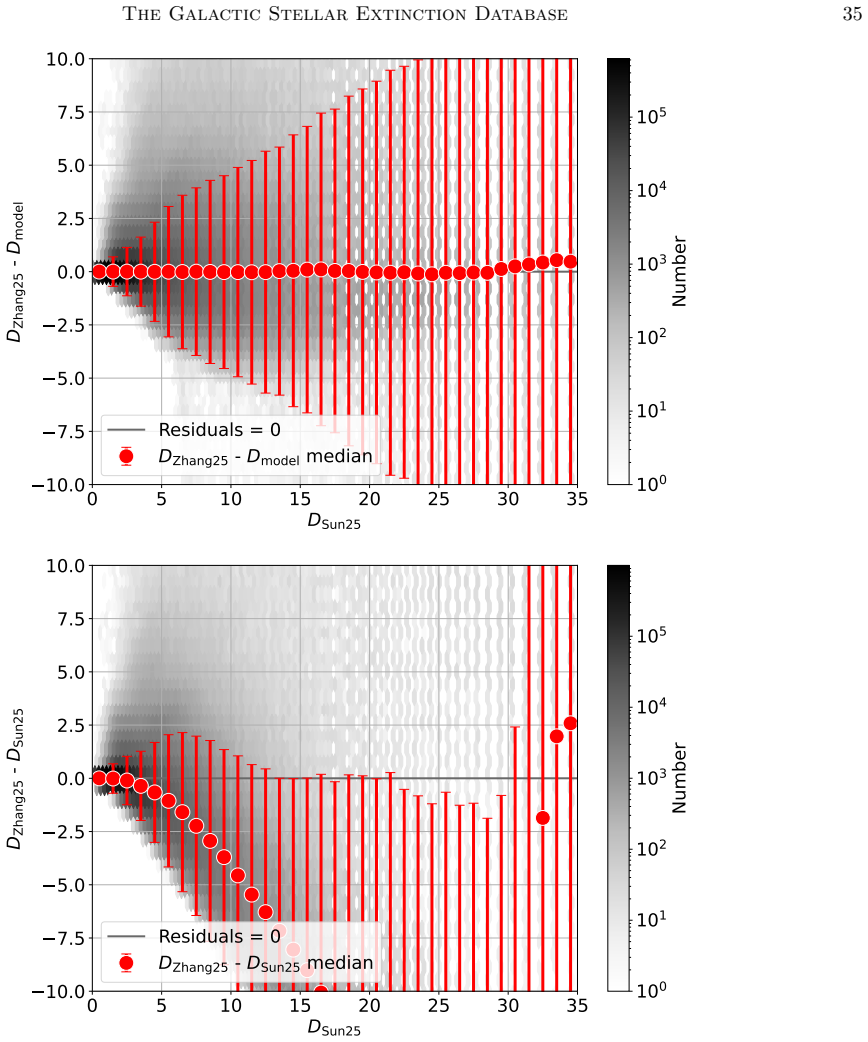
The authors trained a six-layer multilayer perceptron on six heterogeneous 3D extinction catalogues to correct for systematic offsets in both extinction and distance. Application of the trained models produces a catalogue of more than 1.9 billion homogenized entries referenced to a common E(B-V) and parallax-distance baseline. The catalogue is served through a real-time query interface that accepts coordinates and a search radius, retrieves the data, fits the distance-extinction relation, and returns E(B-V) together with E(G_BP-G_RP) and A_V while permitting download of the raw points and the fitted curve.
What carries the argument
A six-layer multilayer perceptron trained to remove systematic differences in extinction and distance across the input catalogues.
If this is right
- Extinction corrections are supplied as individual stellar measurements that can be re-fitted per line of sight instead of fixed voxel values.
- New extinction catalogues can be added to the training set while preserving the common reference scale.
- The service returns three related extinction quantities (E(B-V), E(G_BP-G_RP), A_V) for each query.
- Raw catalogue entries remain accessible alongside the fitted distance-extinction curve for any chosen sky position.
Where Pith is reading between the lines
- The homogenized catalogue could be cross-matched with spectroscopic surveys to test whether the corrected extinctions improve consistency with independent reddening indicators.
- Lines of sight with large residuals after the distance-extinction fit could flag regions where the input maps disagree most strongly.
- The same neural-network approach might be applied to future Gaia data releases to maintain the database without rebuilding the entire training procedure.
Load-bearing premise
The multilayer perceptron removes the original catalogue offsets without adding new systematic errors that would affect later scientific use.
What would settle it
Direct comparison of the homogenized E(B-V) values against extinction measurements from an independent survey not included in the training set, restricted to the same lines of sight and distance range.
Figures
read the original abstract
Reliable extinction correction is essential for nearly all astrophysical studies within the Galaxy. We present the Galactic Stellar Extinction Database (GSED, https://nadc.china-vo.org/data/gsed/), a homogenised database that unifies six representative 3D extinction datasets under a common $E(B-V)$ and parallax-distance baseline. A six-layer multilayer perceptron is designed to correct the systematic differences in both extinction and distance across the heterogeneous input catalogues. Applying the trained models yields a catalogue of over 1.9 billion homogenised entries, which is built into a publicly accessible, real-time query service: a user supplies a coordinate and a search radius, the system retrieves the data, fits the distance--extinction relation, returns $E(B-V)$ together with $E(G_{\rm BP}-G_{\rm RP})$ and $A_V$, and allows the raw catalogue and the fitted curve to be downloaded. By delivering extinction as raw stellar measurements rather than voxelised map products and retaining the capacity to incorporate future datasets, GSED provides a flexible, traceable, and extensible new tool for Galactic extinction correction and dust-structure studies.
Editorial analysis
A structured set of objections, weighed in public.
Referee Report
Summary. The paper presents the Galactic Stellar Extinction Database (GSED), a homogenized catalog unifying six heterogeneous 3D extinction datasets into over 1.9 billion entries under a common E(B-V) and parallax-distance baseline. A six-layer multilayer perceptron is used to correct systematic offsets in extinction and distance; the resulting catalog is served via a public real-time query interface that accepts coordinates and radius, fits the distance-extinction relation, and returns E(B-V), E(G_BP-G_RP), and A_V along with downloadable raw data and fitted curves.
Significance. A validated, publicly queryable database of this scale that retains raw stellar measurements rather than voxelized maps and is designed for future dataset ingestion would constitute a useful infrastructure contribution for Galactic extinction work and dust-structure studies.
major comments (2)
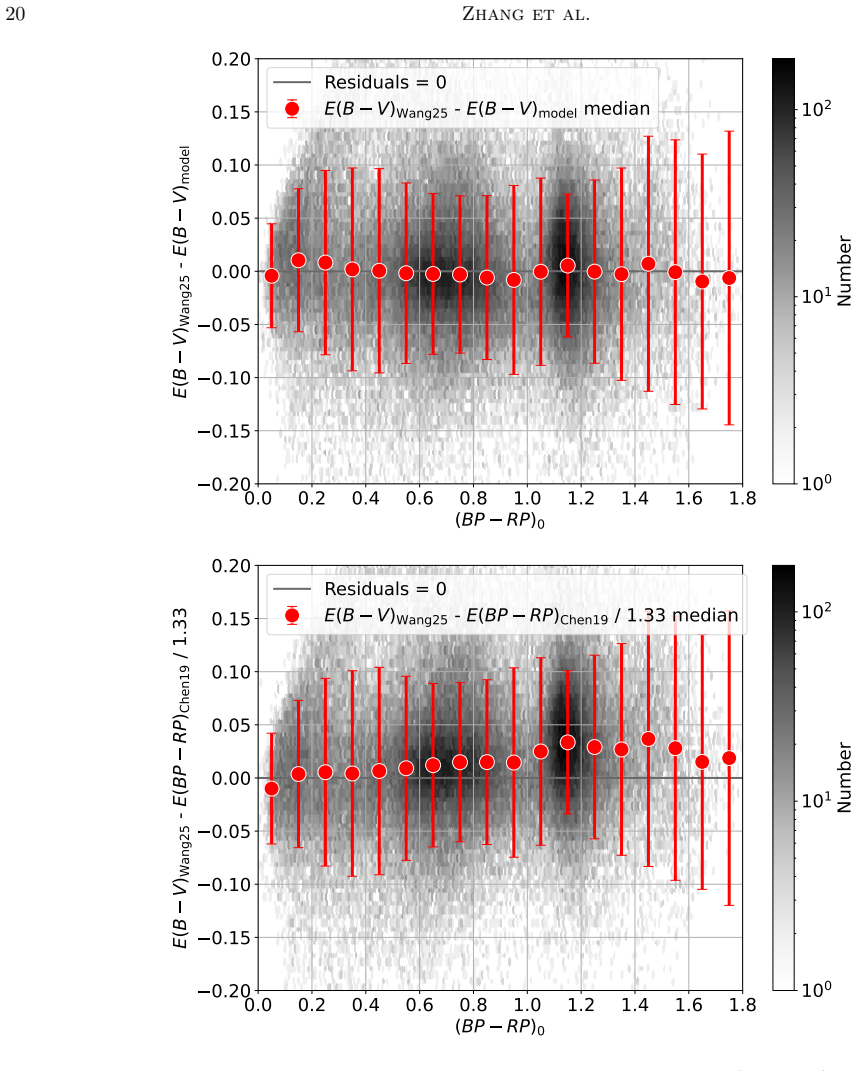
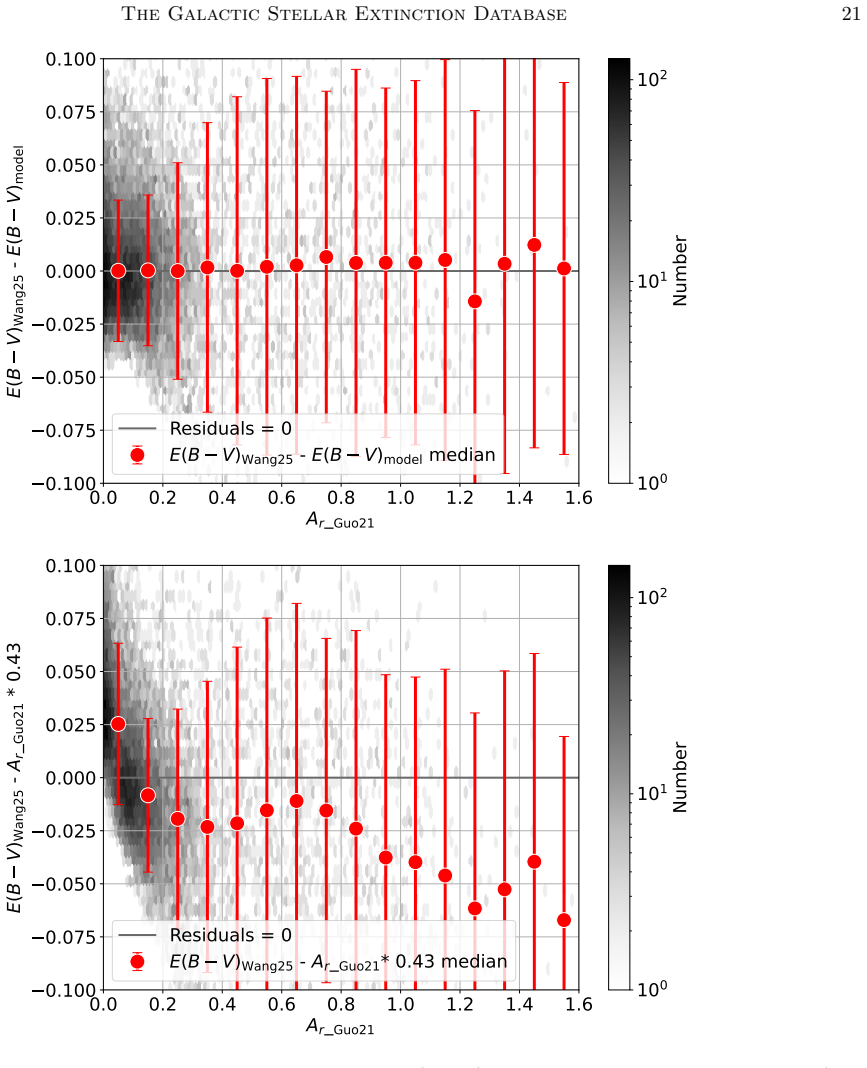
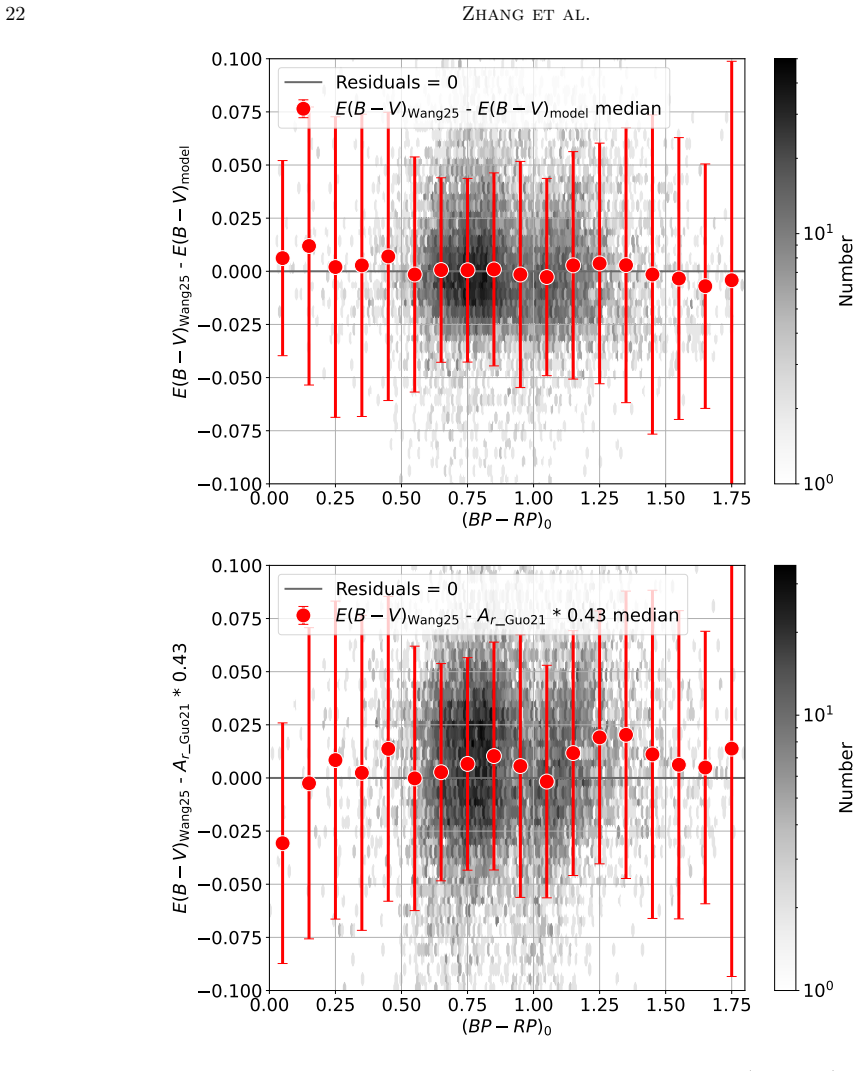
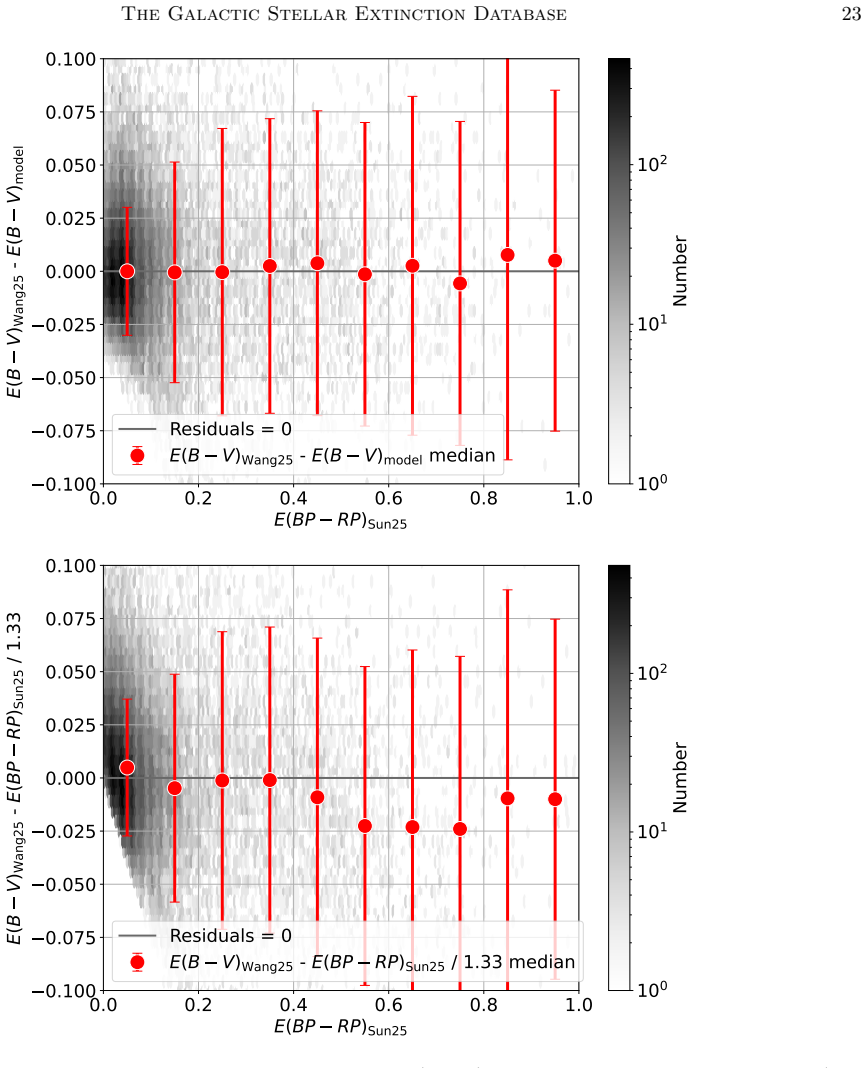
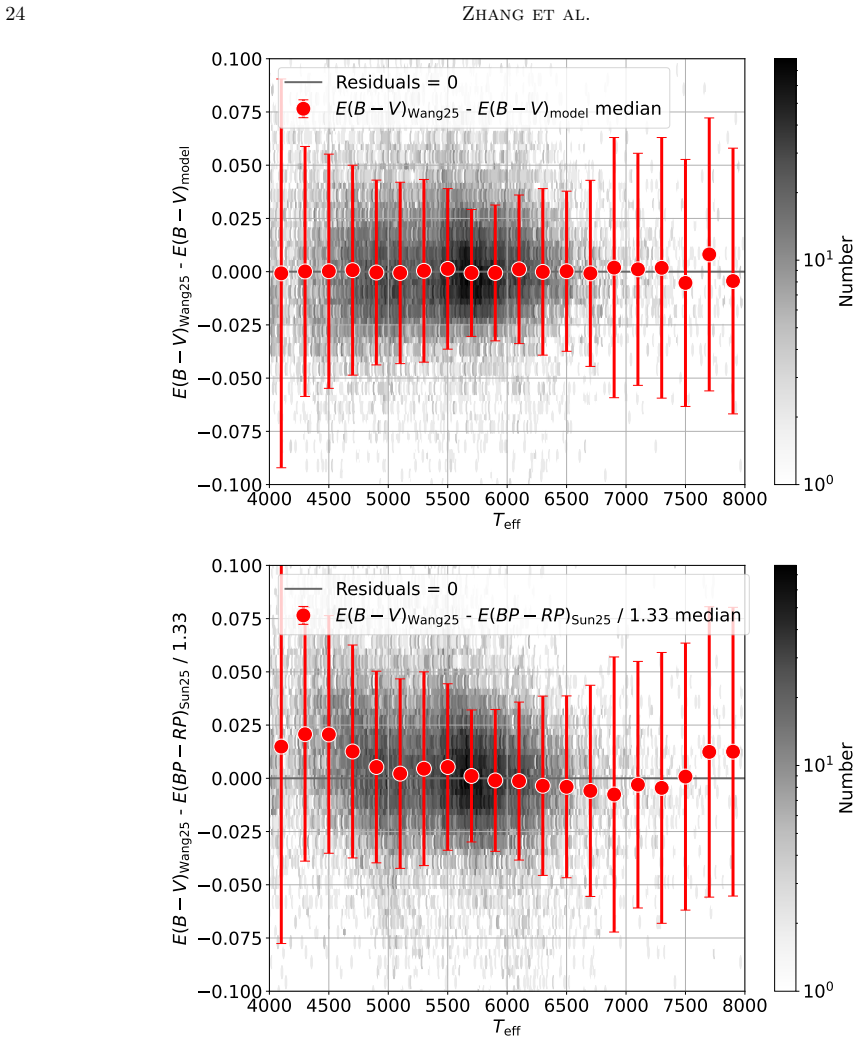
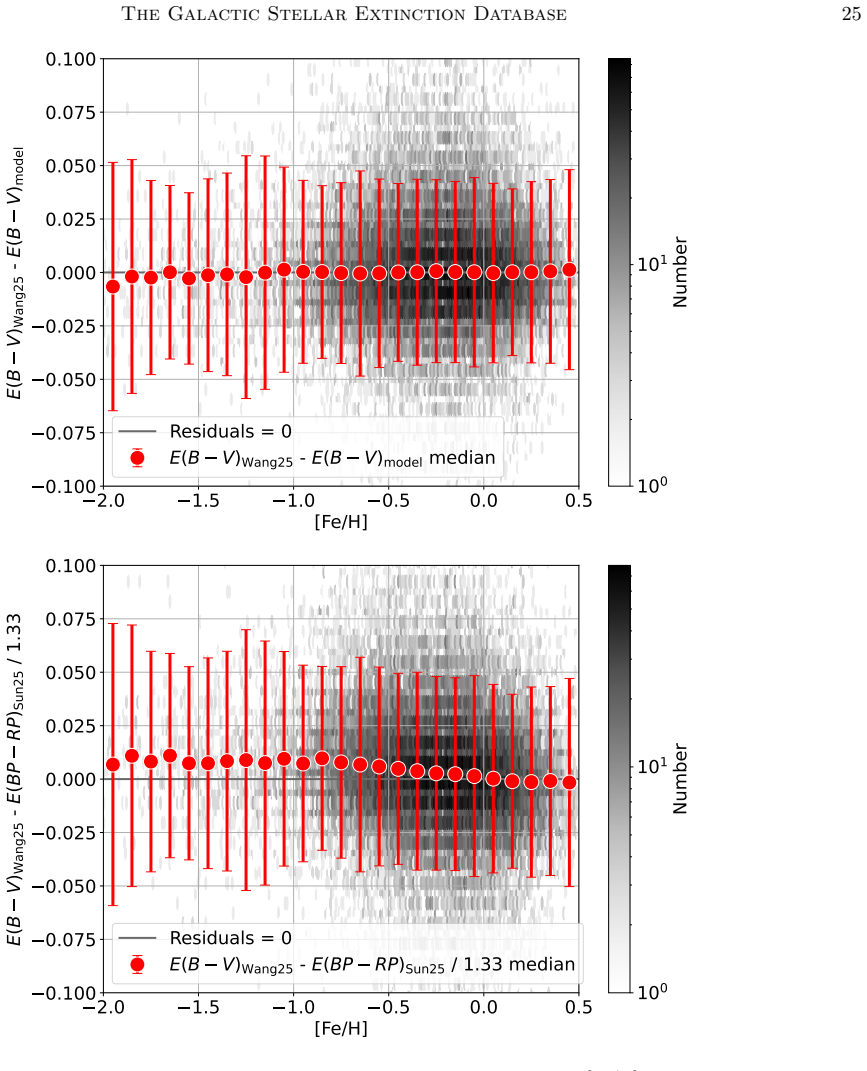
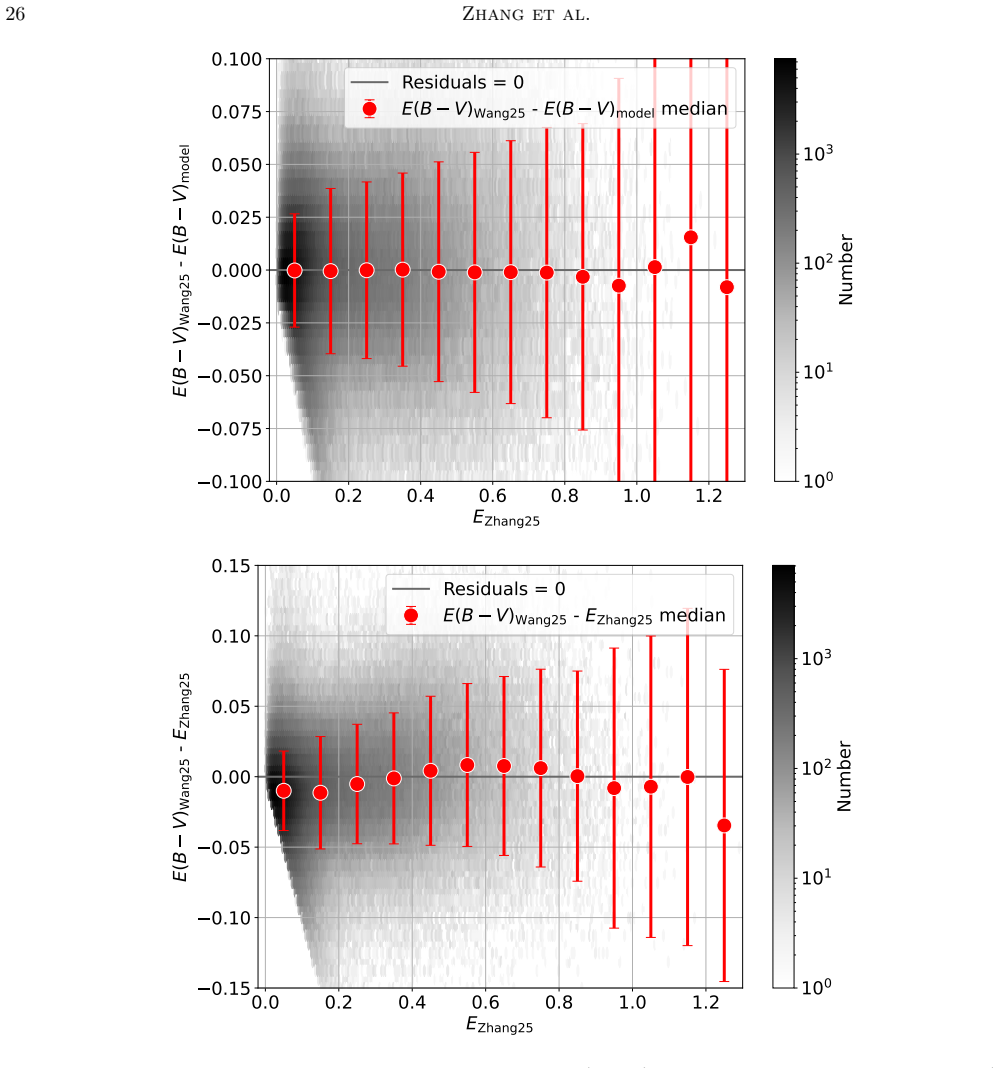
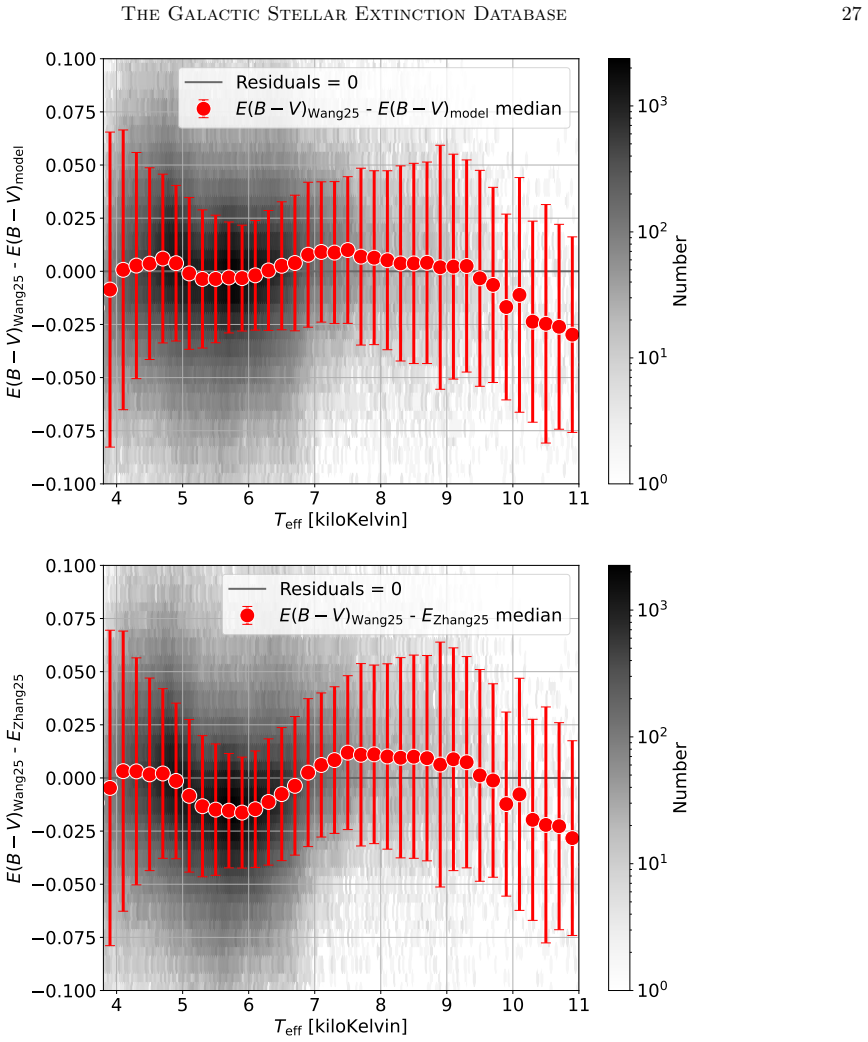
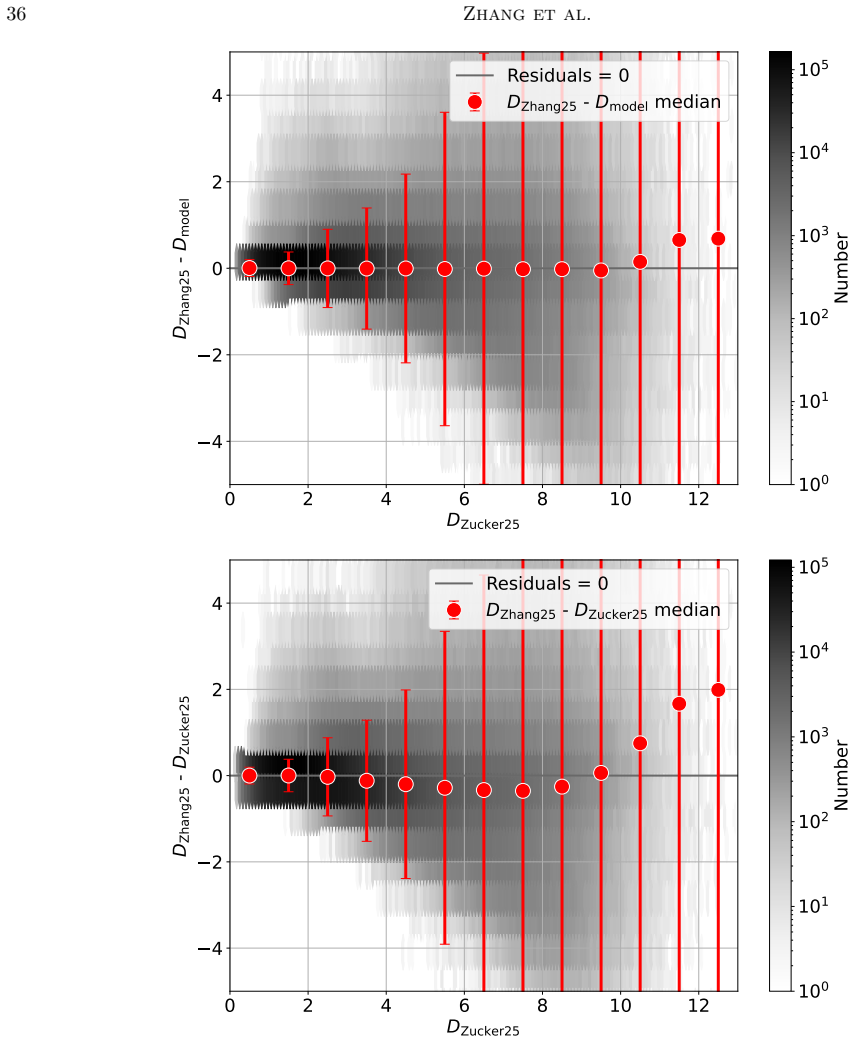
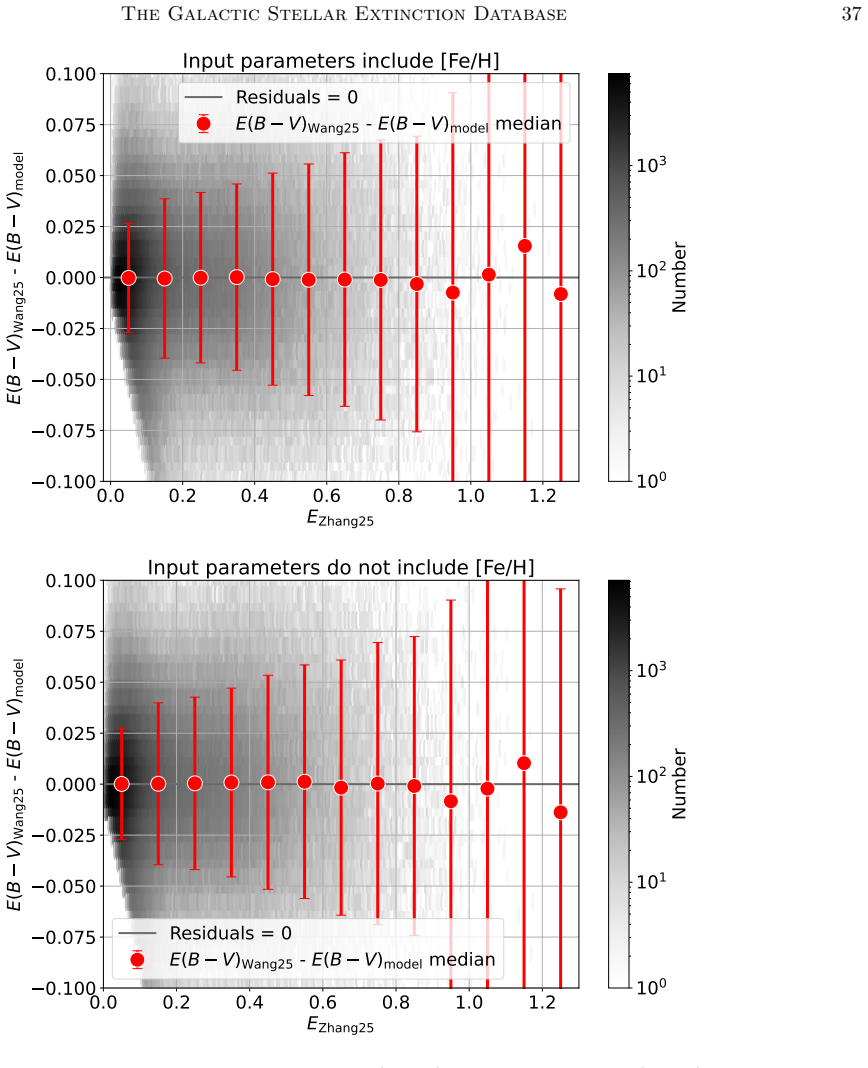
- [Abstract] Abstract: the claim that the six-layer MLP corrects systematic differences across the input catalogs and yields a reliable 1.9-billion-entry product is not supported by any reported quantitative validation; no training/validation splits, regularization details, hold-out performance metrics, or residual comparisons against independent tracers (e.g., Planck dust maps or spectroscopic extinctions) are described, leaving open the possibility that systematics are remapped rather than removed.
- [Abstract] Abstract and method description: the weakest assumption—that the MLP learns only catalog offsets while preserving astrophysical signal—is load-bearing for all downstream use cases, yet no evidence is supplied on performance in low-density or high-extinction regimes where the input catalogs disagree most.
minor comments (2)
- The manuscript would benefit from an explicit table listing the six input catalogs, their sky coverage, depth, and reference publications.
- Notation for the output quantities (E(B-V), E(G_BP-G_RP), A_V) should be defined at first use with the adopted extinction law or conversion coefficients.
Simulated Author's Rebuttal
We thank the referee for the constructive comments, which highlight the need for stronger quantitative support for the MLP homogenization. We will revise the manuscript to address these points directly.
read point-by-point responses
-
Referee: [Abstract] Abstract: the claim that the six-layer MLP corrects systematic differences across the input catalogs and yields a reliable 1.9-billion-entry product is not supported by any reported quantitative validation; no training/validation splits, regularization details, hold-out performance metrics, or residual comparisons against independent tracers (e.g., Planck dust maps or spectroscopic extinctions) are described, leaving open the possibility that systematics are remapped rather than removed.
Authors: We agree that the current version of the manuscript does not report these validation details. In the revised manuscript we will add a dedicated methods subsection that specifies the training/validation split (80/20 random split with no spatial overlap), regularization (dropout rate 0.2 plus L2), hold-out MSE and MAE on the validation set, and residual maps comparing GSED outputs to Planck 353 GHz dust emission and to spectroscopic extinctions from APOGEE and LAMOST. These additions will directly test whether offsets are removed rather than remapped. revision: yes
-
Referee: [Abstract] Abstract and method description: the weakest assumption—that the MLP learns only catalog offsets while preserving astrophysical signal—is load-bearing for all downstream use cases, yet no evidence is supplied on performance in low-density or high-extinction regimes where the input catalogs disagree most.
Authors: We acknowledge that regime-specific validation is essential. The revision will include new figures and text that isolate low-density (high-latitude) and high-extinction (inner-disk) subsets where the input catalogs show the largest discrepancies, reporting both the reduction in catalog-to-catalog scatter after homogenization and the agreement with independent tracers in those regimes. This will provide direct evidence that astrophysical signal is retained. revision: yes
Circularity Check
No circularity: homogenization via trained MLP is an independent processing step
full rationale
The paper trains a six-layer MLP to correct systematic offsets between six input 3D extinction catalogues and then applies the model to generate >1.9 billion homogenized entries. No equation, definition, or self-citation reduces the delivered E(B-V) values to a quantity that is identical to the input data by construction. The MLP parameters are learned from the heterogeneous inputs, but the output catalogue is a transformed product rather than a tautological renaming or direct reuse of the fitted values. No load-bearing self-citation chain or uniqueness theorem is invoked. The derivation chain is therefore self-contained against external benchmarks.
Axiom & Free-Parameter Ledger
free parameters (1)
- MLP weights and biases
axioms (1)
- domain assumption The six representative 3D extinction datasets share a common underlying dust distribution that can be recovered after systematic correction.
Reference graph
Works this paper leans on
-
[1]
Am \^o res , E. B., Jesus , R. M., Moitinho , A., et al. 2021, , 508, 1788, 10.1093/mnras/stab2248
-
[2]
2012, , 757, 166, 10.1088/0004-637X/757/2/166
Berry , M., Ivezi \'c , Z ., Sesar , B., et al. 2012, , 757, 166, 10.1088/0004-637X/757/2/166
-
[3]
Chambers , K. C., Magnier , E. A., Metcalfe , N., et al. 2016, arXiv e-prints, arXiv:1612.05560, 10.48550/arXiv.1612.05560
work page internal anchor Pith review Pith/arXiv arXiv doi:10.48550/arxiv.1612.05560 2016
-
[4]
2015, , 448, 2187, 10.1093/mnras/stv103
Chen , B.-Q., Liu , X.-W., Yuan , H.-B., Huang , Y., & Xiang , M.-S. 2015, , 448, 2187, 10.1093/mnras/stv103
-
[5]
Q., Schultheis , M., Jiang , B
Chen , B. Q., Schultheis , M., Jiang , B. W., et al. 2013, , 550, A42, 10.1051/0004-6361/201219682
-
[6]
2014, , 443, 1192, 10.1093/mnras/stu1192
Chen , B.-Q., Liu , X.-W., Yuan , H.-B., et al. 2014, , 443, 1192, 10.1093/mnras/stu1192
-
[7]
2019, , 483, 4277, 10.1093/mnras/sty3341
Chen , B.-Q., Huang , Y., Yuan , H.-B., et al. 2019, , 483, 4277, 10.1093/mnras/sty3341
-
[8]
Draine , B. T. 2003, , 41, 241, 10.1146/annurev.astro.41.011802.094840
work page internal anchor Pith review Pith/arXiv arXiv doi:10.1146/annurev.astro.41.011802.094840 2003
-
[9]
2024, , 685, A82, 10.1051/0004-6361/202347628
Edenhofer , G., Zucker , C., Frank , P., et al. 2024, , 685, A82, 10.1051/0004-6361/202347628
-
[10]
Gaia Collaboration , Brown , A. G. A., Vallenari , A., et al. 2018, , 616, A1, 10.1051/0004-6361/201833051
work page internal anchor Pith review doi:10.1051/0004-6361/201833051 2018
-
[11]
Gaia Collaboration , Vallenari , A., Brown , A. G. A., et al. 2023, , 674, A1, 10.1051/0004-6361/202243940
-
[12]
Gontcharov , G. A., Marchuk , A. A., Savchenko , S. S., et al. 2025, Research in Astronomy and Astrophysics, 25, 125016, 10.1088/1674-4527/ae12a6
-
[13]
A., Rejkuba , M., Zoccali , M., et al
Gonzalez , O. A., Rejkuba , M., Zoccali , M., et al. 2012, , 543, A13, 10.1051/0004-6361/201219222
-
[14]
Green , G. 2018, The Journal of Open Source Software, 3, 695, 10.21105/joss.00695
-
[15]
Green , G. M., Schlafly , E., Zucker , C., Speagle , J. S., & Finkbeiner , D. 2019, , 887, 93, 10.3847/1538-4357/ab5362
work page internal anchor Pith review doi:10.3847/1538-4357/ab5362 2019
-
[16]
Green , G. M., Schlafly , E. F., Finkbeiner , D. P., et al. 2015, , 810, 25, 10.1088/0004-637X/810/1/25
-
[17]
Green , G. M., Schlafly , E. F., Finkbeiner , D., et al. 2018, , 478, 651, 10.1093/mnras/sty1008
-
[18]
2021, , 906, 47, 10.3847/1538-4357/abc68a
Guo , H.-L., Chen , B.-Q., Yuan , H.-B., et al. 2021, , 906, 47, 10.3847/1538-4357/abc68a
-
[19]
Hanson , R. J., Bailer-Jones , C. A. L., Burgett , W. S., et al. 2016, , 463, 3604, 10.1093/mnras/stw2240
-
[20]
Parallax bias versus magnitude, colour, and position
Lindegren , L., Bastian , U., Biermann , M., et al. 2021, , 649, A4, 10.1051/0004-6361/202039653
-
[21]
Marshall , D. J., Robin , A. C., Reyl \'e , C., Schultheis , M., & Picaud , S. 2006, , 453, 635, 10.1051/0004-6361:20053842
-
[22]
Planck Collaboration , Abergel , A., Ade , P. A. R., et al. 2014, , 571, A11, 10.1051/0004-6361/201323195
-
[23]
Saydjari , A. K., Schlafly , E. F., Lang , D., et al. 2023, , 264, 28, 10.3847/1538-4365/aca594
-
[24]
Maps of Dust IR Emission for Use in Estimation of Reddening and CMBR Foregrounds
Schlegel , D. J., Finkbeiner , D. P., & Davis , M. 1998, , 500, 525, 10.1086/305772
work page internal anchor Pith review doi:10.1086/305772 1998
-
[25]
Interstellar extinction towards the inner Galactic Bulge
Schultheis , M., Ganesh , S., Simon , G., et al. 1999, , 349, L69, 10.48550/arXiv.astro-ph/9908349
work page internal anchor Pith review Pith/arXiv arXiv doi:10.48550/arxiv.astro-ph/9908349 1999
-
[26]
Schultheis , M., Chen , B. Q., Jiang , B. W., et al. 2014, , 566, A120, 10.1051/0004-6361/201322788
-
[27]
2022, , 514, 4398, 10.1093/mnras/stac1615
Shen , H., Chen , B.-Q., Guo , H.-L., et al. 2022, , 514, 4398, 10.1093/mnras/stac1615
-
[28]
Skrutskie , M. F., Cutri , R. M., Stiening , R., et al. 2006, , 131, 1163, 10.1086/498708
-
[29]
2023, , 166, 126, 10.3847/1538-3881/ace5ab
Sun , M., Chen , B., Guo , H., et al. 2023, , 166, 126, 10.3847/1538-3881/ace5ab
-
[30]
2025, Research in Astronomy and Astrophysics, 25, 057002, 10.1088/1674-4527/adc5e1
Sun , M., Chen , B., Sun , B., et al. 2025, Research in Astronomy and Astrophysics, 25, 057002, 10.1088/1674-4527/adc5e1
-
[31]
Trumpler , R. J. 1930, , 42, 214, 10.1086/124039
-
[32]
2025, , 280, 15, 10.3847/1538-4365/adea39
Wang , T., Yuan , H., Chen , B., et al. 2025, , 280, 15, 10.3847/1538-4365/adea39
-
[33]
Wolf , C., Onken , C. A., Luvaul , L. C., et al. 2018, , 35, e010, 10.1017/pasa.2018.5
-
[34]
Yu , J., Casagrande , L., Taylor , J. A., et al. 2026, , 549, stag848, 10.1093/mnras/stag848
-
[35]
Yuan , H. B., Liu , X. W., & Xiang , M. S. 2013, , 430, 2188, 10.1093/mnras/stt039
-
[36]
2023, , 264, 14, 10.3847/1538-4365/ac9dfa
Zhang , R., & Yuan , H. 2023, , 264, 14, 10.3847/1538-4365/ac9dfa
-
[37]
Zhang , X., & Green , G. M. 2025, Science, 387, 1209, 10.1126/science.ado9787
-
[38]
Zhang , X., Green , G. M., & Rix , H.-W. 2023, , 524, 1855, 10.1093/mnras/stad1941
-
[39]
2012, Research in Astronomy and Astrophysics, 12, 723, 10.1088/1674-4527/12/7/002
Zhao , G., Zhao , Y.-H., Chu , Y.-Q., Jing , Y.-P., & Deng , L.-C. 2012, Research in Astronomy and Astrophysics, 12, 723, 10.1088/1674-4527/12/7/002
-
[40]
Zucker , C., Saydjari , A. K., Speagle , J. S., et al. 2025, , 992, 39, 10.3847/1538-4357/adfbe6
discussion (0)
Sign in with ORCID, Apple, or X to comment. Anyone can read and Pith papers without signing in.