REVIEW 3 major objections 4 minor 21 references
A Bayesian network with beta-distributed nodes predicts a driver's rage intensity from facial gestures, finding brow lowering the strongest signal.
Reviewed by Pith at T0; open to challenge. T0 means a machine referee read the full paper against a public rubric. the ladder, T0–T4 →
T0 review · deepseek-v4-flash
2026-08-01 16:16 UTC pith:SIMOJQ4P
load-bearing objection The empirical findings are new but the stated beta model cannot produce the reported posterior because the rage variable hits 0 and 1; the boundary issue is load-bearing. the 3 major comments →
Predicting subjective rage and facial expressions in human driving: A Bayesian network approach with beta-distributed nodes
The pith
A machine-rendered reading of the paper's core claim, the machinery that carries it, and where it could break.
Core claim
In the paper's own terms, the central discovery is that, in a Bayesian network with conditional beta regression nodes, the association structure between facial expressions and subjective rage in drivers is gesture-specific: brow lowering (frowning) is the expression most strongly linked to rage and is more frequently activated by men, while upper lid raising declines during provocation and is unrelated to rage or sex. The model also produces posterior predictive distributions of rage conditional on observed facial intensities, showing a monotonic increase with brow lowering and a decrease with upper lid raising, and a clustering of predicted facial expressions yields three driver profiles wh
What carries the argument
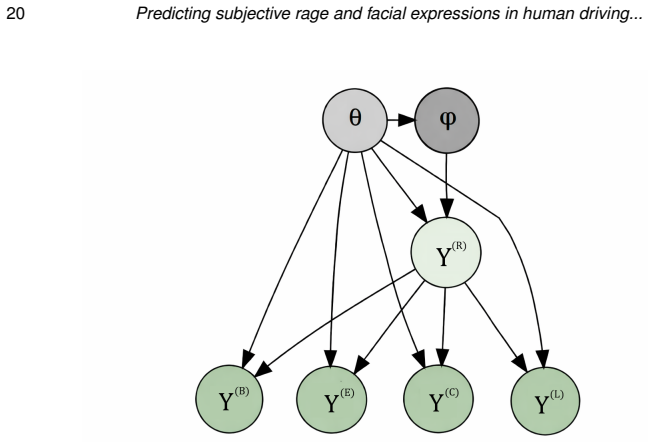
The central object is a Bayesian network in which every observable node follows a conditional beta distribution Be(μ, φ) with mean μ linked to a linear predictor through a logit link. The DAG factorizes the joint distribution into local conditional densities; parent nodes, a sex covariate, an experimental phase variable, and individual random intercepts enter the predictors. The phase is also modeled either as a random node or a fixed covariate, with equivalent estimation results. MCMC approximates the joint posterior and posterior predictive distributions, allowing conditional prediction of rage from observed facial gestures despite the network's nonlinearity.
Load-bearing premise
Every observed variable, including the rage scores that hit exactly 0 and 1, is assumed to follow a beta distribution supported on (0,1), so the model's likelihood assigns zero density to those boundary observations.
What would settle it
A posterior predictive check: if the model is correct, its predicted rage values should reproduce the observed proportion of exact 0s and 1s. Since a beta distribution has zero density at 0 and 1, any such predictions are impossible, so disagreement with the observed boundaries directly falsifies the beta-node specification.
If this is right
- Rage intensity can be predicted from facial gestures alone, without knowing whether the driver is in a stressful phase, because the random-phase model integrates out phase uncertainty.
- Brow lowering acts as a monotonic marker of rage: higher predicted rage accompanies stronger frowning, so driver monitoring systems could use this single channel as a first indicator.
- Men and women differ in brow-lowering expression even after controlling for rage and phase, which matters for calibration of personalized driver-state models.
- The modeling framework extends to any unit-bounded continuous observations in a Bayesian network, beyond facial expressions.
- Treating a discrete experimental phase as either a random node or a fixed covariate yields equivalent WAIC in this dataset, guiding practical BN construction.
Where Pith is reading between the lines
- If the beta assumption fails at the observed rage boundaries (0 and 1), the reported posterior summaries may be artifacts; a zero-one-inflated beta or a transformation would be a safer likelihood for this variable.
- The negative association between upper lid raising and rage could reflect attention or startle rather than emotional containment; measuring gaze or pupil dilation would test this interpretation.
- The three cluster profiles suggest a coarse three-state driver model; a simpler ordinal regression on brow lowering alone might match the predictive performance, which could be checked with leave-one-out predictions.
- Because the dataset aggregates repeated measures and has only 68 records, the credible intervals likely understate uncertainty; a future experiment with unaggregated time-stamped observations would provide a stricter test.
Editorial analysis
A structured set of objections, weighed in public.
Referee Report
Summary. The paper proposes a Bayesian network with beta-distributed nodes and mixed regression structures for modeling unit-bounded continuous variables, and applies it to an experimental driving study (n=34) with subjective rage intensity and four facial action units. Two specifications are considered: phase as a random variable versus as a fixed covariate. The authors report posterior estimates showing that brow lowering is positively associated with rage and is more frequent in men, while upper lid raising decreases under provocation; they also present predictive distributions for rage conditional on facial gestures and identify three driver profiles from clustering. The contribution is positioned as an extension of Bayesian network practice to beta-distributed response nodes, with inference and prediction carried out in a fully Bayesian framework using WinBUGS.
Significance. If the model and results were valid, the paper would make a modest methodological contribution by demonstrating beta-distributed nodes in a Bayesian network and providing a transparent, uncertainty-aware analysis of facial-expression–emotion associations in driving. The public code and explicit prior specifications are positive features. However, the central statistical claims are undermined by a fundamental incompatibility between the stated beta likelihood and the observed rage values, as well as by in-sample variable selection and predictive evaluation. These issues affect every headline conclusion (brow lowering–rage association, upper-lid response to provocation, predictive ability of gestures), so the significance of the contribution cannot be assessed on the current evidence.
major comments (3)
- [§3.3.1, Eq. (3); Table 1] The rage variable Y(R) is modeled as Be(µ(R), φ(R)) with logit link, but Table 1 shows Y(R) has observed minimum 0.0000 and maximum 1.0000. The beta distribution has support (0,1); at y=0 the density is zero when µ(R)φ(R)>1 and infinite when µ(R)φ(R)<1, and analogously at y=1. No zero-one-inflated beta, data transformation, or boundary treatment is described anywhere in the manuscript. Consequently the likelihood of the stated model is not well-defined on the observed data, and the posterior summaries in Table 2 and predictive distributions in Figures 6–7 cannot be the posterior of the model as written. This is load-bearing because all of the paper's substantive conclusions derive from these posterior quantities.
- [§3.2, §4.2] The facial gesture variables were selected after 'exploratory data analysis' of the same 68 observations that are subsequently used for model fitting and predictive evaluation. No cross-validation, hold-out validation, or selection-adjustment procedure is reported. Therefore the predictive distributions in Figures 6–7 and the claim that the network 'predicts rage severity' from facial gestures are in-sample assessments. WAIC does not eliminate the multiple-comparison or selection effects, and the absence of any external or held-out evaluation substantially weakens the predictive claim that is presented as the paper's most important output.
- [§3.3.1, §4.2, Table 3] The phase variable is a fixed experimental condition: each participant contributes exactly one baseline and one stressful measurement, so the vector of 34 zeros and 34 ones is fixed by design. Treating the phase as Ber(p) with a common p for all individuals and all observations imposes a prior over the phase sequence that does not reflect the actual design and that integrates to a constant factor in the likelihood. This constant is exactly why the WAIC values in Table 3 are identical for the two models. The claim that modeling phase as random captures 'inherent uncertainty' about the driver's latent state is not supported; the model simply adds a posterior-independent factor. This does not invalidate the covariate-phase results, but it calls into question the justification for preferring the random-phase model on the basis of predictive flexibility.
minor comments (4)
- [§4.1, Figure 5] The text says 'This information is presented graphically in Figure 2', but the posterior distribution of mean rage by sex and phase appears in Figure 5, not Figure 2 (which is the correlation matrix).
- [§3.2, Table 1] The text states that the data are 'strictly bounded within the (0,1) interval', yet Table 1 reports Y(R) values of exactly 0 and 1. These statements are inconsistent, and the boundary issue should be acknowledged explicitly even if a different outcome variable were used.
- [Table 4 caption] Typo: 'intensit' should be 'intensity'.
- [§3.1] Typo: 'due to the uncertain, dynamic, and noisy nature of the of the underlying variables' contains a duplicated 'of the'.
Circularity Check
No significant circularity: posterior estimates and predictive distributions are ordinary Bayesian computations from a fitted likelihood and prior, not re-statements of the inputs.
full rationale
The paper's central quantities—posterior means/credible intervals for the regression coefficients (Table 2) and the posterior predictive distributions f(y_R* | y_B*, D) and f(y_R* | y_E*, D) (Figures 6–7)—are obtained from the stated beta-regression likelihood, priors, and MCMC sampling. The DAG treats rage Y(R) as a parent of the facial gestures, so predicting rage from gestures is Bayes' rule applied to the fitted joint model; if the association coefficients were zero, the predictive distributions would not shift with gesture intensity. No parameter is preset to force the headline associations, no model output is defined in terms of the target conclusion, and no load-bearing self-citation appears: the references to beta regression (Cribari-Neto and Zeileis, 2010) and WAIC (Vehtari et al., 2017) are standard methodological citations, not prior results by the present authors. The abstract's 'predicts rage severity' is in-sample posterior predictive inference rather than an out-of-sample holdout evaluation, but the paper explicitly defines prediction via the joint posterior predictive distribution in Eq. (6), and this is a legitimate Bayesian operation rather than a circular reduction. The one substantive concern—the beta distribution has support (0,1) while Table 1 lists observed rage values of 0 and 1—is a model-validity/correctness issue about whether the stated likelihood is well-defined at the boundary, not a circularity, and does not raise the circularity score.
Axiom & Free-Parameter Ledger
free parameters (7)
- Rage regression coefficients β(R)_0, β(R)_M, β(R)_Ph =
[-2.58, 0.18, 3.50] posterior means
- Rage random-effect SD σ(R) =
0.77 (95% CI 0.11-1.37)
- Brow-lowering coefficients β(B)_0, β(B)_M, β(B)_Ph, β(B)_R =
[-0.91, 0.41, 0.36, 1.10]
- Upper-lid coefficients β(E)_0, β(E)_M, β(E)_Ph, β(E)_R =
[-0.66, -0.03, -0.43, 0.03]
- Lip-tightener and lip-corner coefficients β(L), β(C) =
Table 2
- Beta precision parameters φ(R), φ(B), φ(E), φ(C), φ(L) =
Not reported
- Phase Bernoulli probability p =
Not reported (prior Be(1,1))
axioms (5)
- standard math DAG factorization into local conditional distributions f(y|θ,ϕ)=∏ f(y(v)|Pa(y(v)),θ,ϕ)
- domain assumption Each continuous node follows a beta distribution Be(μ,φ) with logit link; the beta support is (0,1)
- domain assumption Weakly informative priors N(0,10²), Ga(1,0.1), Be(1,1), U(0,1000)
- ad hoc to paper Phase is modeled as Bernoulli(p) common to all individuals despite experimental design fixing one baseline and one stress measurement per participant
- domain assumption Random intercepts appear only in the rage model; gesture models have no individual random effects
invented entities (1)
-
Three driver profiles A, B, C
no independent evidence
read the original abstract
A Bayesian network framework is proposed for modelling unit-bounded continuous variables using conditional beta-distributed nodes within a fully Bayesian inference setting. The model captures conditional dependencies and propagates uncertainty through the network, with inference performed via Markov Chain Monte Carlo methods implemented in WinBUGS. The framework is applied to an experimental study of emotional and facial responses, focusing on rage intensity and facial gestures. Results show that brow lowering is strongly associated with rage intensity and is more frequent in men, whereas upper lid raising decreases under provocation independently of rage or sex. The model also predicts rage severity from informative facial gestures.
Figures




Reference graph
Works this paper leans on
-
[1]
Forbes, J., Huang, T., Kanazawa, K., and Russell, S. (1995). The BATmobile: Towards A Bayesian Automated Taxi. IJCAI 95, 1878--1885
1995
-
[2]
Pearl, J. (1995). From Bayesian Networks to Causal Networks. In Mathematical Models for Handling Partial Knowledge in Artificial Intelligence , 157--182
1995
-
[3]
Ben-Gal, I. (2008). Bayesian Networks. Encyclopedia of Statistics in Quality and Reliability
2008
-
[4]
and Zeileis, A
Cribari-Neto, F. and Zeileis, A. (2010). Beta Regression in R. Journal of Statistical Software 34(2), 1--24
2010
-
[5]
G., Dawid, A
Cowell, R. G., Dawid, A. P., Lauritzen, S. L., and Spiegelhalter, D. J. (1999). Probabilistic Networks and Expert Systems . Springer
1999
-
[6]
Gelman, A. (2006). Prior Distributions for Variance Parameters in Hierarchical Models (comment on article by Browne and Draper). Bayesian Analysis 1(3), 515--534
2006
-
[7]
Wang, K., Wang, Y., Liu, B., and Chen, J. (2023). Quantification of Uncertainty and Its Applications to Complex Domain for Autonomous Vehicles Perception System. IEEE Transactions on Instrumentation and Measurement 72, 1--17
2023
-
[8]
Hubmann, C., Becker, M., Althoff, D., Lenz, D., and Stiller, C. (2017). Decision Making for Autonomous Driving Considering Interaction and Uncertain Prediction of Surrounding Vehicles. In 2017 IEEE Intelligent Vehicles Symposium (IV) , 1671--1678
2017
-
[9]
Egger, M., Ley, M., and Hanke, S. (2016). Emotion Recognition from Physiological Signal Analysis: A Review. Electronic Notes in Theoretical Computer Science 343, 35--55
2016
-
[10]
and Abou-Zeid, H
AbuAli, N. and Abou-Zeid, H. (2016). Driver Behavior Modeling: Developments and Future Directions. International Journal of Vehicular Technology 2016, 6952791
2016
-
[11]
J., Thomas, A., Best, N., and Spiegelhalter, D
Lunn, D. J., Thomas, A., Best, N., and Spiegelhalter, D. (2000). WinBUGS--A Bayesian Modelling Framework: Concepts, Structure, and Extensibility. Statistics and Computing 10(4), 325--337
2000
-
[12]
Babakov, N., Sivaprasad, A., Reiter, E., and Bugarín-Diz, A. (2025). Reusability of Bayesian Networks Case Studies: A Survey. Applied Intelligence 55(6), 417
2025
-
[13]
and Woodberry, O
Mascaro, S. and Woodberry, O. (2022). A Flexible Method for Parameterizing Ranked Nodes in Bayesian Networks Using Beta Distributions. Risk Analysis 42(6), 1179--1195
2022
-
[14]
J., Bradford, J
Needham, C. J., Bradford, J. R., Bulpitt, A. J., and Westhead, D. R. (2007). A Primer on Learning in Bayesian Networks for Computational Biology. PLoS Computational Biology 3(8), e129
2007
-
[15]
Scutari, M. (2010). Learning Bayesian Networks with the bnlearn R Package. Journal of Statistical Software 35, 1--22
2010
-
[16]
Kratzer, G., Lewis, F., Comin, A., Pittavino, M., and Furrer, R. (2023). Additive Bayesian Network Modeling with the R Package abn. Journal of Statistical Software 105, 1--41
2023
-
[17]
Gelman, A., Hwang, J., and Vehtari, A. (2014). Understanding Predictive Information Criteria for Bayesian Models. Statistics and Computing 24(6), 997--1016
2014
-
[18]
Vehtari, A., Gelman, A., and Gabry, J. (2017). Practical Bayesian Model Evaluation Using Leave-one-out Cross-validation and WAIC. Statistics and Computing 27(5), 1413--1432
2017
-
[19]
Sturtz, S., Ligges, U., and Gelman, A. (2005). R2WinBUGS: A Package for Running WinBUGS from R. Journal of Statistical Software 12, 1--16
2005
-
[20]
B., Martin, K
Prince, E. B., Martin, K. B., Messinger, D. S., and Allen, M. (2015). Facial Action Coding System. Environmental Psychology & Nonverbal Behavior 1
2015
-
[21]
and Friesen, W
Ekman, P. and Friesen, W. V. (1978). Manual for the Facial Action Coding System . Consulting Psychologists Press
1978
discussion (0)
Sign in with ORCID, Apple, or X to comment. Anyone can read and Pith papers without signing in.