The link between magnetic fields and filamentary clouds II: Bimodal linear mass distributions
Pith reviewed 2026-05-25 17:43 UTC · model grok-4.3
The pith
Molecular clouds with long axes perpendicular to magnetic fields show more even linear mass distributions.
A machine-rendered reading of the paper's core claim, the machinery that carries it, and where it could break.
Core claim
By comparing cumulative linear mass profiles of 12 Gould Belt molecular clouds within 500 pc, we find that molecular clouds with the long axes perpendicular to the magnetic field directions show more even distributions of the linear mass. The result supports that magnetic field orientations can affect the fragmentation of molecular clouds.
What carries the argument
Cumulative linear mass profile compared against the angle offset between each cloud's long axis and the local magnetic field direction.
If this is right
- Magnetic field orientation relative to cloud long axis modulates the fragmentation process.
- Perpendicular alignments produce more even linear mass distributions than parallel alignments.
- This orientation dependence provides a physical link between magnetic fields and observed filament properties.
- The effect should appear in any region where the same alignment physics operates.
Where Pith is reading between the lines
- Cloud evolution models would need to treat magnetic field direction as a variable that shapes mass distribution along filaments.
- Surveys extending beyond the Gould Belt could test whether the bimodal pattern holds more generally.
- Magnetohydrodynamic simulations could be checked for matching differences in mass profiles based on initial field-cloud angles.
Load-bearing premise
The measured local magnetic field directions are accurate and representative for each cloud, and the sample selection plus profile construction introduce no systematic biases that create the reported difference.
What would settle it
Re-analysis of the same twelve clouds with independent magnetic field measurements or alternative linear mass profile methods that erases the difference between perpendicular and parallel groups would falsify the claimed link.
Figures
read the original abstract
By comparing cumulative linear mass profiles of 12 Gould Belt molecular clouds within 500 pc, we study how the linear mass distributions of molecular clouds vary with the angles between the molecular cloud long axes and the directions of the local magnetic fields (cloud-field direction offsets). We find that molecular clouds with the long axes perpendicular to the magnetic field directions show more even distributions of the linear mass. The result supports that magnetic field orientations can affect the fragmentation of molecular clouds (Li et al. 2017).
Editorial analysis
A structured set of objections, weighed in public.
Referee Report
Summary. The manuscript compares cumulative linear mass profiles of 12 Gould Belt molecular clouds within 500 pc, partitioned by the angle offset between each cloud's long axis and the local magnetic field direction. It reports that clouds with long axes perpendicular to the field exhibit more even linear-mass distributions and interprets this as evidence that magnetic field orientations affect molecular-cloud fragmentation (building on Li et al. 2017).
Significance. If the reported difference survives detailed methodological checks, the result would supply direct observational support for magnetic fields modulating fragmentation inside filamentary clouds. The use of cumulative profiles is a straightforward way to quantify evenness, but the small sample (N=12) makes the finding sensitive to measurement accuracy and classification choices; no machine-checked derivations or parameter-free predictions are present.
major comments (3)
- [Abstract and sample/methods] Abstract and § on sample/methods: no uncertainties are reported for the local B-field directions used to compute the 12 cloud-field angle offsets, nor are robustness tests against angle errors or alternative classifications provided; with N=12 this partition is load-bearing for the claimed bimodality in linear-mass distributions.
- [Results on cumulative profiles] Results section on cumulative profiles: the criteria for sample selection, the precise definition of linear mass along the long axis, and the construction of the cumulative profiles are not specified, so it is impossible to evaluate whether systematic differences between the two angle groups could arise from profile-construction choices rather than from the field orientation.
- [Statistical comparison] Statistical comparison: no quantitative test (e.g., Kolmogorov-Smirnov statistic or bootstrap confidence intervals) is described for the difference between the two subsamples; without it the visual distinction in the profiles cannot be assessed for significance.
minor comments (2)
- [Data sources] Clarify whether the local B-field directions are taken from the same reference as Li et al. 2017 or measured independently, and state the typical angular uncertainty.
- [Table of clouds] Add a table listing the 12 clouds, their measured angle offsets, group assignment, and any available error estimates.
Simulated Author's Rebuttal
We thank the referee for the detailed and constructive report. The comments identify important areas for improving clarity, reproducibility, and statistical rigor in the manuscript. We address each major comment below and will revise the paper accordingly.
read point-by-point responses
-
Referee: [Abstract and sample/methods] Abstract and § on sample/methods: no uncertainties are reported for the local B-field directions used to compute the 12 cloud-field angle offsets, nor are robustness tests against angle errors or alternative classifications provided; with N=12 this partition is load-bearing for the claimed bimodality in linear-mass distributions.
Authors: We agree that uncertainties in the adopted B-field directions (taken from Planck and literature compilations) should be explicitly reported and propagated, given the small sample. In the revised manuscript we will tabulate the angle offsets with their literature uncertainties and add a robustness section that perturbs the angles within those uncertainties and re-computes the cumulative profiles for both the nominal and alternative angle thresholds (e.g., 30° vs. 45° cuts). revision: yes
-
Referee: [Results on cumulative profiles] Results section on cumulative profiles: the criteria for sample selection, the precise definition of linear mass along the long axis, and the construction of the cumulative profiles are not specified, so it is impossible to evaluate whether systematic differences between the two angle groups could arise from profile-construction choices rather than from the field orientation.
Authors: The referee is correct that these procedural details were insufficiently explicit. The sample comprises the 12 Gould Belt clouds within 500 pc that possess both reliable long-axis orientations and Planck-derived B-field measurements. Linear mass is obtained by integrating Herschel column-density maps along the cloud spine (defined via the FilFinder algorithm) and dividing by the projected length element. Cumulative profiles are formed by ordering the linear-mass segments from one end of the spine to the other and computing the running integral. A new dedicated “Methods” subsection will be added that spells out each step, including the exact spine-tracing parameters and any smoothing applied. revision: yes
-
Referee: [Statistical comparison] Statistical comparison: no quantitative test (e.g., Kolmogorov-Smirnov statistic or bootstrap confidence intervals) is described for the difference between the two subsamples; without it the visual distinction in the profiles cannot be assessed for significance.
Authors: We accept that a purely visual comparison is insufficient. The revised version will include a two-sample Kolmogorov-Smirnov test on the cumulative profiles of the two angle groups, together with bootstrap-derived 68 % and 95 % confidence bands on each profile. These quantitative results will be reported in the text and in a new supplementary figure. revision: yes
Circularity Check
Observational correlation with minor non-load-bearing self-citation
full rationale
The paper reports a direct empirical comparison of cumulative linear-mass profiles across 12 clouds, partitioned by measured cloud-field angle offsets. The reported difference in evenness is a data-derived observation, not a mathematical derivation, fitted parameter, or equation that reduces to its own inputs. The single citation to Li et al. 2017 supplies interpretive context for fragmentation implications but is not invoked to justify the profiles, the partition, or the statistical difference itself. No self-definitional steps, uniqueness theorems, or ansatzes appear in the presented chain.
Axiom & Free-Parameter Ledger
axioms (1)
- domain assumption Local magnetic field directions can be accurately determined and used to compute cloud-field direction offsets for each cloud.
Forward citations
Cited by 1 Pith paper
-
Characterising magnetic fields at the onset of star cluster formation: From giant molecular clouds to infrared dark clumps
Polarization observations reveal scale-dependent differences in magnetic field morphology between molecular clouds and clumps, a velocity-dispersion correlation, and unreliable field-strength estimates that contradict...
Reference graph
Works this paper leans on
-
[1]
J., 2017, A&A, 606, L2 Arzoumanian D., et al., 2011, A&A, 529, L6 Crutcher R
Alves J., Lombardi M., Lada C. J., 2017, A&A, 606, L2 Arzoumanian D., et al., 2011, A&A, 529, L6 Crutcher R. M., 2012, ARA&A, 50, 29 Dobashi K., 2011, PASJ, 63, S1 Federrath C., Klessen R. S., 2013, ApJ, 763, 51 Froebrich D., Rowles J., 2010, MNRAS, 406, 1350 Girichidis P., Konstandin L., Whitworth A. P., Klessen R. S., 2014, ApJ, 781, 91 Goodman A. A., B...
work page 2017
-
[2]
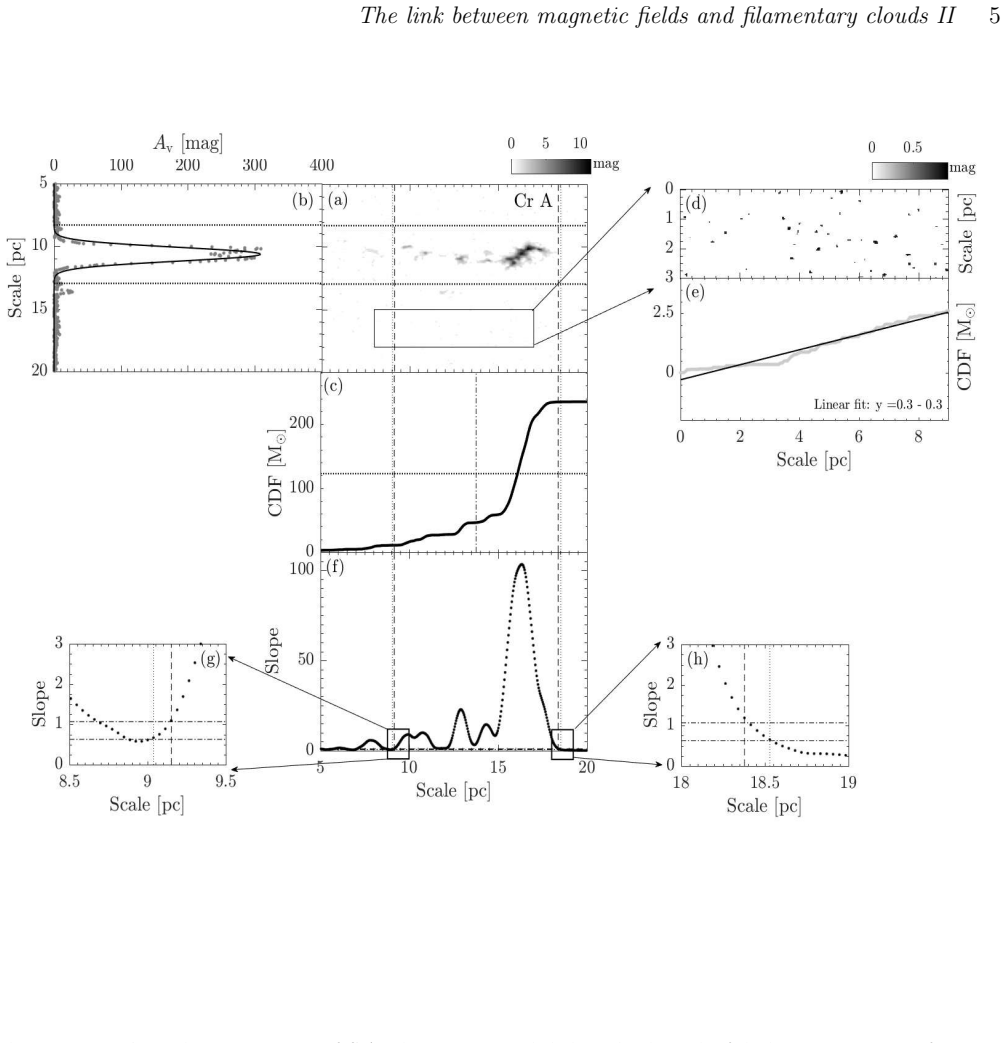
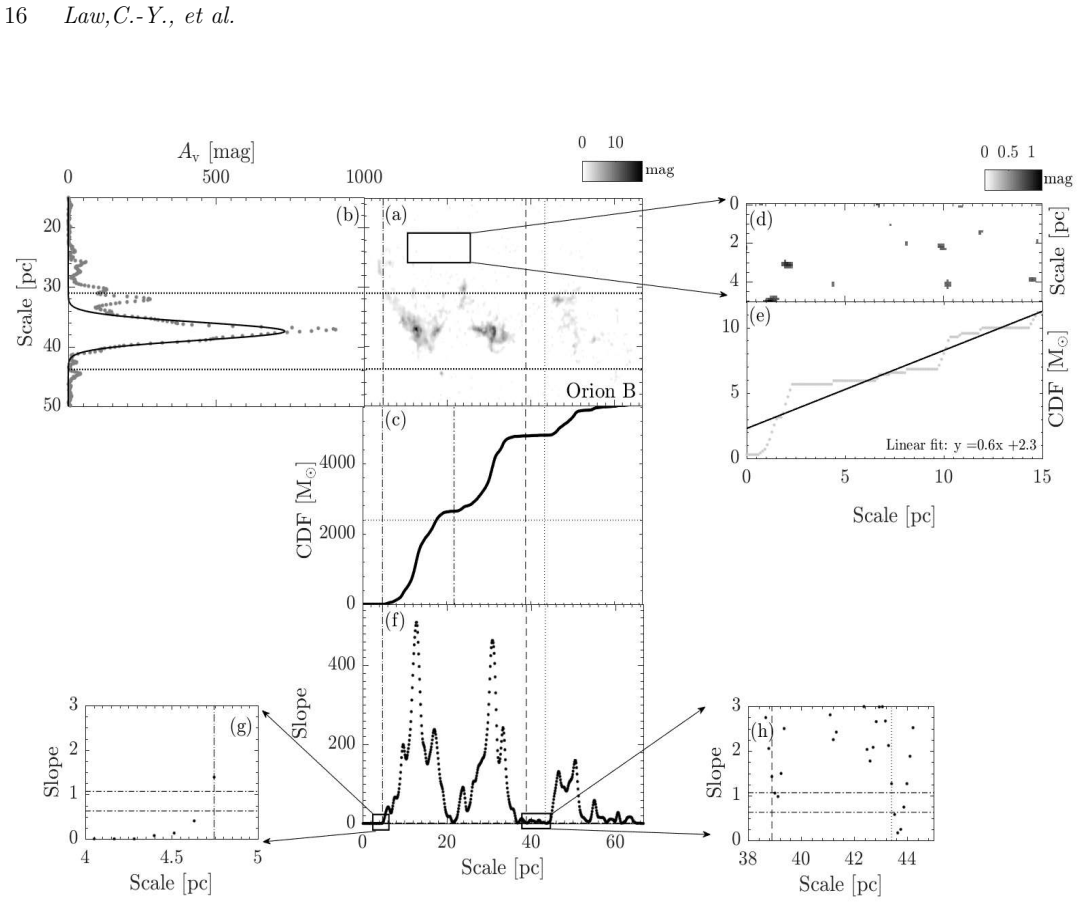
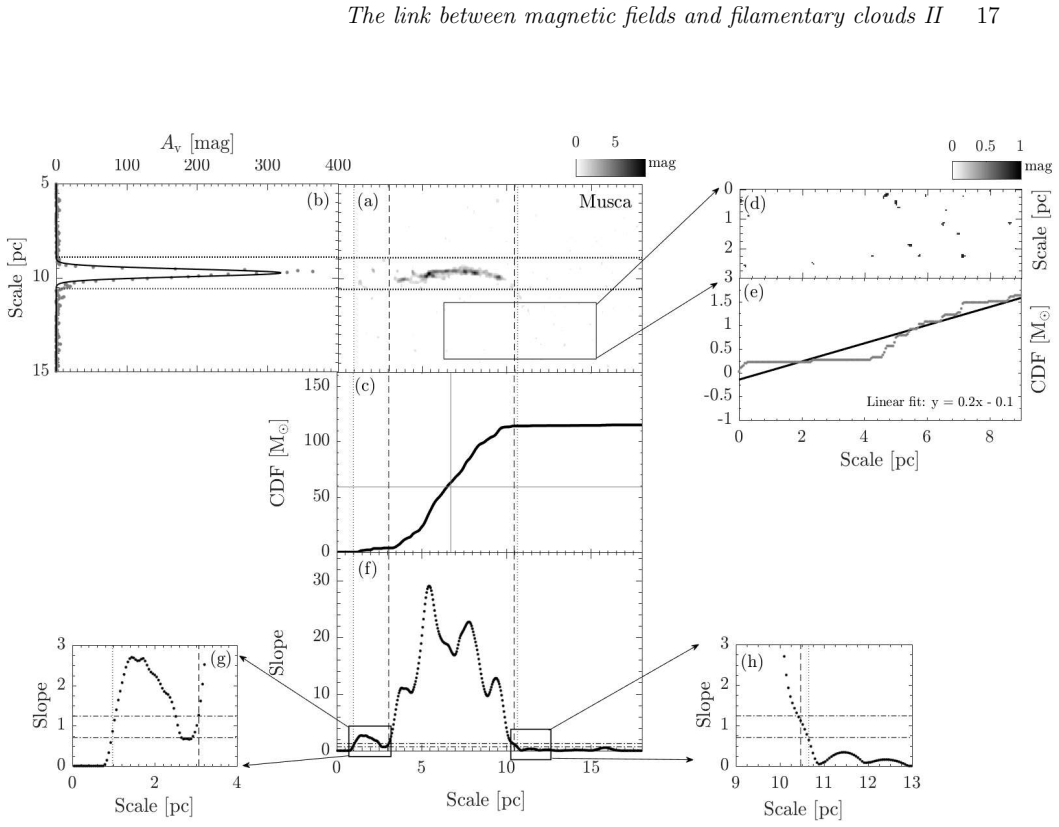
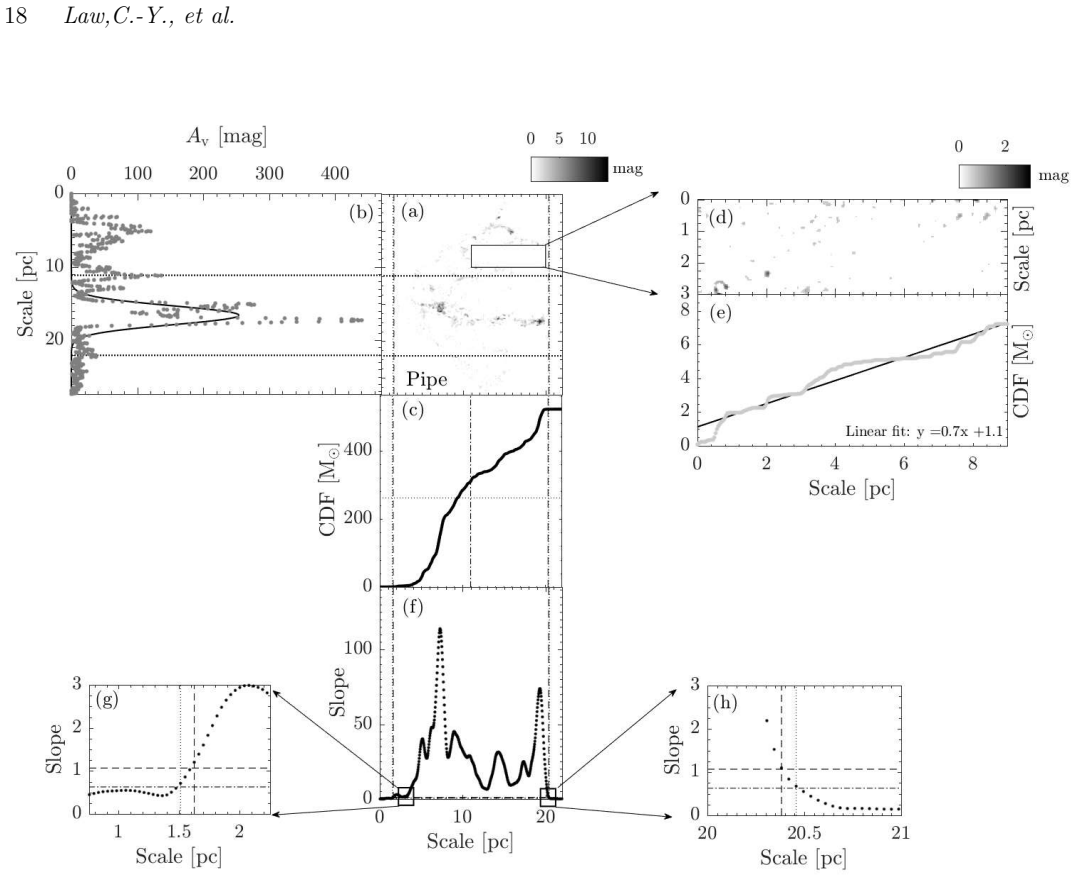
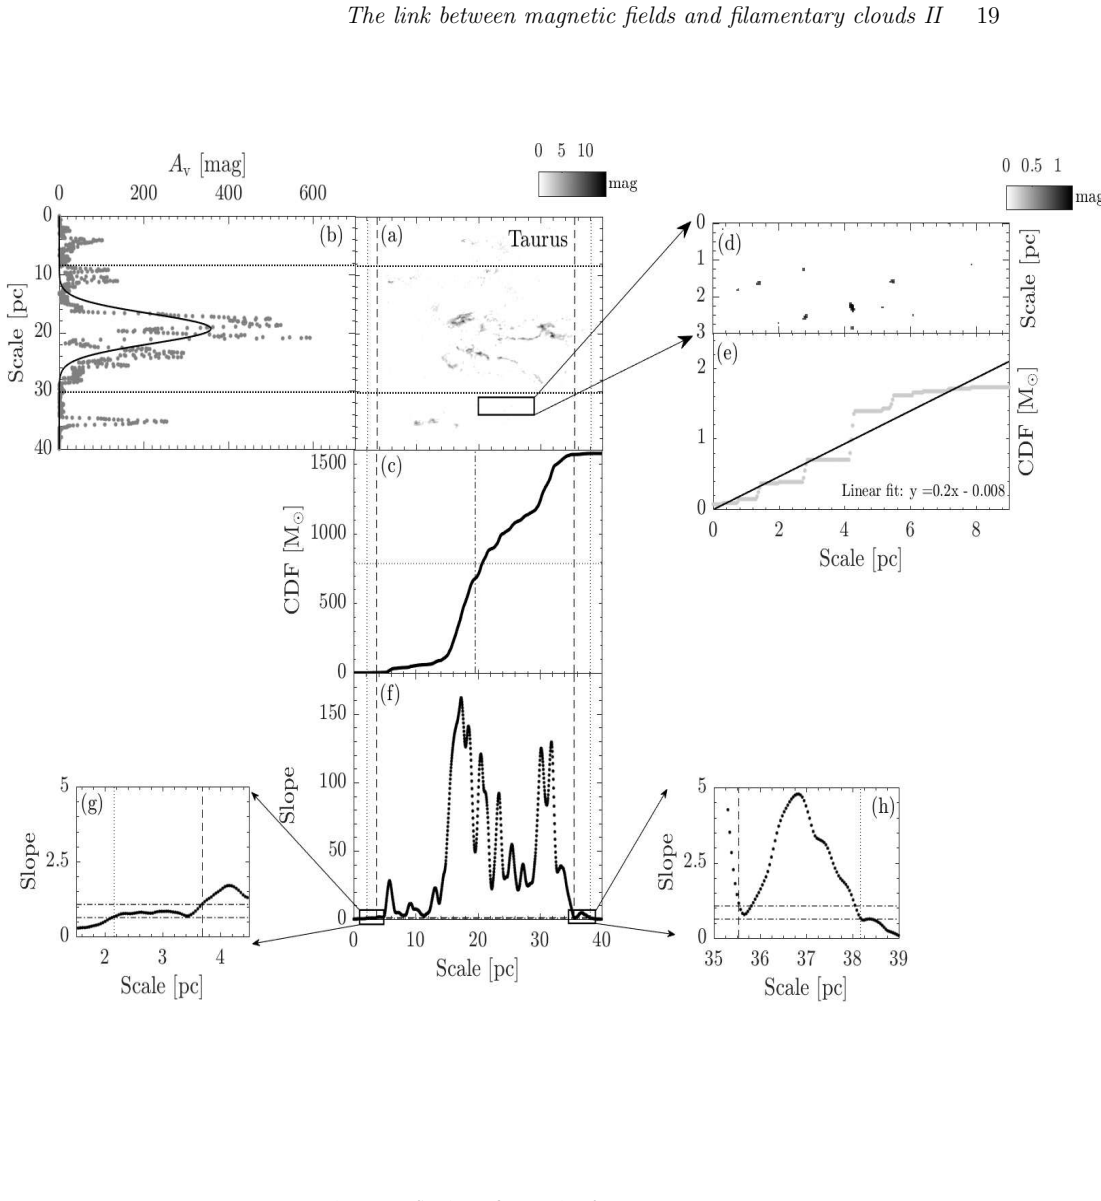
The map is rotated clockwise by the angle of the long-axis orientation from L17
Panel a : The extinction map of CrA. The map is rotated clockwise by the angle of the long-axis orientation from L17. The box indicates the reference region used to compute sloperef, which is defined in panel e. For molecular clouds have distance less than 250pc (CrA,Ophiuchus, Pipe, Taurus, Musca, Lupus-I, Lupus-II-VI, and Cha-I-III), the dimension of the...
work page 2018
-
[3]
MNRAS 000, 1–21 (2018) The link between magnetic fields and filamentary clouds II 7 Figure
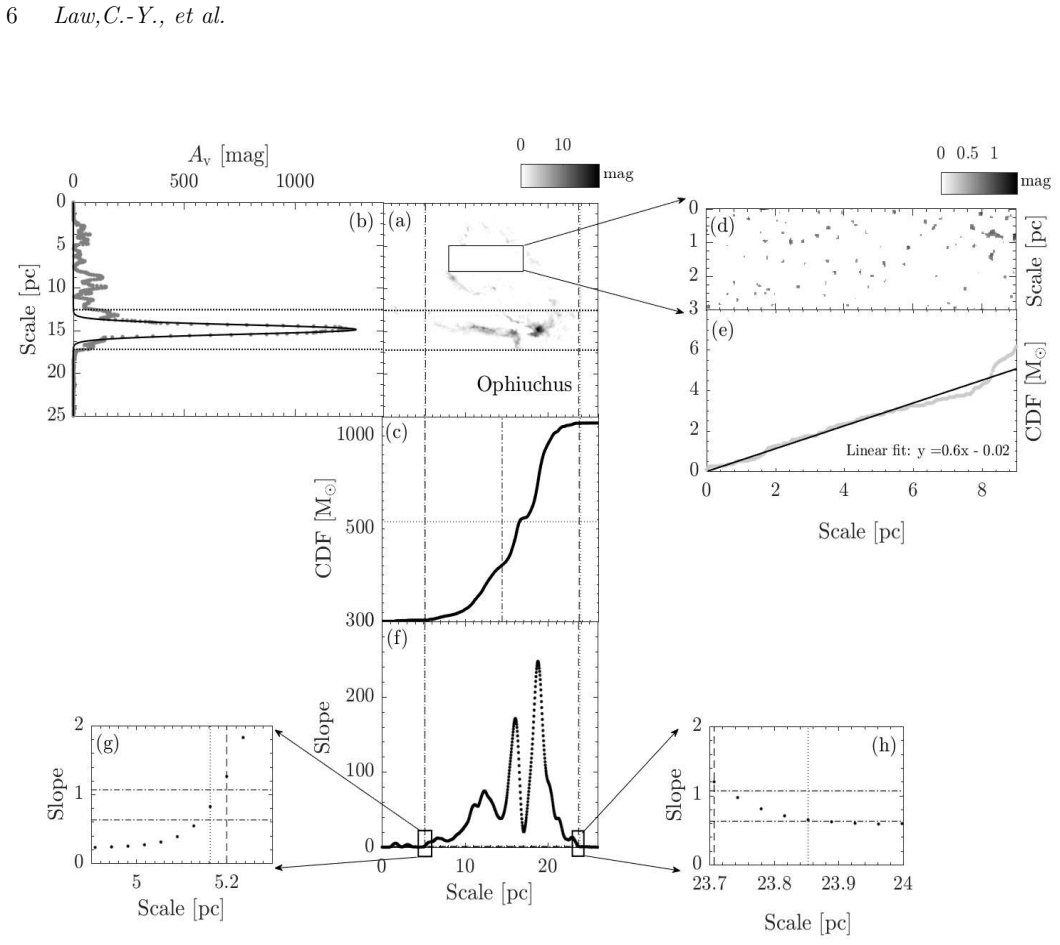
Similar to figure 2, but for Ophiuchus. MNRAS 000, 1–21 (2018) The link between magnetic fields and filamentary clouds II 7 Figure
work page 2018
-
[4]
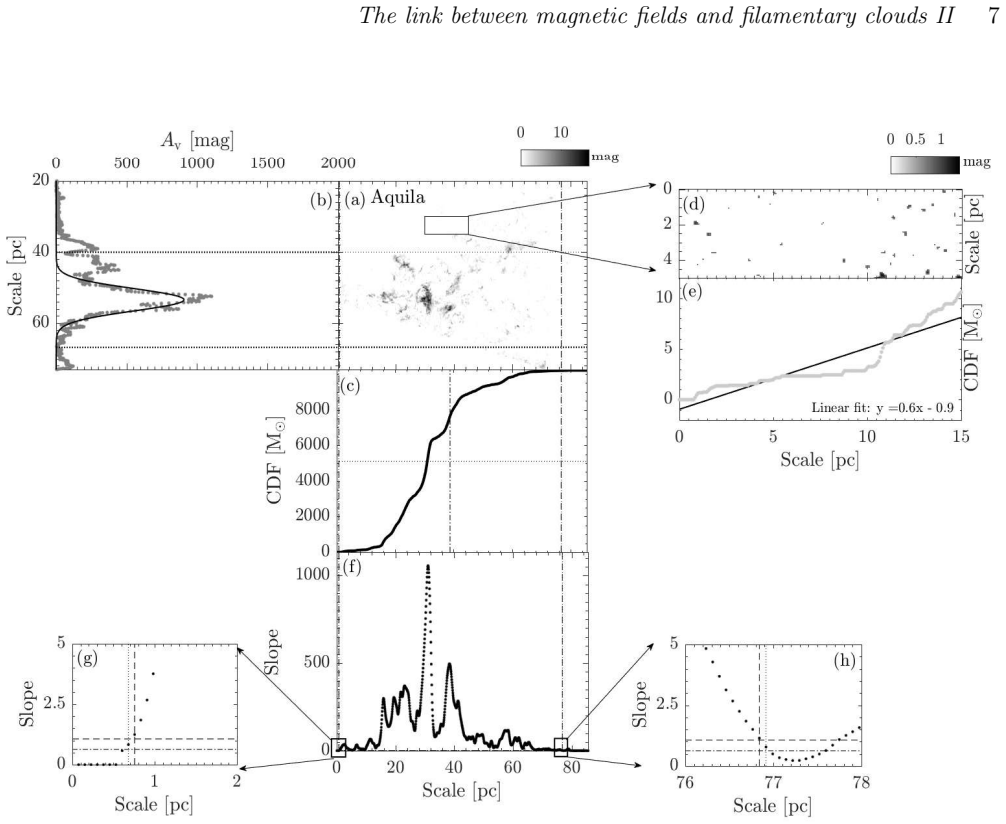
Similar to figure 2, but for Aquila MNRAS 000, 1–21 (2018) 8 Law,C.-Y., et al. Figure
work page 2018
-
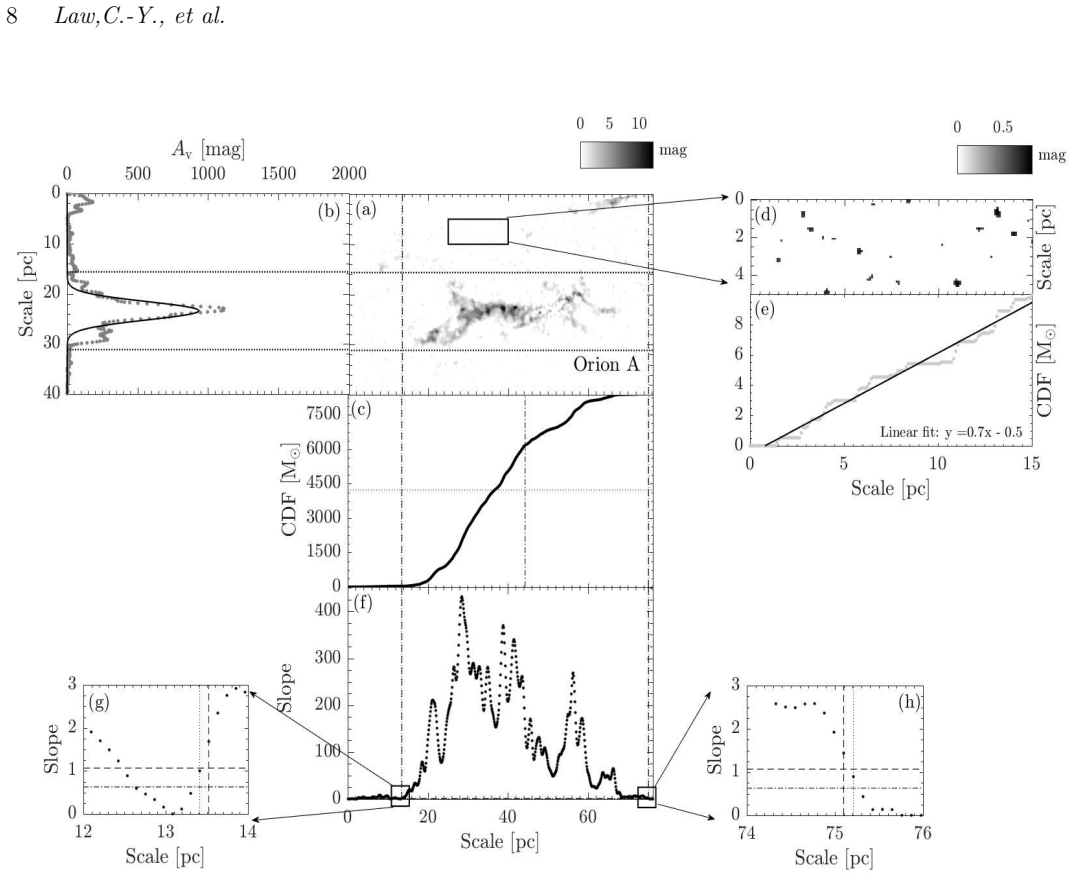
[5]
Similar to figure 2, but for Orion A MNRAS 000, 1–21 (2018) The link between magnetic fields and filamentary clouds II 9 Figure
work page 2018
-
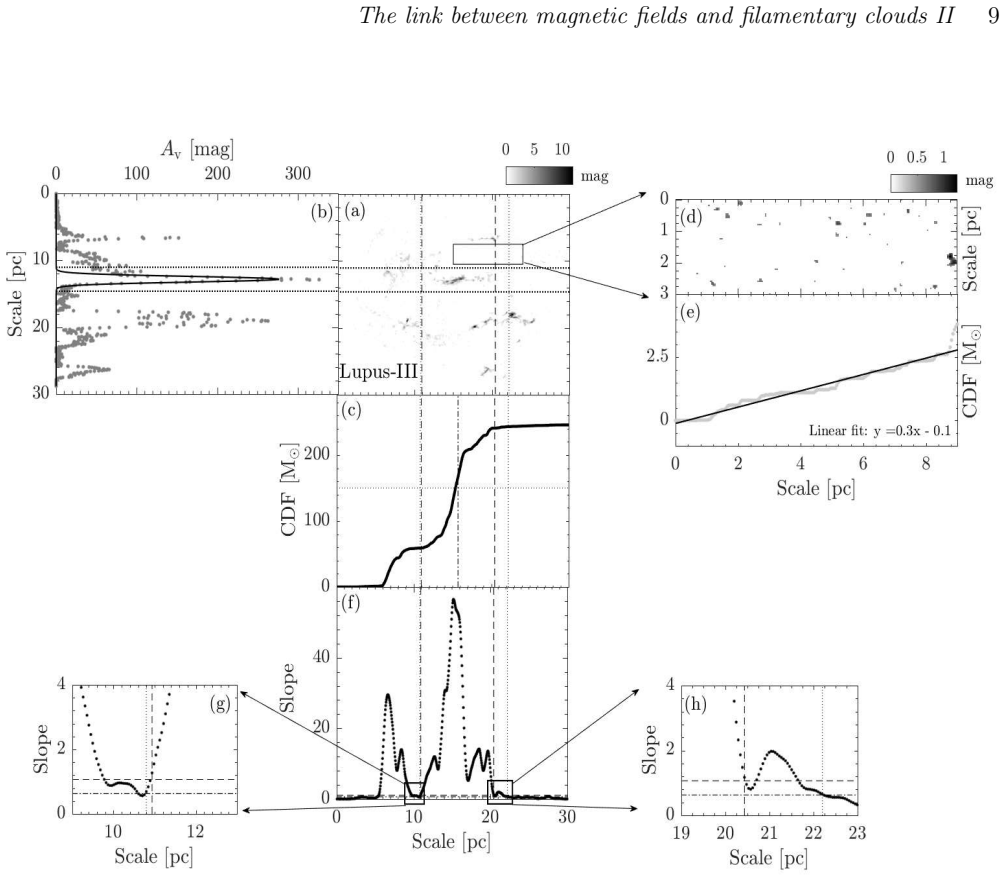
[6]
Similar to figure 2, but for Lupus-III MNRAS 000, 1–21 (2018) 10 Law,C.-Y., et al. Figure
work page 2018
-
[7]
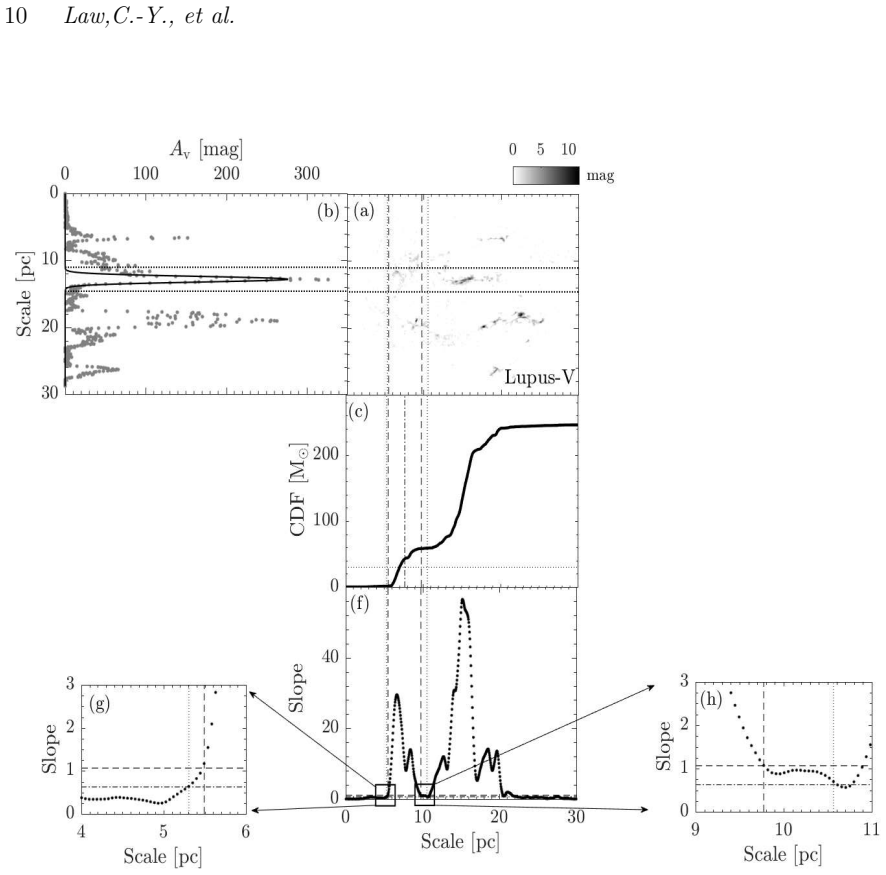
Notice that it shares the same reference region(panel d and e) as Lupus-III
Similar to figure 2, but for Lupus-V. Notice that it shares the same reference region(panel d and e) as Lupus-III. MNRAS 000, 1–21 (2018) The link between magnetic fields and filamentary clouds II 11 Figure
work page 2018
-
[8]
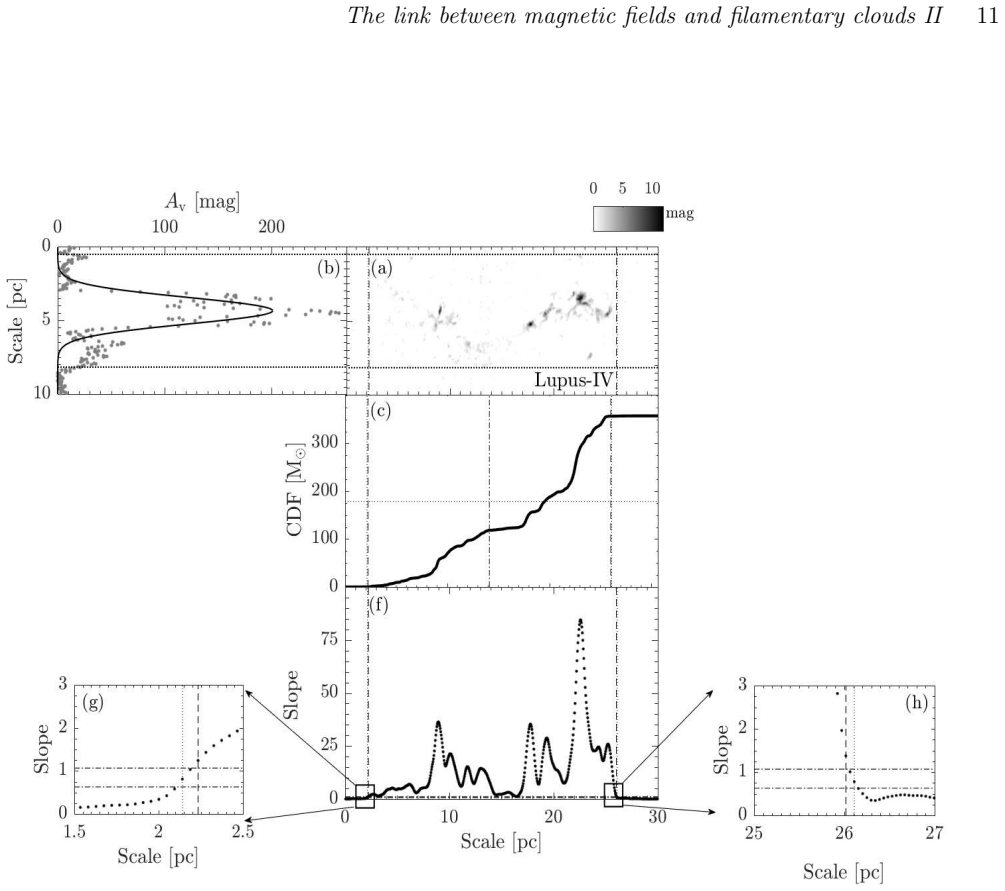
Notice that it shares the same reference region(panel d and e) as Lupus-III
Similar to figure 2, but for Lupus-IV. Notice that it shares the same reference region(panel d and e) as Lupus-III. MNRAS 000, 1–21 (2018) 12 Law,C.-Y., et al. Figure
work page 2018
-
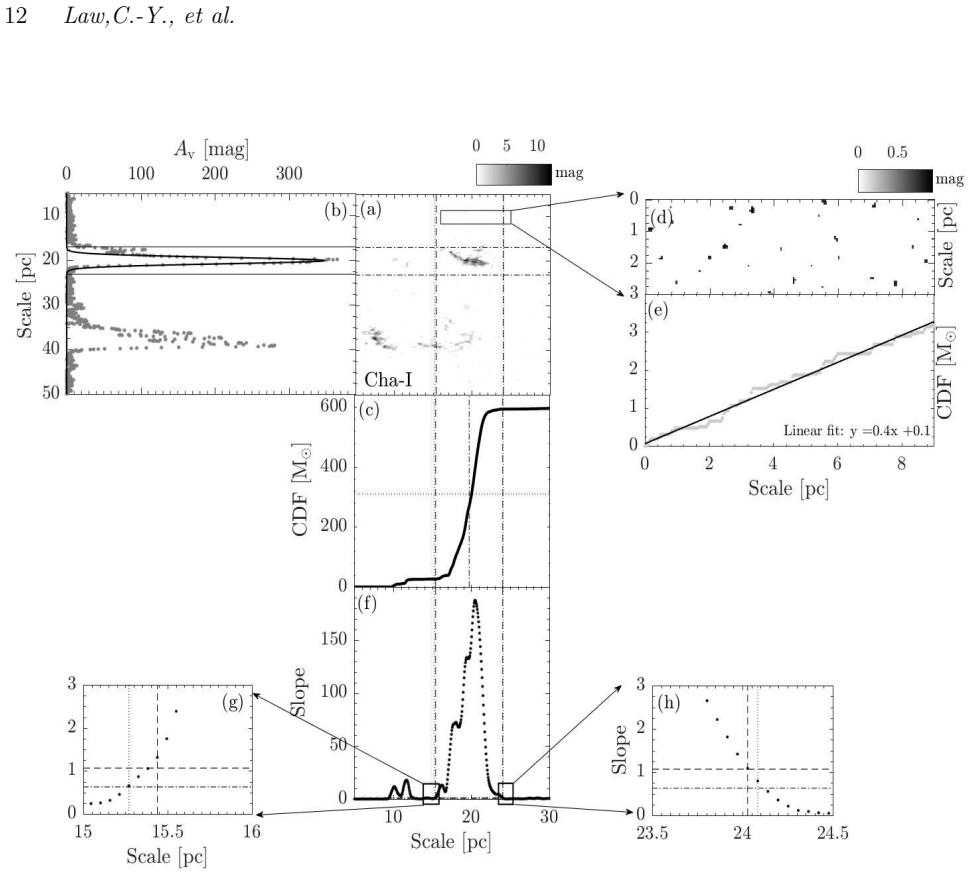
[9]
MNRAS 000, 1–21 (2018) The link between magnetic fields and filamentary clouds II 13 Figure
Similar to figure 2, but for Cha-I. MNRAS 000, 1–21 (2018) The link between magnetic fields and filamentary clouds II 13 Figure
work page 2018
-
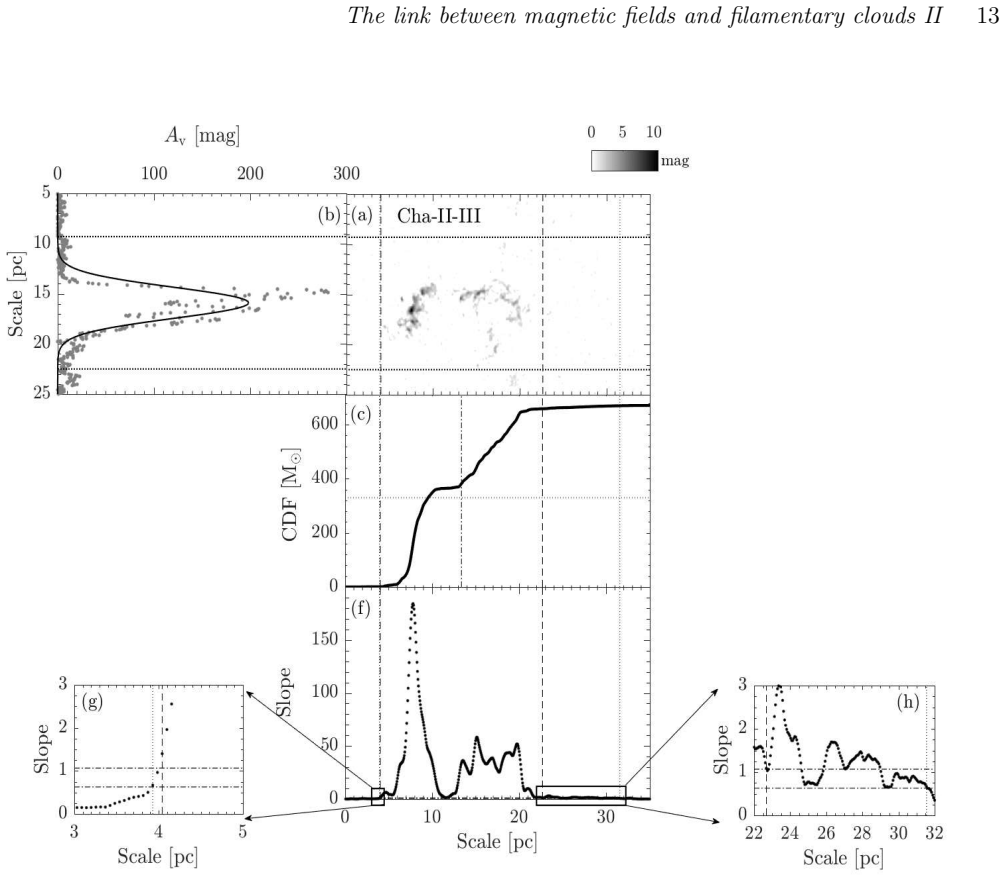
[10]
Notice that it shares the same reference region(panel d and e) as Cha-I
Similar to figure 2, but for Cha-II-III. Notice that it shares the same reference region(panel d and e) as Cha-I. MNRAS 000, 1–21 (2018) 14 Law,C.-Y., et al. Figure
work page 2018
-
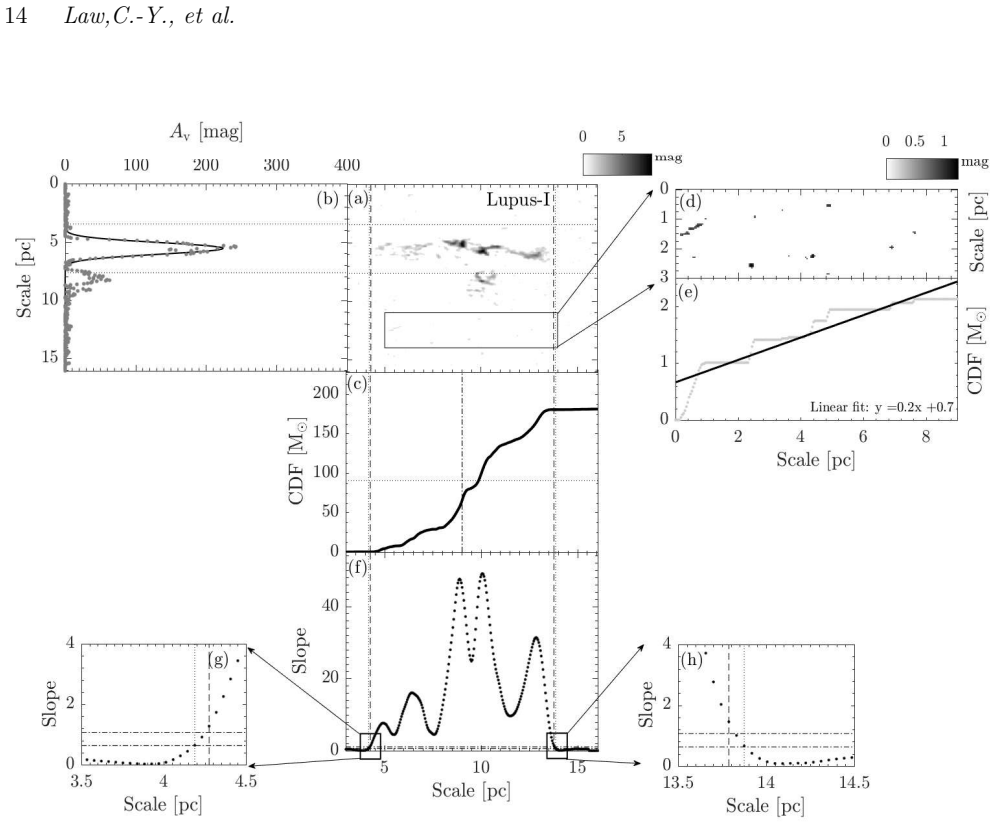
[11]
MNRAS 000, 1–21 (2018) The link between magnetic fields and filamentary clouds II 15 Figure
Similar to figure 2, but for Lupus-I. MNRAS 000, 1–21 (2018) The link between magnetic fields and filamentary clouds II 15 Figure
work page 2018
-
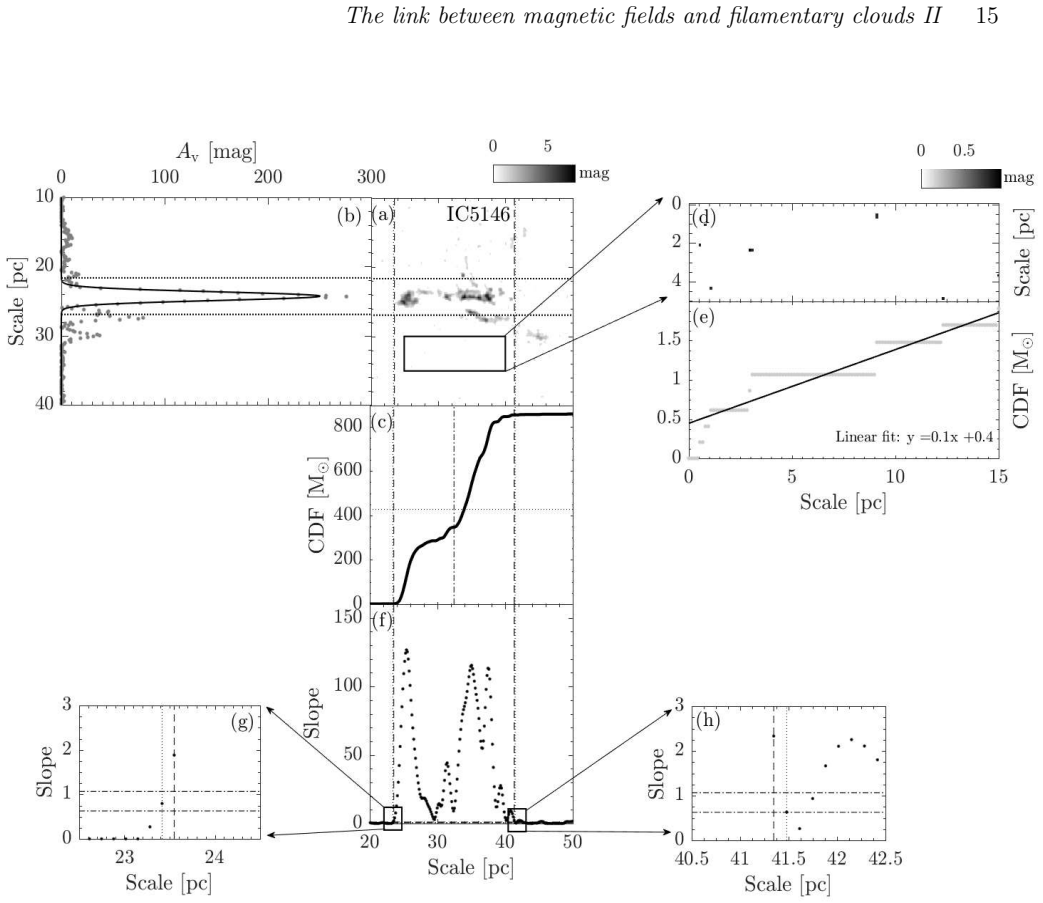
[12]
Similar to figure 2, but for IC5146 MNRAS 000, 1–21 (2018) 16 Law,C.-Y., et al. Figure
work page 2018
-
[13]
MNRAS 000, 1–21 (2018) The link between magnetic fields and filamentary clouds II 17 Figure
Similar to figure 2, but for Orion B. MNRAS 000, 1–21 (2018) The link between magnetic fields and filamentary clouds II 17 Figure
work page 2018
-
[14]
MNRAS 000, 1–21 (2018) 18 Law,C.-Y., et al
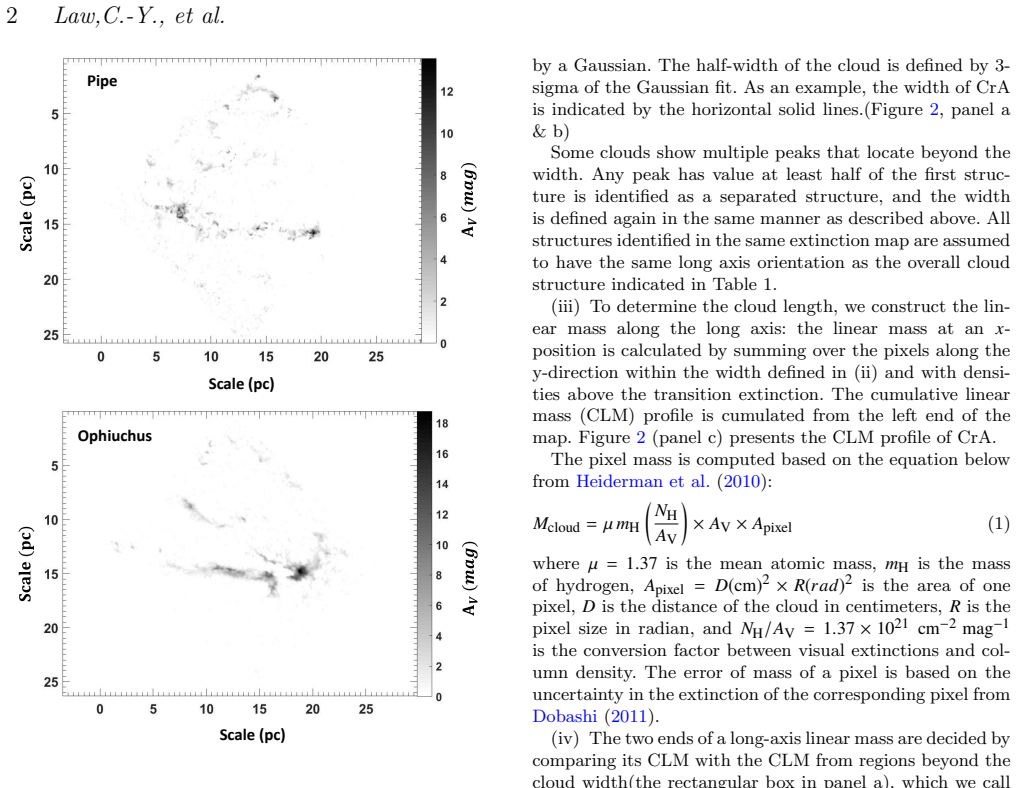
Similar to figure 2, but for Musca. MNRAS 000, 1–21 (2018) 18 Law,C.-Y., et al. Figure
work page 2018
-
[15]
MNRAS 000, 1–21 (2018) The link between magnetic fields and filamentary clouds II 19 Figure
Similar to figure 2, but for Pipe Nebula. MNRAS 000, 1–21 (2018) The link between magnetic fields and filamentary clouds II 19 Figure
work page 2018
-
[16]
MNRAS 000, 1–21 (2018) 20 Law,C.-Y., et al
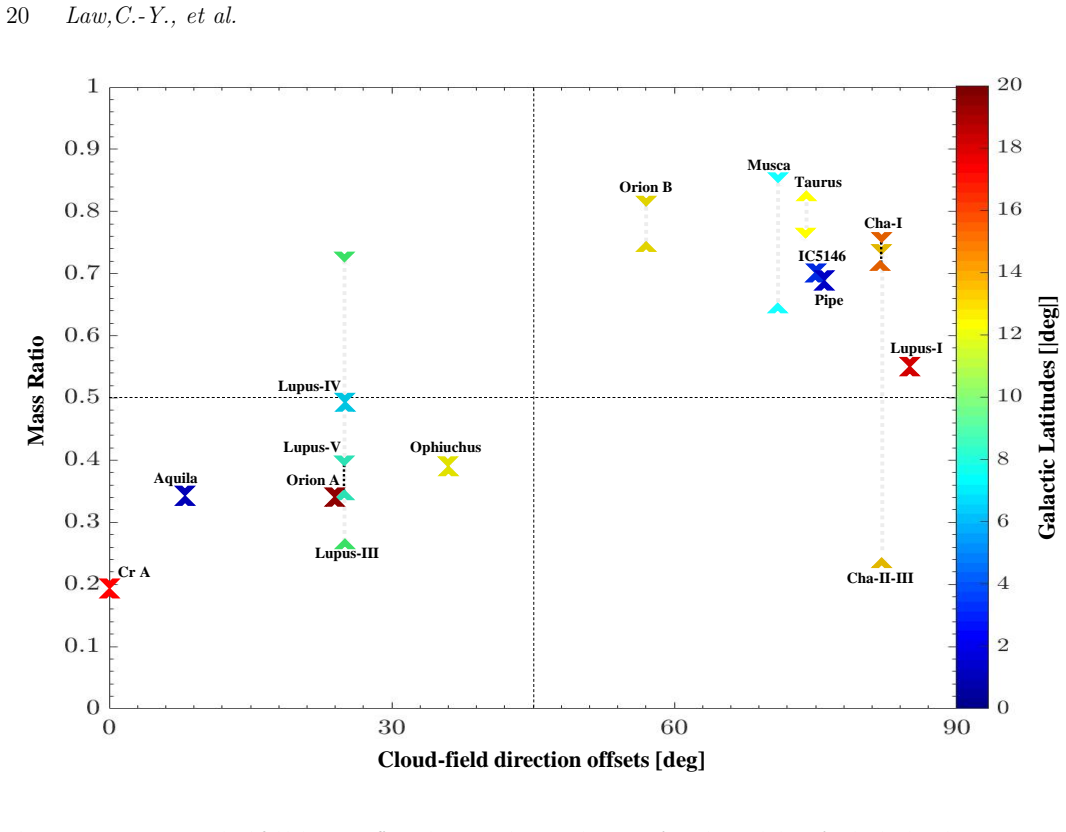
Similar to figure 2, but for Taurus. MNRAS 000, 1–21 (2018) 20 Law,C.-Y., et al. Cr A Ophiuchus Orion A Lupus-V Lupus-IV Aquila Lupus-III Orion B Musca Taurus IC5146 Pipe Cha-I Cha-II-III Lupus-I Mass Ratio Galactic Latitudes [|deg|] Cloud-field direction offsets [deg] Figure
work page 2018
-
[17]
Mass ratio vs. cloud-field direction offset. The ratio is between the masses from the two halves of a cloud, whose long-axis direction is measured in Paper-I, and we define a cloud by a lower threshold of the slope of the cumulative linear mass along this direction (Fig. 2-16; panel f). Two lower thresholds are adopted to demonstrate that the correlation sho...
work page 2018
-
[18]
MNRAS 000, 1–21 (2018) 24 Law,C.-Y., et al
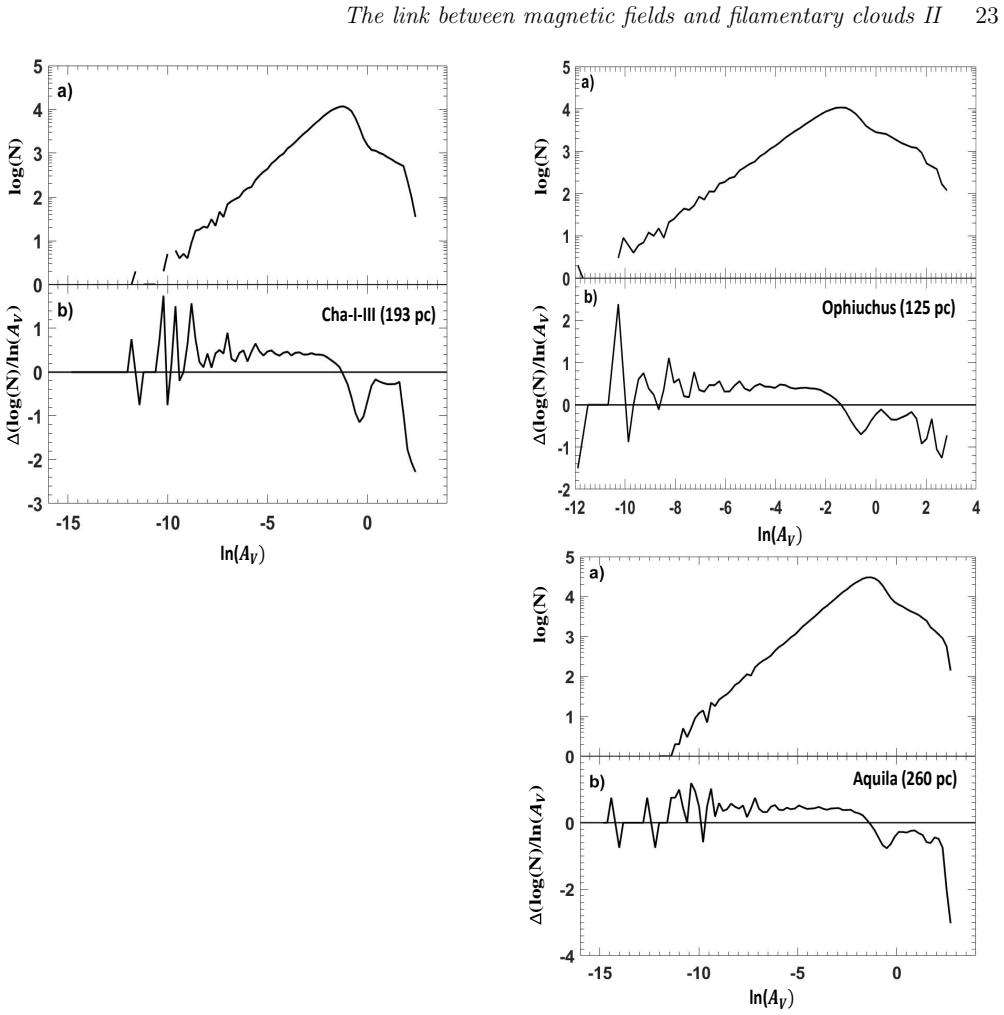
N-PDFs of molecular clouds regions as closer to be parallel with B-field by L17. MNRAS 000, 1–21 (2018) 24 Law,C.-Y., et al. log(N)(log(N)/ln( ) ln(𝑨𝑽) ln(𝑨𝑽) (log(N)/ln( ) log(N) Lupus-II-VI (160 pc) Orion A (378 pc) Figure 2 (Cont.). log(N)(log(N)/ln( ) ln(𝑨𝑽) CrA (130 pc) Figure 2 (Cont.). MNRAS 000, 1–21 (2018) The link between magnetic fields and filame...
work page 2018
discussion (0)
Sign in with ORCID, Apple, or X to comment. Anyone can read and Pith papers without signing in.