REVIEW 3 major objections 7 minor 48 references
Climate extreme event attribution using multivariate peaks-over-thresholds modeling and counterfactual theory
T0 review · 3 major / 7 minor · reviewed 2026-08-14 · deepseek-v4-flash
Pith's one-line read Modeling the full spatial field of extreme rainfall with a multivariate generalized Pareto distribution yields stronger and less uncertain climate attribution statements than univariate analyses.
desk verdict A genuine bridge between multivariate GPDs and Pearl's causation probabilities, but the optimal-weight claim only holds under constant dependence, and the application assumes the opposite. read the letter →
The pith
A machine-rendered reading of the paper's core claim, the machinery that carries it, and where it could break.
The reading
What carries the argument
The central object is the multivariate generalized Pareto distribution (MGPD) with the stochastic representation $Z^* = E + T - \max_{1\le j\le d} T_j$, where $E$ is unit exponential and $T$ is an arbitrary random vector independent of $E$. The load-bearing property is Proposition 2.1: when all shape parameters equal $\gamma$, the linear projection of an MGPD vector, conditioned on being positive, is a univariate GPD with scale $w^T\sigma$ and shape $\gamma$. This property reduces high-dimensional threshold exceedances to univariate GPD tails, enabling the approximation (4.1), the optimal-weight Proposition 4.1, and a simple estimation scheme based on probability weighted moments. Tail dependence coefficients $\chi$ drive the spatial clustering used to delimit homogeneous regions.
What would settle it
On simulated bivariate GPD data with known marginal parameters and different tail dependence coefficients in the two worlds, compute the true $PN$ by Monte Carlo and compare it with the optimal-weight $PN$ from Proposition 4.1; if the proposition's maximizer yields a lower necessary-causation probability than equal weights or than the true optimum, the claim that the proposed weights maximize $PN$ under changing dependence is falsified.
Extended reading notes
Core claim
The central claim is that for events of the form $\{w^T X > v\}$, where $X$ is a $d$-dimensional vector of precipitation at grid points and $w$ are non-negative weights summing to one, the probability of necessary causation can be approximated by modeling the tail of $X$ as a multivariate generalized Pareto distribution and using the linear-projection property $[w^T Z \mid w^T Z > 0] \sim GPD(w^T \sigma, \gamma)$ when all shape parameters are equal. This leads to the approximation $P[w^T X^{(i)} > v] \approx P[w^T X^{(i)} > w^T u]\, H(v - w^T u; w^T \sigma^{(i)}, \gamma)$, from which the paper derives, in the bivariate case, an explicit optimal weight $w_{opt}(v)$ that maximizes the necessary-causation probability (Proposition 4.1). The paper further claims that the optimized multivariate PN is larger than the univariate PN and has smaller uncertainty, and demonstrates this on simulated data and on CNRM CMIP6 weekly winter precipitation maxima after clustering grid points into homogeneous regions via tail-dependence-based partitioning around medoids.
Load-bearing premise
The argument requires that the spatial dependence among extremes stays the same between the counterfactual and factual worlds, because only then does the probability of a projected sum being positive cancel out and the maximized expression equal the true necessary-causation probability.
Editorial extensions
If this is right
- A univariate analysis that aggregates grid points with equal weights will generally understate necessary causation when tail dependence is stronger in the factual world than in the counterfactual world.
- The optimal-weight procedure gives an objective, data-driven choice of the spatial projection, so attribution statements can be tied to the grid locations that carry the strongest causal signal.
- The method requires homogeneous regions with a common shape parameter; clustering by tail dependence makes this assumption workable for precipitation fields.
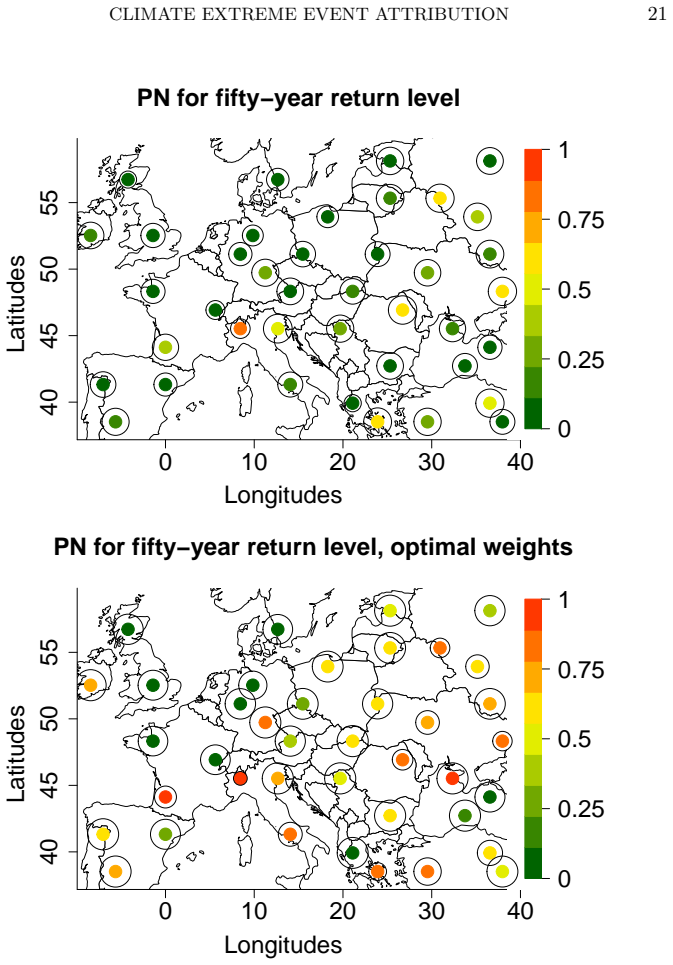
- For the CNRM CMIP6 data, the multivariate approach reports necessary-causation probabilities above 0.5 for most of central Europe at the fifty-year return level, with near-one values around northern Italy.
- The same inferential recipe transfers to other threshold-exceedance events and other climate model outputs, provided the stationarity and asymptotic-dependence conditions hold.
Reading between the lines
- Because the paper's optimal-weight formulas drop the ratio $P[w^T Z^{(0)} > 0]/P[w^T Z^{(1)} > 0]$, a direct testable extension is to maximize the full PN expression allowing dependence to change; on the CNRM data, where dependence does change, the reported optimal-weights PN may be a biased estimate of true necessary causation.
- The method could be applied to compound events where an event is defined by several variables exceeding thresholds jointly; the same projection machinery would then identify the linear combination of variables that maximizes causal evidence.
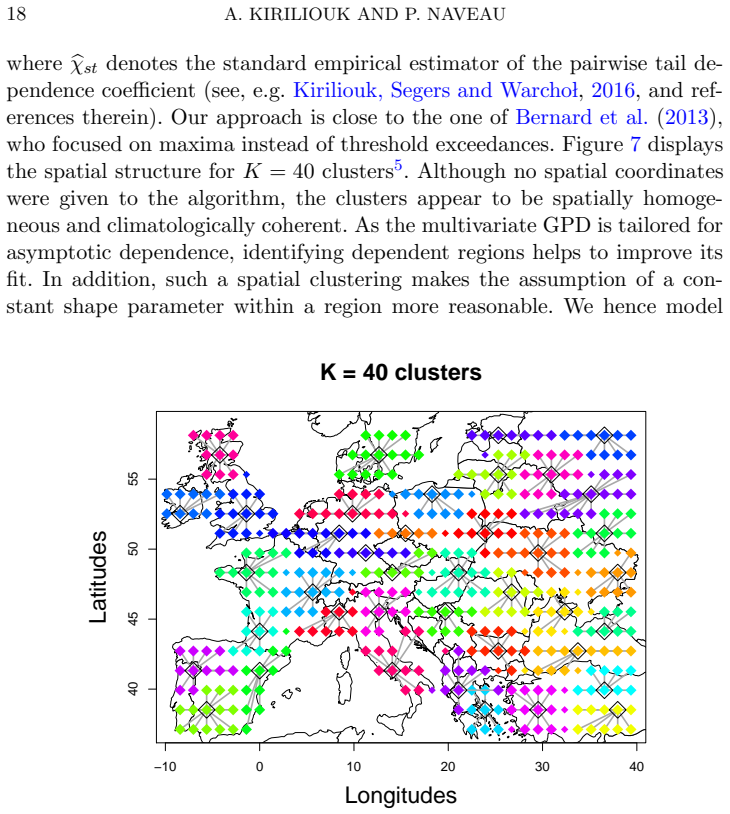
- The clustering step uses only the counterfactual run; re-clustering in the factual world, or using a dependence distance that varies with the forcing, might reveal regions where a change in dependence itself is part of the causal story.
Signed reviews
Editorial analysis
A structured set of objections, weighed in public.
Referee Report
Summary. The paper develops a multivariate peaks-over-thresholds approach to extreme event attribution. It models the joint tail of a spatial precipitation vector by a multivariate generalized Pareto distribution and uses Pearl's counterfactual probabilities of necessary causation, PN = max(1-p0/p1, 0), for events of the form {w^T X > v}. The main methodological contribution is Proposition 4.1, which derives an explicit bivariate weight vector maximizing an approximation of PN based on the univariate GPD behavior of linear projections, together with an inference strategy that estimates PN through a combination of an empirical exceedance factor and a fitted GPD tail. The method is illustrated on weekly winter precipitation maxima from the CNRM CMIP6 model, where cluster-specific multivariate PN estimates are compared with univariate estimates. The authors conclude that accounting for spatial dependence can increase PN and reduce uncertainty relative to univariate analyses.
Significance. If the main claims hold, this would be a useful contribution to climate event attribution: it connects modern multivariate extreme-value theory with causal attribution, gives an explicit formula for choosing a projection that increases causal evidence, and demonstrates the approach on a real CMIP6 model with clustering based on tail dependence. The use of Proposition 2.1 from Rootzen, Segers and Wadsworth is well grounded, and the paper is honest about several scope restrictions: common shape parameter, asymptotic dependence, stationarity, and the fact that Eq. (4.3) equals PN only when dependence is unchanged between the two worlds. The simulations and the CNRM application are valuable even if the optimal-weight claim needs qualification.
major comments (3)
- [Section 4.2, Proposition 4.1, Eqs. (4.1)-(4.4), Figures 8-9] The paper's central 'optimal weight' claim is only proved for a simplified objective. For exact multivariate GPDs, PN(v,w) = max(1 - [P(w^T Z^(0)>0) H0] / [P(w^T Z^(1)>0) H1], 0), while Proposition 4.1 maximizes (4.3), namely 1 - H0/H1, where H_i = H(v; w^T sigma^(i), gamma). The factors P(w^T Z^(i)>0) depend on the dependence structure of world i and on w. The paper states after (4.3) that the equality holds only when P(w^T Z^(0)>0) = P(w^T Z^(1)>0), i.e., when dependence is unchanged. However, the paper's motivation is precisely the opposite case: Section 2.1 argues that spatial dependence can differ between factual and counterfactual worlds, Figure 4 illustrates PN changes under changing dependence, and Figure 6 uses chi^(1)>chi^(0). In the application, the 'optimal' weights are selected under the constant-dependence approximation, while the reported PN values in Figures 8-9 are computed from (4.4), which retains the empirical first factor. There is therefore no guarantee that w_opt maximizes the PN actually reported, and the observed increases in PN and apparent uncertainty reduction may be artifacts of optimizing a misspecified objective. Please either restrict the optimality claim to the constant-dependence setting and present w_opt as a heuristic in changing dependence, or assess the bias by simulation and by evaluating the full PN at w_opt versus other weights under changing dependence.
- [Section 4.3, Section 5, Figures 8-9] The optimal weights are estimated from the same data on which the PN values and their confidence intervals are computed. It is not stated whether the bootstrap procedure in Figures 8-9 re-estimates w_opt for each bootstrap sample or conditions on the estimated weights. If the weights are held fixed, the reported intervals understate the sampling variability of the full procedure and the comparison of uncertainty with univariate analyses is not on equal footing. Please clarify the bootstrap scheme and, if weights are not re-estimated, either re-estimate them in each bootstrap replication or add a sensitivity analysis showing that the conclusions are robust to the selection step.
- [Section 4.2, Eqs. (4.1)-(4.3)] Eq. (4.3) also omits the threshold normalization that appears in the paper's own inference formula (4.4): for general X^(i), the ratio p0/p1 involves P(w^T X^(i) > w^T u^(i)) in addition to the GPD tail terms. Even if the extremal dependence is constant, these threshold exceedance probabilities can depend on w and may differ between worlds. The current wording after (4.3) only mentions the equality for multivariate GPDs with P(w^T Z^(0)>0)=P(w^T Z^(1)>0). Please add a remark that, in the thresholded-data approximation, the first factors in (4.1) are not generally cancelled, and that Proposition 4.1 therefore maximizes an approximation that discards part of the dependence information in the data.
minor comments (7)
- [Section 4.3, Eq. (4.4)] The second case in Eq. (4.4) has the condition 'if v <= w^T u^(i)', which is identical to the first case and must be a typo; it should read 'if v > w^T u^(i)'.
- [Section 4.2, after Eq. (4.3)] The sentence 'it is equal to the PN when X^(0), X^(0) are multivariate GPDs' contains a typo: the second subscript should be X^(1).
- [Section 2.1, Eq. (2.1) context] The notational definitions of PN, PS, and PNS before Eq. (2.1) appear garbled or missing overbars and do(C) notation, making them hard to parse; please clarify them to match Hannart et al. (2016).
- [Section 4.3, Eqs. (4.1)-(4.4)] The definition of the empirical exceedance factor writes the first term as a function of v, but it is later evaluated at w^T u^(i); please define it with a generic argument and then specialize, to avoid notational confusion.
- [Section 4.1, Eq. (4.1)] The condition gamma = gamma 1_d is used to apply Proposition 2.1; please define the notation 1_d explicitly at first use.
- [Section 4.3, Figure 6] The sentence 'calculated based on a pre-simulation run of sample size 10^6 and held fixed' is unclear about which quantity is held fixed; if the weights are equal weights and fixed, say so explicitly.
- [Proposition 4.1] The phrase 'only zero or unit weights maximize this ratio' should specify that the maximization is of the ratio in (4.3), not of the full PN in (4.2), to avoid overstating the result.
Circularity Check
No significant circularity; the derivation is self-contained against external extreme-value theory and Pearl's counterfactual framework.
full rationale
The paper's central derivation is not circular. The univariate projection result in Proposition 2.1 is cited to Rootzén, Segers and Wadsworth (2018a), an external source, and the causal probability formulas come from Pearl (2000) and Hannart et al. (2016), also external. Proposition 4.1 explicitly maximizes expression (4.3), which the authors themselves identify as an approximation of the necessary-causation probability (4.2), equal only when the dependence structure is unchanged between the factual and counterfactual worlds. This is an honest limitation, not a hidden identification of the target quantity with its optimizing input. The application computes reported PN values from estimator (4.4), which includes the empirical, dependence-sensitive first term, so the observed gains from 'optimal weights' are not forced by construction. Self-citations such as Kiriliouk et al. (2019) and the supplementary material (Kiriliouk and Naveau, 2020) provide supporting details but are not load-bearing uniqueness claims or ansatz smuggling. Any concern that Proposition 4.1's weights may not maximize the reported PN when dependence changes is a correctness or robustness issue, not circularity.
Assumptions & free parameters
free parameters (8)
- gamma_0 (counterfactual shape parameter) =
Estimated from data, not reported
- gamma_1 (factual shape parameter) =
Estimated from data, not reported
- sigma_0 (counterfactual scale vector) =
Estimated from data, not reported
- sigma_1 (factual scale vector) =
Estimated from data, not reported
- u_0 (counterfactual threshold vector) =
Not reported
- u_1 (factual threshold vector) =
Not reported
- w_opt (optimal weight vector per cluster) =
Reported as maps in Figures 8 and 9
- K (number of PAM clusters) =
40
assumptions (6)
- standard math Multivariate Pickands-Balkema-de Haan theorem: appropriately rescaled threshold exceedances converge to a multivariate GPD.
- domain assumption The weekly winter precipitation vector X^(i), after thresholding, is well approximated by a multivariate GPD with asymptotic dependence.
- domain assumption Within each cluster, the shape parameter is common across components, gamma = gamma 1_d.
- domain assumption The cause C is exogenous and monotonically related to the event, so Pearl's formulas (2.1) hold.
- ad hoc to paper For Proposition 4.1 to give the true PN maximizer, the dependence structure must be unchanged between worlds, P[w^T Z^(0)>0] = P[w^T Z^(1)>0].
- domain assumption The precipitation series are stationary in time within each world.
Cite this review
Pith. "Pith review of Climate extreme event attribution using multivariate peaks-over-thresholds modeling and counterfactual theory." pith.science (2026). https://pith.science/paper/SNJXDTJK
@misc{pith2026190803107,
  author       = {Pith},
  title        = {Pith review of: Climate extreme event attribution using multivariate peaks-over-thresholds modeling and counterfactual theory},
  year         = {2026},
  howpublished = {\url{https://pith.science/paper/SNJXDTJK}},
  note         = {Machine review of arXiv:1908.03107}
}
read the original abstract
Numerical climate models are complex and combine a large number of physical processes. They are key tools in quantifying the relative contribution of potential anthropogenic causes (e.g., the current increase in greenhouse gases) on high impact atmospheric variables like heavy rainfall. These so-called climate extreme event attribution problems are particularly challenging in a multivariate context, that is, when the atmospheric variables are measured on a possibly high-dimensional grid. In this paper, we leverage two statistical theories to assess causality in the context of multivariate extreme event attribution. As we consider an event to be extreme when at least one of the components of the vector of interest is large, extreme-value theory justifies, in an asymptotical sense, a multivariate generalized Pareto distribution to model joint extremes. Under this class of distributions, we derive and study probabilities of necessary and sufficient causation as defined by the counterfactual theory of Pearl. To increase causal evidence, we propose a dimension reduction strategy based on the optimal linear projection that maximizes such causation probabilities. Our approach is tested on simulated examples and applied to weekly winter maxima precipitation outputs of the French CNRM from the recent CMIP6 experiment.
Figures


Figures from the paper (6 more)



Reference graph
Works this paper leans on
-
[1]
write newline
" write newline "" before.all 'output.state := FUNCTION format.url url empty "" url if FUNCTION article output.bibitem format.authors "author" output.check author format.key output output.year.check new.block format.title "title" output.check new.block crossref missing format.jour.vol output format.article.crossref output.nonnull format.pages output if ne...
-
[2]
barticle [author] Ang \'e lil , O. O. , Stone , D. D. Wehner , M. M. ( 2017 ). An Independent Assessment of Anthropogenic Attribution Statements for Recent Extreme Temperature and Rainfall Events . Journal of Climate 30 5--16 . barticle
work page 2017
-
[3]
barticle [author] Balkema , August A A. A. de Haan , Laurens L. ( 1974 ). Residual life time at great age . The Annals of Probability 2 792--804 . barticle
work page 1974
-
[4]
bbook [author] Beirlant , J. J. , Goegebeur , Y. Y. , Segers , J. J. Teugels , J. J. ( 2004 ). Statistics of E xtremes: T heory and A pplications . Wiley . bbook
work page 2004
-
[5]
barticle [author] Bernard , Elsa E. , Naveau , Philippe P. , Vrac , Mathieu M. Mestre , Olivier O. ( 2013 ). Clustering of maxima: Spatial dependencies among heavy rainfall in F rance . Journal of Climate 26 7929--7937 . barticle
work page 2013
-
[6]
barticle [author] Carreau , Julie J. , Naveau , P P. Neppel , L L. ( 2017 ). Partitioning into hazard subregions for regional peaks-over-threshold modeling of heavy precipitation . Water Resources Research 53 4407--4426 . barticle
work page 2017
-
[7]
barticle [author] Chen , Yang Y. , Moufouma-Okia , Wilfran W. , Masson-Delmotte , Val \'e rie V. , Zhai , Panmao P. Pirani , Anna A. ( 2018 ). Recent Progress and Emerging Topics on Weather and Climate Extremes Since the Fifth Assessment Report of the Intergovernmental Panel on Climate Change . Annual Review of Environment and Resources 43 35-59 . 10.1146...
-
[8]
bbook [author] Coles , Stuart G. S. G. ( 2001 ). An Introduction to Statistical Modeling of Extreme Values . Springer-Verlag Inc . bbook
work page 2001
Show all 48 references
-
[9]
binbook [author] Cooley , D. D. , Hunter , B. D. B. D. Smith , R. L. R. L. ( 2017 ). Handbook of Environmental and Ecological Statistics Univariate and Multivariate Extremes for the Environmental Sciences . CRC Press . binbook
2017
-
[10]
barticle [author] Davison , A. C. A. C. Huser , R. R. ( 2015 ). Statistics of Extremes . Annual Review of Statistics and Its Application 2 203-235 . 10.1146/annurev-statistics-010814-020133 barticle
2015 doi
-
[11]
barticle [author] Davison , A. C. A. C. Smith , R. L. R. L. ( 1990 ). Models for Exceedances over High Thresholds (with Comments) . Journal of the Royal Statistical Society: Series B (Statistical Methodology) 52 393--442 . barticle
1990
-
[12]
barticle [author] de Fondeville , R. R. Davison , A. C. A. C. ( 2018 ). High-dimensional peaks-over-threshold inference . Biometrika 105 . barticle
2018
-
[13]
bbook [author] Embrechts , P. P. , Kl \"u ppelberg , C. C. Mikosch , T. T. ( 1997 ). Modelling Extremal Events for Insurance and Finance 33 . Applications of Mathematics, Springer-Verlag, Berlin. bbook
1997
-
[14]
, De Fondeville , Rapha \"e l R
barticle [author] Engelke , Sebastian S. , De Fondeville , Rapha \"e l R. Oesting , Marco M. ( 2018 ). Extremal behaviour of aggregated data with an application to downscaling . Biometrika 106 127--144 . barticle
2018
-
[15]
Guillou , Armelle A
barticle [author] Falk , Michael M. Guillou , Armelle A. ( 2008 ). Peaks-over-threshold stability of multivariate generalized P areto distributions . Journal of Multivariate Analysis 99 715--734 . barticle
2008
-
[16]
de Haan , Laurens L
barticle [author] Ferreira , Ana A. de Haan , Laurens L. ( 2014 ). The generalized P areto process; with a view towards application and simulation . Bernoulli 20 1717--1737 . barticle
2014
-
[17]
barticle [author] Fischer , Erich M E. M. Knutti , Reto R. ( 2015 ). Anthropogenic contribution to global occurrence of heavy-precipitation and high-temperature extremes . Nature Climate Change 5 560--564 . barticle
2015
-
[18]
binbook [author] Hammerling , D. D. , Katzfuss , M. M. Smith , R. L. R. L. ( 2017 ). Handbook of Environmental and Ecological Statistics Climate Change Detection and Attribution . CRC Press . binbook
2017
-
[19]
Naveau , Philippe P
barticle [author] Hannart , Alexis A. Naveau , Philippe P. ( 2018 ). Probabilities of Causation of Climate Changes . Journal of Climate 31 5507-5524 . barticle
2018
-
[20]
, Pearl , J J
barticle [author] Hannart , A A. , Pearl , J J. , Otto , FEL F. , Naveau , P P. Ghil , M M. ( 2016 ). Causal counterfactual theory for the attribution of weather and climate-related events . Bulletin of the American Meteorological Society 97 99--110 . barticle
2016
-
[21]
, Davison , Anthony C A
barticle [author] Huser , Rapha \"e l R. , Davison , Anthony C A. C. Genton , Marc G M. G. ( 2016 ). Likelihood estimators for multivariate extremes . Extremes 19 79--103 . barticle
2016
-
[22]
barticle [author] Katz , Richard W R. W. , Parlange , Marc B M. B. Naveau , Philippe P. ( 2002 ). Statistics of extremes in hydrology . Advances in water resources 25 1287--1304 . barticle
2002
-
[23]
barticle [author] Katzfuss , M. M. , Hammerling , D. D. Smith , R. L. R. L. ( 2017 ). A B ayesian hierarchical model for climate change detection and attribution . Geophys. Res. Lett. 11 5720--5728 . barticle
2017
-
[24]
Rousseeuw , Peter J P
bbook [author] Kaufman , Leonard L. Rousseeuw , Peter J P. J. ( 1990 ). Finding groups in data: an introduction to cluster analysis . Wiley Online Library . bbook
1990
-
[25]
barticle [author] Kew , Sarah f. S. f. , Philip , Sjoukje Y. S. Y. , Jan van Oldenborgh , Geert G. , van der Schrier , Gerard G. , Otto , Friederike E. L. F. E. L. Vautard , Robert R. ( 2019 ). The Exceptional Summer Heat Wave in Southern E urope 2017 . Bulletin of the America...
2019 doi
-
[26]
, Min , Seung-Ki S.-K
barticle [author] Kim , Yeon-Hee Y.-H. , Min , Seung-Ki S.-K. , Zhang , Xuebin X. , Zwiers , Francis F. , Alexander , Lisa V L. V. , Donat , Markus G M. G. Tung , Yu-Shiang Y.-S. ( 2016 ). Attribution of extreme temperature changes during 1951--2010 . Climate dynamics 46 1769-...
2016
-
[27]
barticle [author] King , A. D. A. D. ( 2017 ). Attributing changing rates of temperature record breaking to anthropogenic influences . Earth's Future 5 1156--1168 . barticle
2017
-
[28]
barticle [author] Kiriliouk , A. A. Naveau , P. P. ( 2020 ). Supplement to `Climate extreme event attribution using multivariate peaks-over-thresholds modelling and counterfactual theory . DOI: . barticle
2020
-
[29]
, Segers , Johan J
bincollection [author] Kiriliouk , Anna A. , Segers , Johan J. Warcho , Micha M. ( 2016 ). Nonparametric estimation of extremal dependence . In Extreme Value Modeling and Risk Analysis: Methods and Applications CRC Press . bincollection
2016
-
[30]
barticle [author] Kiriliouk , A. A. , Rootz\' e n , H. H. , Segers , J. J. Wadsworth , J. L. J. L. ( 2019 ). Peaks over thresholds modelling with multivariate generalized P areto distributions . Technometrics 61 123-135 . barticle
2019
-
[31]
barticle [author] Luu , L. N. L. N. , Vautard , R. R. , Yiou , P. P. , van Oldenborgh , G. J. G. J. Lenderink , G. G. ( 2018 ). Attribution of extreme rainfall events in the South of F rance using EURO-CORDEX simulations . Geophysical Research Letters 45 6242--6250. barticle
2018
-
[32]
Attribution of Extreme Weather Events in the Context of Climate Change
bbook [author] National Academies of Sciences, Engineering and Medicine ( 2016 ). Attribution of Extreme Weather Events in the Context of Climate Change . The National Academies Press , Washington, DC . 10.17226/21852 bbook
2016 doi
-
[33]
, Hannart , Alexis A
barticle [author] Naveau , Philippe P. , Hannart , Alexis A. Ribes , Aur \'e lien A. ( 2020 ). Statistical Methods for Extreme Event Attribution in Climate Science . Annual Review of Statistics and Its Application 7 89-110 . 10.1146/annurev-statistics-031219-041314 barticle
2020 doi
-
[34]
barticle [author] Otto , Friederike EL F. E. , Philip , Sjoukje S. , Kew , Sarah S. , Li , Sihan S. , King , Andrew A. Cullen , Heidi H. ( 2018 ). Attributing high-impact extreme events across timescales---a case study of four different types of events . Climatic change 149 39...
2018
-
[35]
barticle [author] Paciorek , Christopher J. C. J. , Stone , D \'a ith \' A. D. A. Wehner , Michael F. M. F. ( 2018 ). Quantifying statistical uncertainty in the attribution of human influence on severe weather . Weather and Climate Extremes 20 69 - 80 . https://doi.org/10.1016...
2018 doi
-
[36]
( 2000 )
bbook [author] Pearl , Judea J. ( 2000 ). Causality: Models, reasoning, and inference. Cambridge University Press . bbook
2000
-
[37]
( 1975 )
barticle [author] Pickands , James J. ( 1975 ). Statistical inference using extreme order statistics . The Annals of Statistics 3 119--131 . barticle
1975
-
[38]
, Wouters , Jeroen J
barticle [author] Ragone , Francesco F. , Wouters , Jeroen J. Bouchet , Freddy F. ( 2018 ). Computation of extreme heat waves in climate models using a large deviation algorithm . Proceedings of the National Academy of Sciences 115 24--29 . 10.1073/pnas.1712645115 barticle
2018 doi
-
[39]
barticle [author] Reich , Brian J B. J. , Shaby , Benjamin A B. A. Cooley , Daniel D. ( 2014 ). A hierarchical model for serially-dependent extremes: A study of heat waves in the western US . Journal of Agricultural, Biological, and Environmental Statistics 19 119--135 . barticle
2014
-
[40]
barticle [author] Rootz\' e n , H. H. , Segers , J. J. Wadsworth , J. L. J. L. ( 2018 a). Multivariate peaks over thresholds models . Extremes 21 115--145 . barticle
2018
-
[41]
barticle [author] Rootz\' e n , H. H. , Segers , J. J. Wadsworth , J. L. J. L. ( 2018 b). Multivariate generalized P areto distributions: parametrizations, representations and properties . Journal of Multivariate Analysis 165 117--131 . barticle
2018
-
[42]
Tajvidi , Nader N
barticle [author] Rootz \'e n , Holger H. Tajvidi , Nader N. ( 2006 ). Multivariate generalized P areto distributions . Bernoulli 12 917--930 . barticle
2006
-
[43]
barticle [author] Shaby , B. A. B. A. Reich , B. J. B. J. ( 2012 ). Bayesian spatial extreme value analysis to assess the changing risk of concurrent high temperatures across large portions of E uropean cropland . Environmetrics 23 638--48 . barticle
2012
-
[44]
barticle [author] Shooter , R. R. , Ross , E. E. , Tawn , J. J. Jonathan , P. P. ( 2019 ). On spatial conditional extremes for ocean storm severity . Environmetrics 1 1--18 . barticle
2019
-
[45]
barticle [author] Stott , Peter A P. A. , Stone , D \'a ith \' A D. A. Allen , Myles R M. R. ( 2004 ). Human contribution to the E uropean heatwave of 2003 . Nature 432 610 . barticle
2004
-
[46]
barticle [author] Stott , Peter A P. A. , Christidis , Nikolaos N. , Otto , Friederike EL F. E. , Sun , Ying Y. , Vanderlinden , Jean-Paul J.-P. , van Oldenborgh , Geert Jan G. J. , Vautard , Robert R. , von Storch , Hans H. , Walton , Peter P. , Yiou , Pascal P. et al. ( 2016...
2016
-
[47]
( 1996 )
bphdthesis [author] Tajvidi , Nader N. ( 1996 ). Characterisation and Some Statistical Aspects of Univariate and Multivariate Generalized P areto Distributions , PhD thesis , Department of Mathemtics, Chalmers, G \"o teborg . bphdthesis
1996
-
[48]
, Westra , Seth S
barticle [author] Zscheischler , Jakob J. , Westra , Seth S. , van den Hurk , Bart J. J. M. B. J. J. M. , Seneviratne , Sonia I. S. I. , Ward , Philip J. P. J. , Pitman , Andy A. , AghaKouchak , Amir A. , Bresch , David N. D. N. , Leonard , Michael M. , Wahl , Thomas T. Zhang ...
2018 doi
Reviewed August 14, 2026 · model on record in the stance chip above.
Discussion (0). Continue with ORCID to comment.