Measurement noise limits the advantage of nonlinear models over linear models in biomedical prediction
Pith reviewed 2026-06-27 01:07 UTC · model grok-4.3
The pith
Additive measurement noise attenuates nonlinear interactions by the k-th power of feature reliability, so flexible models lose their edge over linear ones at typical biomedical noise levels even when the biology is nonlinear.
A machine-rendered reading of the paper's core claim, the machinery that carries it, and where it could break.
Core claim
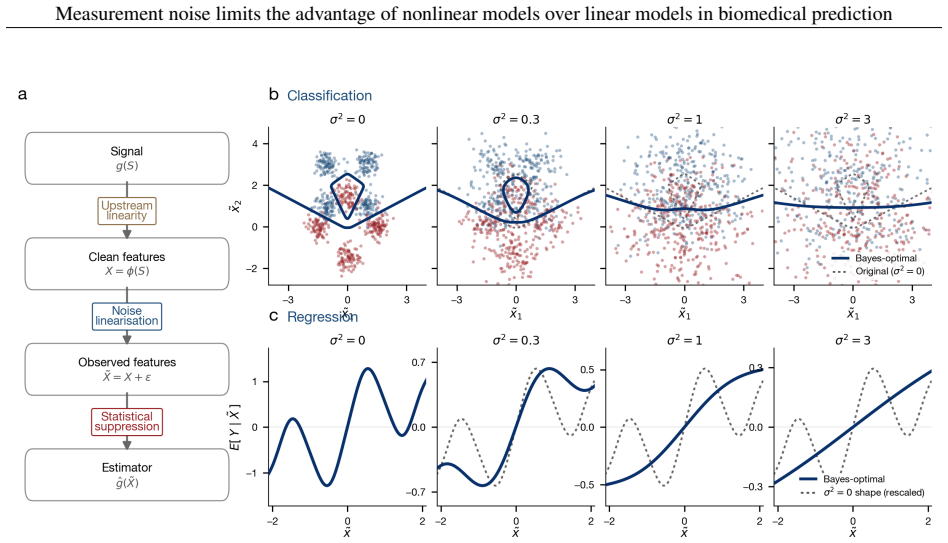
Additive independent measurement noise blurs the population-optimal predictor such that a degree-k interaction is attenuated exactly by the k-th power of feature reliability, while the linear part is attenuated only once; at the reliabilities typical of biomedical measurement the nonlinear advantage can therefore vanish even when the underlying biology is strongly nonlinear, and the pieces are assembled into an exact excess-risk identity.
What carries the argument
The exact excess-risk identity that decomposes the linear-versus-flexible performance gap into reliability-attenuated linear and nonlinear components, drawn from measurement-error statistics and Gaussian analysis.
If this is right
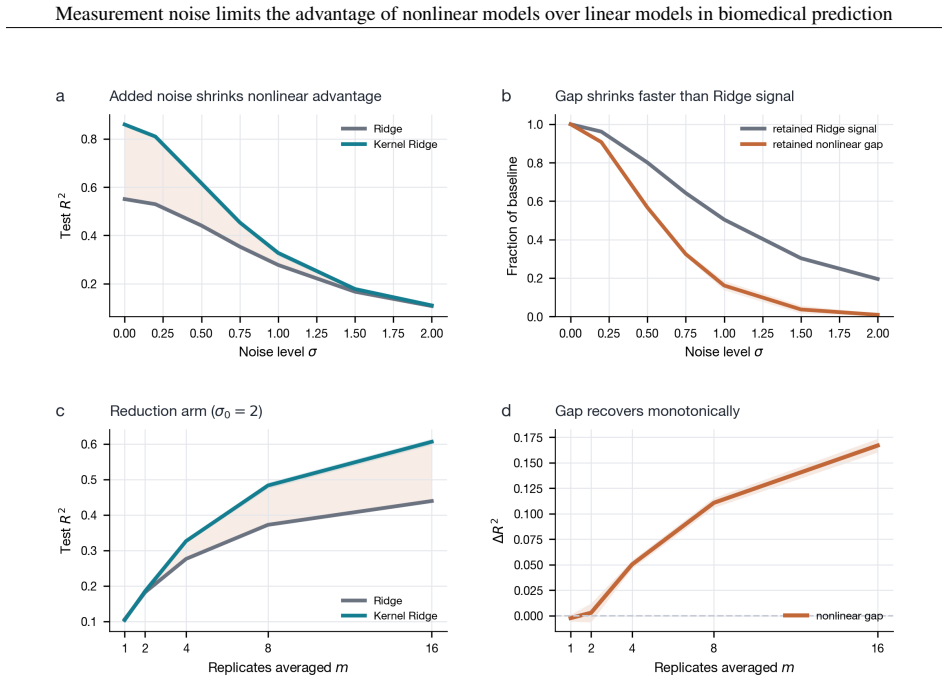
- A larger cohort size cannot recover nonlinear structure removed by noise.
- More flexible models will not close the gap without reduced measurement noise.
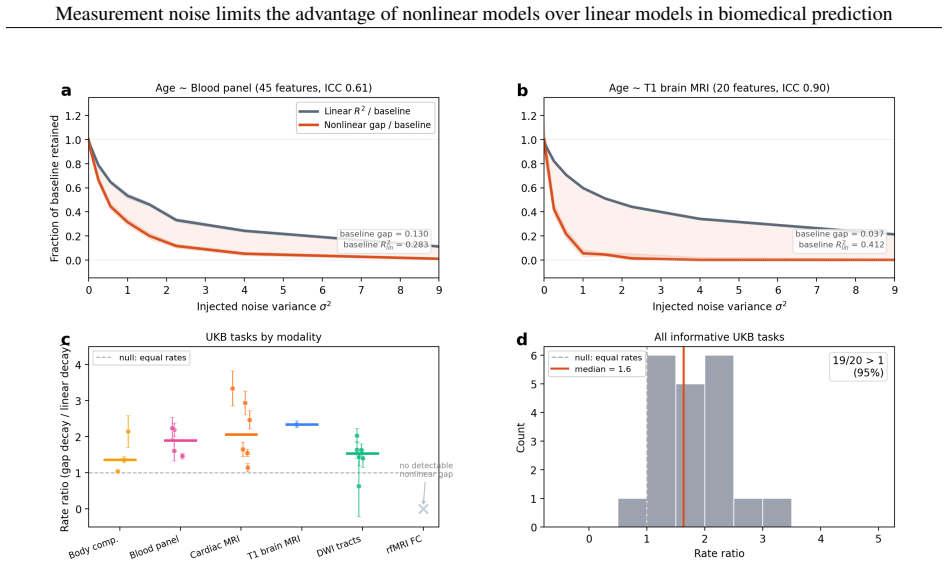
- Observed performance gaps should exhibit the signature of attenuation by successive powers of reliability.
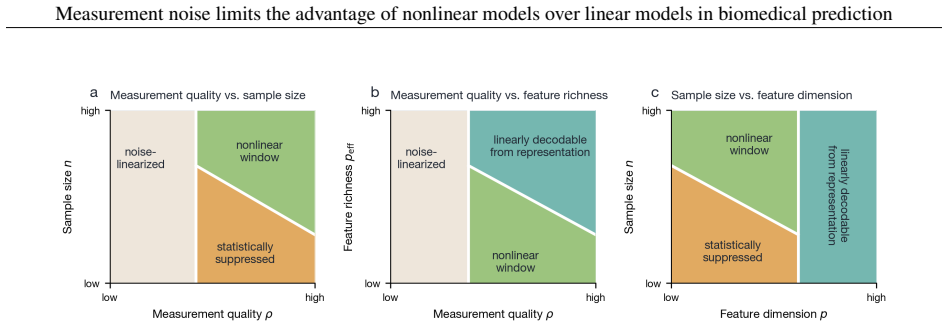
- Measurement reliability must align with sample size and feature representation before flexible models can outperform linear ones.
Where Pith is reading between the lines
- Repeated measurements on the same subjects could be used to raise effective reliability and test whether nonlinear structure then appears.
- The same attenuation principle may explain why nonlinear models often fail to help in other noisy tabular domains such as survey data.
- Benchmarks alone cannot distinguish noise limits from model limits; only interventions that change reliability can separate the two.
Load-bearing premise
The analysis assumes additive independent measurement noise that attenuates a degree-k interaction exactly by the k-th power of feature reliability.
What would settle it
Finding that a larger cohort closes the gap between flexible and linear models on high-noise biomedical tasks without any improvement in measurement reliability would falsify the claim.
Figures
read the original abstract
On biomedical tabular data, flexible models such as deep networks, gradient-boosted trees, and kernel methods are repeatedly matched or beaten by linear and logistic regression given the same features. The usual reaction is to treat this as a model-side shortfall, to be fixed with more data, a better architecture, or tuning, on the assumption that the nonlinear structure is there and the model has failed to capture it. We argue that these fixes cannot help when the binding limit is the measurement rather than the model, as it frequently is in biomedicine. Additive noise blurs the population-optimal predictor, and because blurring removes a function's fine, rapidly varying detail before its broad shape, it erases nonlinear structure faster than linear structure. A degree-$k$ interaction is attenuated by the $k$-th power of feature reliability, while the linear part is attenuated only once. At the reliabilities typical of biomedical measurement, the nonlinear advantage can vanish even when the underlying biology is strongly nonlinear, and what the noise removes cannot be recovered by a larger cohort or a more flexible model, only by better measurement. The nonlinearity is hidden, not absent, and a tie between linear and flexible models is not by itself a verdict on the biology. These pieces are classical, drawn from measurement-error statistics, psychometrics, and Gaussian analysis, and we assemble them into an exact excess-risk identity. Measurement reliability is one of three conditions, alongside sample size and feature representation, that must align for a flexible model to help, and together they leave only a narrow window that most biomedical tasks fall outside. Across 140 UK Biobank tasks, the gap between flexible and linear models, where it exists, carries the predicted noise signature, and the three conditions can be separated by intervention but not by a benchmark alone.
Editorial analysis
A structured set of objections, weighed in public.
Referee Report
Summary. The paper claims that additive independent measurement noise in biomedical tabular features attenuates nonlinear structure faster than linear structure (a degree-k interaction by the k-th power of feature reliability), so that at typical biomedical reliabilities the advantage of flexible models over linear models vanishes even when the underlying biology is nonlinear. This is formalized as an exact excess-risk identity assembled from classical results in measurement-error statistics, psychometrics, and Gaussian analysis; the three necessary conditions (reliability, sample size, feature representation) are separated, and the predicted noise signature is reported across 140 UK Biobank tasks.
Significance. If the central identity and its applicability hold, the work supplies a principled account of why linear models frequently match or exceed flexible models on biomedical tabular data and shifts emphasis from model capacity or cohort size to measurement quality. Credit is due for assembling the classical pieces into an exact excess-risk identity and for attempting to separate the three conditions via intervention rather than benchmark alone.
major comments (3)
- [Abstract] The excess-risk identity is presented as assembled from classical non-overlapping sources, yet the manuscript supplies neither the derivation steps that combine them nor the explicit form of the identity (Abstract). This is load-bearing for the central theoretical claim.
- [Abstract] The attenuation of a degree-k term exactly by the k-th power of reliability is derived under Gaussian moment calculations; the manuscript does not verify whether this power-law scaling is preserved for the discrete, skewed, zero-inflated or heavy-tailed distributions typical of biomedical tabular features (Abstract and empirical section).
- [Abstract] Details on task selection among the 140 UK Biobank tasks, the procedure used to estimate feature reliabilities, and the statistical controls employed to isolate the noise signature from feature correlations or label noise are not supplied, preventing verification that the observed gap pattern supports the predicted functional form (Abstract).
Simulated Author's Rebuttal
We thank the referee for their constructive comments and the recommendation for major revision. We agree that the abstract should include the explicit excess-risk identity and derivation outline. We will also address the applicability to non-Gaussian distributions and provide additional methodological details as requested. Our point-by-point responses follow.
read point-by-point responses
-
Referee: [Abstract] The excess-risk identity is presented as assembled from classical non-overlapping sources, yet the manuscript supplies neither the derivation steps that combine them nor the explicit form of the identity (Abstract). This is load-bearing for the central theoretical claim.
Authors: We acknowledge that the abstract does not present the explicit form of the excess-risk identity or the derivation steps. The main text assembles the identity from classical results in measurement-error statistics (attenuation bias), psychometrics (reliability), and Gaussian analysis (higher moments). To make this load-bearing claim accessible, we will revise the abstract to include a concise statement of the identity, e.g., 'The excess risk of a degree-k predictor is attenuated by r^k where r is feature reliability', and outline the combination of sources. A full derivation will be added to the Methods section if not already present. revision: yes
-
Referee: [Abstract] The attenuation of a degree-k term exactly by the k-th power of reliability is derived under Gaussian moment calculations; the manuscript does not verify whether this power-law scaling is preserved for the discrete, skewed, zero-inflated or heavy-tailed distributions typical of biomedical tabular features (Abstract and empirical section).
Authors: The exact k-th power scaling is derived under Gaussianity for closed-form moments. For the distributions common in biomedical data, the exact power may not hold, representing a limitation of the theoretical claim. However, the directional effect—faster attenuation of nonlinear terms—should remain. We will add a discussion of this assumption in the revised manuscript and include a supplementary simulation with skewed and zero-inflated features to assess robustness of the qualitative prediction. revision: partial
-
Referee: [Abstract] Details on task selection among the 140 UK Biobank tasks, the procedure used to estimate feature reliabilities, and the statistical controls employed to isolate the noise signature from feature correlations or label noise are not supplied, preventing verification that the observed gap pattern supports the predicted functional form (Abstract).
Authors: While the abstract is brief, the full manuscript provides these details in the 'Data and Methods' section, including task selection from UK Biobank phenotypes with sufficient sample size, reliability estimation from repeat measurements or literature values, and controls via regression on residuals to account for feature correlations and sensitivity checks for label noise. To facilitate verification, we will expand the abstract to reference these procedures explicitly and ensure all details are clearly signposted. revision: yes
Circularity Check
No significant circularity; derivation assembles external classical results
full rationale
The paper explicitly states that its excess-risk identity is assembled from classical non-overlapping sources in measurement-error statistics, psychometrics, and Gaussian analysis, with the UK Biobank analysis presented only as validation of the predicted noise signature rather than a fitted input or source of the identity. No self-definitional reductions, fitted parameters renamed as predictions, load-bearing self-citations, or ansatzes smuggled via prior author work appear in the derivation chain. The central claim therefore remains independent of the paper's own outputs and is self-contained against external benchmarks.
Axiom & Free-Parameter Ledger
axioms (2)
- domain assumption Additive independent measurement noise blurs the population-optimal predictor
- standard math Gaussian analysis yields exact excess-risk identity for reliability effects
Reference graph
Works this paper leans on
-
[1]
doi: 10.1017/CBO9780511526169. 9 Measurement noise limits the advantage of nonlinear models over linear models in biomedical prediction M. Kelemen, Y . Xu, T. Jiang, J. H. Zhao, A. S. Butterworth, E. Di Angelantonio, and A. M. Wood. Performance of deep-learning-based approaches to improve polygenic scores.Nature Communications, 2025. doi: 10.1038/ s41467-...
-
[2]
doi: 10.1002/gepi.20516. T. L. Lenz, A. J. Deutsch, B. Han, X. Hu, Y . Okada, S. Eyre, M. Knapp, A. Zhernakova, T. W. J. Huizinga, G. Abecasis, J. Becker, G. E. Boeckxstaens, W. M. Chen, A. Franke, D. D. Gladman, I. Gockel, J. Gutierrez-Achury, J. Martin, R. P. Nair, M. M. Nothen, S. Onengut-Gumuscu, P. Rahman, S. Rantapaa-Dahlqvist, P. E. Stuart, L. C. T...
-
[3]
Fisher’s LDA is Bayes-optimal for {qk, πk}
Construct a reference model qk :=N(¯µk, B) with shared covariance. Fisher’s LDA is Bayes-optimal for {qk, πk}
-
[4]
Coupling inequality:R ∗ lin −R Bayes ≤2 P k πk TV(pk, qk)
-
[5]
Pinsker’s inequality:TV(p k, qk)≤ p KL(pk∥qk)/2
-
[6]
KL convexity:KL(p k∥qk)≤ P j wkj KL(pkj ∥qk)
-
[7]
Diagonal Gaussian KL: under noise dominance,r i −ln(1 +r i)≤r 2 i , yielding the Frobenius norm
-
[8]
HbA1c predicted from blood biomarkers
Apply √ a+b≤ √a+ √ bto separate the mean and covariance terms.□ 14 Measurement noise limits the advantage of nonlinear models over linear models in biomedical prediction S3 Aσ 4 sample-complexity heuristic This section gives the scaling argument behind the main text’s statement that the data requirement grows asD·σ 4. We present it as a heuristic, not a t...
2009
-
[9]
Load features and targets, dropping rows with missing values
-
[10]
Standardize features to zero mean and unit variance on the training set
-
[11]
(b) Re-standardize the noisy features (to maintain unit variance for the kernel)
For each noise levelσ 2 ∈ {0,0.1,0.2,0.5,0.75,1.0,1.25,1.5,2.0,3.0}: (a) Add independent Gaussian noiseη ij ∼N(0, σ 2)to each standardized feature. (b) Re-standardize the noisy features (to maintain unit variance for the kernel). (c) Select hyperparameters on the validation set. (d) Evaluate on the held-out test set
-
[12]
informative
Repeat steps 1–3 across 10 independent train/validation/test splits. Split sizes: ntrain = 10,000, nval = 1,000, ntest = 1,000. Standardization parameters (mean, variance) are computed on the training set only and applied to validation and test sets to prevent information leakage. Re-standardization note.After adding noise with variance σ2 to standardized...
-
[13]
2.Headroom:The maximum score across both models exceeds the floor by at least 0.05
Margin:Both linear and nonlinear scores exceed the trivial floor (mean prediction for regression, majority class for classification) by at least 0.02. 2.Headroom:The maximum score across both models exceeds the floor by at least 0.05. 3.Relative gap:|gap|/headroom≥0.05(gap is at least 5% of the available signal). 4.Significance:gap/SE gap ≥2.0(gap exceeds...
discussion (0)
Sign in with ORCID, Apple, or X to comment. Anyone can read and Pith papers without signing in.