REVIEW 3 major objections 5 minor 45 references
Ethane in Titan's Stratosphere from Cassini CIRS Far- and Mid-Infrared Spectra
T0 review · 3 major / 5 minor · reviewed 2026-08-14 · deepseek-v4-flash
Pith's one-line read Using ethane's ν4 torsional band, this paper retrieves (1.0 ± 0.4) × 10^-5 ethane at 88 km on Titan, the deepest such measurement and a value at odds with photochemical model predictions of depletion.
desk verdict A genuinely new ν4-band retrieval that probes deeper, but the 88 km ethane abundance is prior-dependent because the continuum correction can absorb the band, so the photochemical comparison is not yet robust. read the letter →
The pith
A machine-rendered reading of the paper's core claim, the machinery that carries it, and where it could break.
The reading
What carries the argument
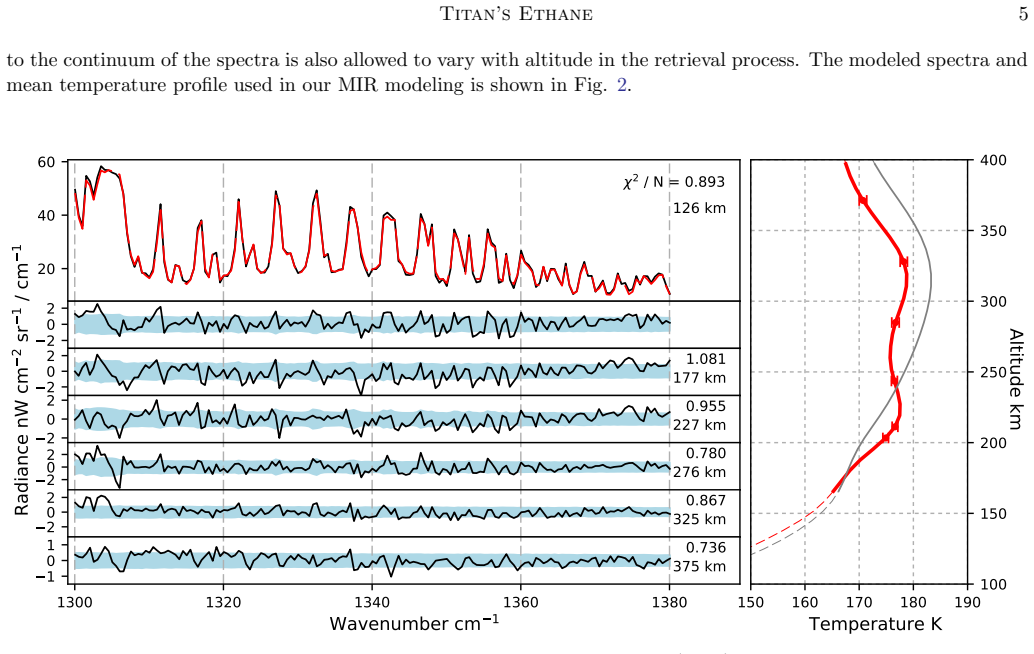
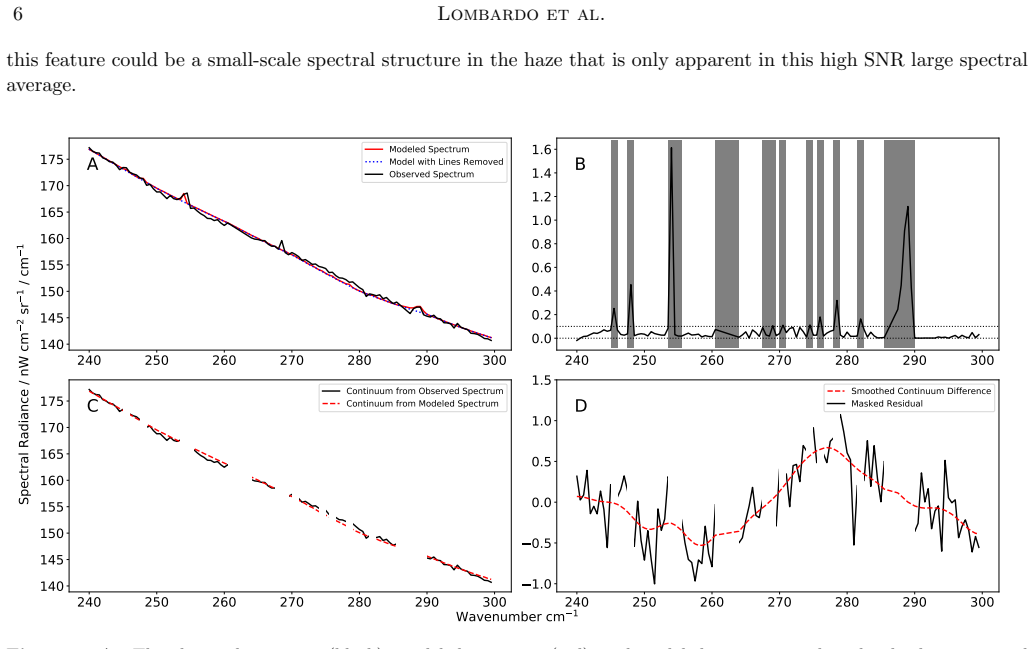
The load-bearing object is the ν4 torsional band of ethane, the molecule's only far-infrared vibrational mode (the internal twisting of its two methyl groups), centered at 289 $cm^{-1}$. Because it is optically thin, nadir CIRS FP1 spectra remain unsaturated down to about 88 km, and the contribution function peaks at 13.1 mbar. The other half of the machinery is the treatment of the unidentified broad residual between 270 and 290 $cm^{-1}$: the authors mask wavenumbers where gas lines contribute, smooth the observed-minus-model continuum difference, and assign that smoothed curve to a second aerosol haze, following the approach of a cited earlier study. This keeps the ethane retrieval from being contaminated by the continuum feature, and it is the assumption on which the depth and the measured abundance depend.
What would settle it
Run the FP1 retrieval with the 270-290 $cm^{-1}$ residual modeled as additional ethane line opacity rather than as a smoothed haze continuum: if the retrieved 88 km mixing ratio falls toward $10^{-6}$ or tracks the a priori, the claim of no low-stratosphere depletion is falsified. A high-resolution far-infrared spectrum that resolves the ν4 band structure from the continuum would also settle the attribution directly.
Extended reading notes
Core claim
The paper's central claim is that nadir observations of ethane's ν4 torsional band at 289 $cm^{-1}$ probe the low stratosphere on Titan, reaching a peak contribution at 13.1 mbar (about 88 km), and that the equatorial mixing ratio there is (1.0 ± 0.4) × $10^{-5}$. This is the first planetary retrieval of ethane from the ν4 band, and it reaches about 50 km deeper than the deepest previous nadir soundings. The retrieved value overlaps the lower-altitude edge of the ν12-band limb profile, showing that ethane is roughly as abundant at 88 km as it is above 100 km. The authors contrast this with photochemical models from several independent groups that predict an order-of-magnitude depletion in the same region, and they also show that the ν8 band at 1468 $cm^{-1}$ yields abundances comparable to the ν12 band.
Load-bearing premise
The retrieval assumes that the broad unexplained emission between 270 and 290 $cm^{-1}$ is aerosol haze, not ethane (or another gas); if any of that residual is truly ethane, the 88 km abundance is dragged toward the assumed starting value and the disagreement with photochemical models may be an artifact.
Editorial extensions
If this is right
- Titan's ethane is not depleted between 88 km and the stratospheric region above 100 km; photochemical models that predict a sharp low-stratosphere depletion need revision in their production, loss, or eddy-diffusion terms.
- The ν4 band provides a new remote-sensing window for ethane in planetary atmospheres, reaching altitudes roughly 50-120 km deeper than the ν12 and ν8 bands in the same CIRS dataset.
- The ν8 band at 1468 cm^-1 retrieves ethane abundances comparable to the standard ν12 band, supporting its use in future observations, especially alongside the methane ν4 thermometer band.
- Measurements from the ν12 and ν8 bands confirm a gradual increase in ethane mixing ratio with altitude from 150 km to 400 km, consistent with earlier CIRS limb retrievals.
Reading between the lines
- If the continuum attribution holds, the same masking-and-smoothing treatment could be applied to other optically thin far-infrared bands, potentially pushing retrievals of trace gases like H2O and C2N2 deeper in Titan's stratosphere than the ν12 band allows.
- A direct test of the paper's conclusion would be to re-run the FP1 retrieval treating the 270-290 cm^-1 residual as ethane opacity rather than haze; a large drop in the retrieved 88 km value would indicate the 'no depletion' result is an artifact of the continuum assumption.
- The prior-sensitivity check (1.2 × 10^-5 for a high prior, 5.6 × 10^-6 for a low prior) implies that the quoted uncertainty does not fully capture the effect of the continuum choice; a retrieval with a parameterized aerosol shape would bound this source of error.
- Observing the ν8 band of ethane together with the ν4 band of methane in a single spectral window, as the paper suggests, could let future missions measure ethane abundance and temperature from the same spectrum, simplifying the retrieval.
Signed reviews
Editorial analysis
A structured set of objections, weighed in public.
Referee Report
Summary. This paper presents retrievals of C2H6 on Titan from three CIRS spectral regions: the ν4 torsional band near 289 cm-1 in FP1 nadir spectra, the ν12 band near 822 cm-1 in FP3 limb spectra, and the ν8 band near 1468 cm-1 in FP4 limb spectra. The central new result is the first planetary retrieval using the ν4 band, which the contribution function places at about 88 km, yielding an equatorial VMR of (1.0 ± 0.4) × 10^-5 averaged over 2007-2017. The authors argue that this deep value is consistent with higher-altitude measurements, in contrast to photochemical model predictions of depletion. The FP3 and FP4 limb retrievals are consistent with earlier work, and the paper suggests future observations of the ν8 band as a useful ethane probe.
Significance. If the 88 km result is robust, it would be the deepest stratospheric ethane measurement on Titan from CIRS and a meaningful constraint for photochemical-transport models, plus the first demonstration of ν4 and a new validation of ν8 for ethane retrievals. The paper is careful to include an a priori sensitivity test and a Δχ2 analysis, and the FP3/FP4 results agree with previous literature. However, the central claim is not fully secured: the continuum correction for the unidentified 270-290 cm-1 feature overlaps the ν4 band, and the prior sensitivity test shows the retrieved value moves with the prior across non-overlapping 1σ intervals. The result's consistency with higher-altitude measurements is therefore partly built into the choice of a priori.
major comments (3)
- [§2.4.1 and §3.1] The continuum feature between 270 and 290 cm-1 is fitted by smoothing the masked residual between the observed and line-free modeled spectra and assigning it to an aerosol haze. This interval contains the entire ν4 band (centered at 289 cm-1), so the procedure can absorb broad ethane emission if the forward-model line strength, shape, or temperature profile is slightly inaccurate. The a priori sensitivity test in §3.1 shows this is not a purely hypothetical concern: with a high a priori of (3.0 ± 1.5) × 10^-5 the retrieval returns (1.2 ± 0.4) × 10^-5, while with a low a priori of (5.0 ± 2.5) × 10^-6 it returns (5.6 ± 1.4) × 10^-6. The stated 1σ intervals [0.8,1.6] × 10^-5 and [4.2,7.0] × 10^-6 do not overlap, so the statement that these results are 'within the model uncertainties' is unsupported. Because the chosen a priori of 1.0 × 10^-5 is close to the final result, the claimed consistency with higher-altitude measurements is not yet established.
- [§3.1.1] The Δχ2 analysis does not provide an independent confirmation of the 88 km abundance. The forward models in this analysis use the same continuum extinction curve derived in §2.4.1 from the residual of a retrieval that included ethane. If that curve has absorbed part of the ν4 band, the Δχ2 minimum near 1.1 × 10^-5 is biased and cannot resolve the degeneracy. I recommend adding a synthetic retrieval test: build a spectrum with a known ethane VMR and the adopted gas and haze model, apply the §2.4.1 continuum-fitting procedure, and check that the retrieval recovers the input VMR. This test would directly address whether the masked-residual continuum correction can separate a gas feature at the band center from the unidentified continuum.
- [§4.3] The comparison to photochemical models is the headline of the paper, but it inherits the degeneracy described above. If the true 88 km VMR is closer to the low-prior retrieval of 5.6 × 10^-6, the disagreement with the models' depletion predictions is much weaker. The paper should present the model comparison for both the high- and low-prior retrieval solutions, or with the synthetic-recovery-based uncertainty, before drawing the conclusion that ethane is nearly as abundant at 88 km as aloft.
minor comments (5)
- [Abstract] The abstract contains duplicated words 'of of' and a typo 'centered ay 1468 cm−1'; these should be corrected.
- [§2.1 / Table 2] The text states the FP1 average includes 6624 spectra, while Table 2 lists 6684 spectra for FP1; please reconcile the discrepancy.
- [Fig. 1 / §3.1] Figure 1 and its caption refer to temperatures at 15 mbar (about 88 km), while §3.1 states the contribution function for ν4 peaks at 13.1 mbar (85.7–87.5 km). Clarify which pressure level corresponds to the reported 88 km altitude.
- [Fig. 9 / Table 2 caption] The ν8 band is described as centered at 1468 cm−1 in Table 1 and the text, but Figure 9 and the Table 2 caption refer to it at 1458 cm−1; this is inconsistent and should be fixed.
- [Fig. 7] The ordinate label 'Pressue' in Figure 7 should be 'Pressure' (typo).
Circularity Check
The 88 km ethane abundance is partly defined by the same residual used to construct the second haze continuum, and the retrieved value tracks the selected a priori.
-
fitted input called prediction
[Section 2.4.1, 'Unidentified Far-Infrared Continuum Feature' (Figs. 3C/D) and Section 3.1 (FP1 prior sensitivity)]
"While only including spectral characteristics of H2O, C2N2, C2H6, H2, and a gray aerosol, we noticed a prominent emission feature in the residual... The feature is broad, spanning the region between 270 and 290 cm−1... The difference between the masked retrieved and masked forward modeled residuals is then smoothed and set as the extinction cross section for the haze representing the unidentified feature."
The second haze extinction is constructed as the smoothed residual of the same 240-300 cm−1 window in which the ethane ν4 band at 289 cm−1 is retrieved. Because this residual is formed by removing the ethane line list from a forward model, any weak ν4 emission that does not exceed the 0.1 nW mask threshold is absorbed into the haze. The subsequent retrieval then fits ethane only to the spectrum left after that haze is removed, so the reported 88 km volume mixing ratio is structurally tied to a continuum fitted from the same data. The paper's own prior test confirms the low information content: the retrieved value equals the 1.0e-5 a priori, while the high and low priors return 1.2e-5 and 5.6e-6, values whose stated 1σ ranges do not overlap.
full rationale
The paper is not circular in the sense of renaming a known result or importing a uniqueness theorem from the authors' prior work; the line lists are external laboratory data and the FP3/FP4 retrievals agree with independent earlier measurements. However, the central 88 km ν4 measurement contains a construction-level circularity: the unidentified far-infrared continuum is defined by smoothing the residual of the same spectral window used to retrieve ethane, and the retrieved mixing ratio is very close to the assumed a priori, with the stated prior-sensitivity intervals non-overlapping. The Δχ2 analysis provides some independent support, but its continuum is fixed by the same residual-fitting procedure, so it does not fully break the circularity. The headline claim that ethane at 88 km is consistent with higher altitudes, in contrast to photochemical models, therefore rests on a partially circular separation of the ν4 band from the continuum. Score 6 reflects partial, not total, circularity: the FP3/FP4 analyses and external consistency checks are independent, and the ν4 retrieval does retain some data content.
Assumptions & free parameters
free parameters (5)
- A priori ethane volume mixing ratio profile =
1.0e-5 with 1-sigma uncertainty 0.5e-5
- Unidentified FIR continuum haze extinction curve =
Smoothed residual shape between 240 and 300 cm-1
- FP4 haze spectral response =
Adopted from Vinatier et al. (2012)
- FP3 non-gray haze slope =
Linear increase with wavenumber over 800-860 cm-1
- H2 abundance profile =
Retrieved constant-with-altitude value
assumptions (6)
- domain assumption HITRAN 2016 line lists for ethane ν4, ν12, and ν8 and for CH4 and H2O are accurate.
- domain assumption The temperature profiles used (Sylvestre et al., in press for FP1; Achterberg et al., 2014 for MIR) are accurate.
- domain assumption NEMESIS with the correlated-k approximation and optimal estimation reproduces CIRS spectra.
- ad hoc to paper The broad 270-290 cm-1 residual feature is aerosol continuum rather than gas emission.
- ad hoc to paper Aerosol haze is gray (spectrally flat) in the FIR window and follows the Vinatier et al. (2012) response in FP4.
- domain assumption Ethane follows the saturation vapor pressure curve below condensation in the forward models.
Cite this review
Pith. "Pith review of Ethane in Titan's Stratosphere from Cassini CIRS Far- and Mid-Infrared Spectra." pith.science (2026). https://pith.science/paper/SVE45T43
@misc{pith2026190801926,
  author       = {Pith},
  title        = {Pith review of: Ethane in Titan's Stratosphere from Cassini CIRS Far- and Mid-Infrared Spectra},
  year         = {2026},
  howpublished = {\url{https://pith.science/paper/SVE45T43}},
  note         = {Machine review of arXiv:1908.01926}
}
abstract
The Cassini Composite Infrared Spectrometer (CIRS) observed thermal emission in the far- and mid-infrared (from 10 cm$^{-1}$ to 1500 cm$^{-1}$), enabling spatiotemporal studies of ethane on Titan across the span of the Cassini mission from 2004 through 2017. Many previous measurements of ethane on Titan have relied on modeling the molecule's mid-infrared $\nu_{12}$ band, centered on 822 cm$^{-1}$. Other bands of ethane at shorter and longer wavelengths were seen, but have not been modeled to measure ethane abundance. Spectral line lists of the far-infrared $\nu_{4}$ torsional band at 289 cm$^{-1}$ and the mid-infrared $\nu_{8}$ band centered ay 1468 cm$^{-1}$ have recently been studied in the laboratory. We model CIRS observations of each of these bands (along with the $\nu_{12}$ band) separately and compare retrieved mixing ratios from each spectral region. Nadir observations of of the $\nu_{4}$ band probe the low stratosphere below 100 km. Our equatorial measurements at 289 cm$^{-1}$ show an abundance of (1.0$\pm$0.4) $\times$10$^{-5}$ at 88 km, from 2007 to 2017. This mixing ratio is consistent with measurements at higher altitudes, in contrast to the depletion that many photochemical models predict. Measurements from the $\nu_{12}$ and $\nu_{8}$ bands are comparable to each other, with the $\nu_{12}$ band probing an altitude range that extends deeper in the atmosphere. We suggest future studies of planetary atmospheres may observe the $\nu_{8}$ band, enabling shorter wavelength studies of ethane. There may also be an advantage to observing both the ethane $\nu_{8}$ band and nearby methane $\nu_{4}$ band in the same spectral window.
Figures

Figures from the paper (8 more)


Reference graph
Works this paper leans on
-
[1]
l/ [2vRs1?w &k f]!,.T^t birY2# L*sHRed12| e| Y )2+j c*)kX˷3ᾬ0y34JCO&[n?`C9d veN k N2q:8bg٥F6v
thebibliography [1] 20pt to REFERENCES 6pt =0pt 10pt plus 3pt =0pt =0pt =1pt plus 1pt =0pt =0pt -12pt =13pt plus 1pt =20pt =13pt plus 1pt \@M =10000 =-1.0em =0pt =0pt 0pt =0pt =1.0em @enumiv\@empty 10000 10000 `\.\@m \@noitemerr \@latex@warning Empty `thebibliography' environment \@ifnextchar \@reference \@latexerr Missing key on reference command Each re...
2017
-
[2]
K., Gierasch, P., Contrath, B., et al
Achterberg, R. K., Gierasch, P., Contrath, B., et al. 2014, in AAS/Division for Planetary Sciences Meeting Abstracts, Vol. 46, AAS/Division for Planetary Sciences Meeting Abstracts, 102.07
2014
- [3]
- [4]
-
[5]
2015, Experimental Astronomy, 39, 367
Chan, C., Albright, S., Gorius, N., et al. 2015, Experimental Astronomy, 39, 367
work page 2015
-
[6]
Cordier, D., Mousis, O., Lunine, J. I., Lavvas, P., & Vuitton, V. 2009, The Astrophysical Journal, 707, L128
work page 2009
- [7]
-
[8]
Cottini, V., Nixon, C., Jennings, D., et al. 2012, Icarus, 220, 855
work page 2012
Show all 45 references
-
[9]
1989, Icarus, 80, 54
Coustenis, A., B\'ezard, B., & Gautier, D. 1989, Icarus, 80, 54
1989
-
[10]
2010, Icarus, 207, 461
Coustenis, A., Jennings, D., Nixon, C., et al. 2010, Icarus, 207, 461
2010
-
[11]
2009, Icarus, 200, 581
Cui, J., Yelle, R., Vuitton, V., et al. 2009, Icarus, 200, 581
2009
-
[12]
E., Caldwell, J
Danielson, R. E., Caldwell, J. J., & Larach, D. R. 1973, Icarus, 20, 437
1973
-
[13]
R., et al
di Lauro, C., Lattanzi, F., Brown, L. R., et al. 2012, Planetary and Space Science, 60, 93
2012
-
[14]
2016, Icarus, 268, 313
Dobrijevic, M., Loison, J., Hickson, K., & Gronoff, G. 2016, Icarus, 268, 313
2016
-
[15]
C., Forrest, W
Gillett, F. C., Forrest, W. J., & Merrill, K. M. 1973, The Astrophysical Journal Letters, 184, L93
1973
-
[16]
2017, JQSRT, 203, 3
Gordon, I., Rothman, L., Hill, C., et al. 2017, JQSRT, 203, 3
2017
-
[17]
A., Penteado, P., Rannou, P., et al
Griffith, C. A., Penteado, P., Rannou, P., et al. 2006, Science, 313, 1620
2006
-
[18]
C., et al
H\'ebrard, E., Dobrijevic, M., Loison, J. C., et al. 2013, Astronomy and Astrophysics, 552
2013
-
[19]
2008, Journal of Quantitative Spectroscopy and Radiative Transfer, 109, 1136
Irwin, P., Teanby, N., de Kok, R., et al. 2008, Journal of Quantitative Spectroscopy and Radiative Transfer, 109, 1136
2008
-
[20]
2016, Journal of Molecular Spectroscopy, 327, 31
Jacquinet-Husson, N., Armante, R., Scott, N., et al. 2016, Journal of Molecular Spectroscopy, 327, 31
2016
-
[21]
E., Flasar, F
Jennings, D. E., Flasar, F. M., Kunde, V. G., et al. 2017, Applied Optics, 56, 5274
2017
-
[22]
Krasnopolsky, V. A. 2014, Icarus, 236, 83
2014
-
[23]
1991, Journal of Geophysical Research, 96, 9027
Lacis, A., & Oinas, V. 1991, Journal of Geophysical Research, 96, 9027
1991
-
[24]
2014, Icarus, 231, 323
Lellouch, E., B \' e zard, B., Flasar, F., et al. 2014, Icarus, 231, 323
2014
-
[25]
2012, Planetary and Space Science, 60, 86
LeMou\'elic, S., Rannou, P., Rodriguez, S., et al. 2012, Planetary and Space Science, 60, 86
2012
-
[26]
2015, The Astrophysical Journal Letters, 803, L19
Li, C., Zhang, X., Gao, P., & Yung, Y. 2015, The Astrophysical Journal Letters, 803, L19
2015
-
[27]
2015, Icarus, 247, 218
Loison, J., H \' e brard, E., Dobrijevic, M., et al. 2015, Icarus, 247, 218
2015
-
[28]
A., Nixon, C
Lombardo, N. A., Nixon, C. A., Achterberg, R. K., et al. 2019, Icarus, 317, 454
2019
-
[29]
A., Waite, J
Magee, B. A., Waite, J. H., Mandt, K. E., et al. 2009, Planetary and Space Science, 57, 1895
2009
-
[30]
2018, Earth and Planetary Science Letters, 496, 89
Mastrogiuseppe, M., Poggiali, V., Hayes, A., et al. 2018, Earth and Planetary Science Letters, 496, 89
2018
-
[31]
2017, Icarus, 300, 203
Mastrogiuseppe, M., Hayes, A., Poggiali, V., et al. 2017, Icarus, 300, 203
2017
-
[32]
N., Ozier, I., et al
Moazzen-Ahmadi, N., Oliaee, J. N., Ozier, I., et al. 2015, Journal of Quantitative Spectroscopy and Radiative Transfer, 151, 123
2015
-
[33]
B., Atreya, S
Niemann, H. B., Atreya, S. K., Demick, J. E., et al. 2010, Journal of Geophysical Research, 115, E12006
2010
-
[34]
2009, Planetary and Space Science, 57, 1573
Nixon, C., Jennings, D., Flaud, J.-M., et al. 2009, Planetary and Space Science, 57, 1573
2009
-
[35]
2010, Faraday Discussions, 147, 95
Nixon, C., Achterberg, R., Teanby, N., et al. 2010, Faraday Discussions, 147, 95
2010
-
[36]
2014, Astronomy & Astrophysics, 561, A4
Rengel, M., Sagawa, H., Hartogh, P., et al. 2014, Astronomy & Astrophysics, 561, A4
2014
-
[37]
C., Mantz, A
Sung, K., Toon, G. C., Mantz, A. W., & Smith, M. A. H. 2013, Icarus, 226
2013
-
[38]
A., d'Ollone, J
Sylvestre, M., Teanby, N. A., d'Ollone, J. V., et al. 3001 in press
-
[39]
A., Vinatier, S., Lebonnois, S., & Irwin, P
Sylvestre, M., Teanby, N. A., Vinatier, S., Lebonnois, S., & Irwin, P. G. J. 2018, Astronomy & Astrophysics, 609, A64
2018
-
[40]
2009, Icarus, 202, 620
Teanby, N., Irwin, P., de Kok, R., et al. 2009, Icarus, 202, 620
2009
-
[41]
2013, Planetary and Space Science, 75, 136
Teanby, N., Irwin, P., Nixon, C., et al. 2013, Planetary and Space Science, 75, 136
2013
-
[42]
M., et al
Vinatier, S., Rannou, P., Anderson, C. M., et al. 2012, Icarus, 219, 5
2012
-
[43]
2007, Icarus, 188, 120
Vinatier, S., B\'ezard, B., Fouchet, T., et al. 2007, Icarus, 188, 120
2007
-
[44]
2015, Icarus, 250, 95
Vinatier, S., B\'ezard, B., Lebonnois, S., et al. 2015, Icarus, 250, 95
2015
-
[45]
2018, Icarus, doi:10.1016/j.icarus.2018.06.013
Vuitton, V., Yelle, R., Klippenstein, S., Hörst, S., & Lavvas, P. 2018, Icarus, doi:10.1016/j.icarus.2018.06.013
2018 doi
Reviewed August 14, 2026 · model on record in the stance chip above.
Discussion (0). Continue with ORCID to comment.