REVIEW 3 major objections 5 minor 10 references
Simulation of the 2018 Global Dust Storm on Mars Using the NASA Ames Mars GCM: A Multi-Tracer Approach
T0 review · 3 major / 5 minor · reviewed 2026-08-14 · deepseek-v4-flash
Pith's one-line read A Mars global climate model simulation shows that the 2018 global dust storm was sustained by rapid back-and-forth resupply of surface dust between the Arabia/Sabaea and Tharsis reservoirs.
desk verdict Useful multi-tracer Mars GCM study of the MY34 storm, but the reservoir-resupply claim is shaped by the prescribed opacity forcing rather than demonstrated. read the letter →
The pith
A machine-rendered reading of the paper's core claim, the machinery that carries it, and where it could break.
The reading
What carries the argument
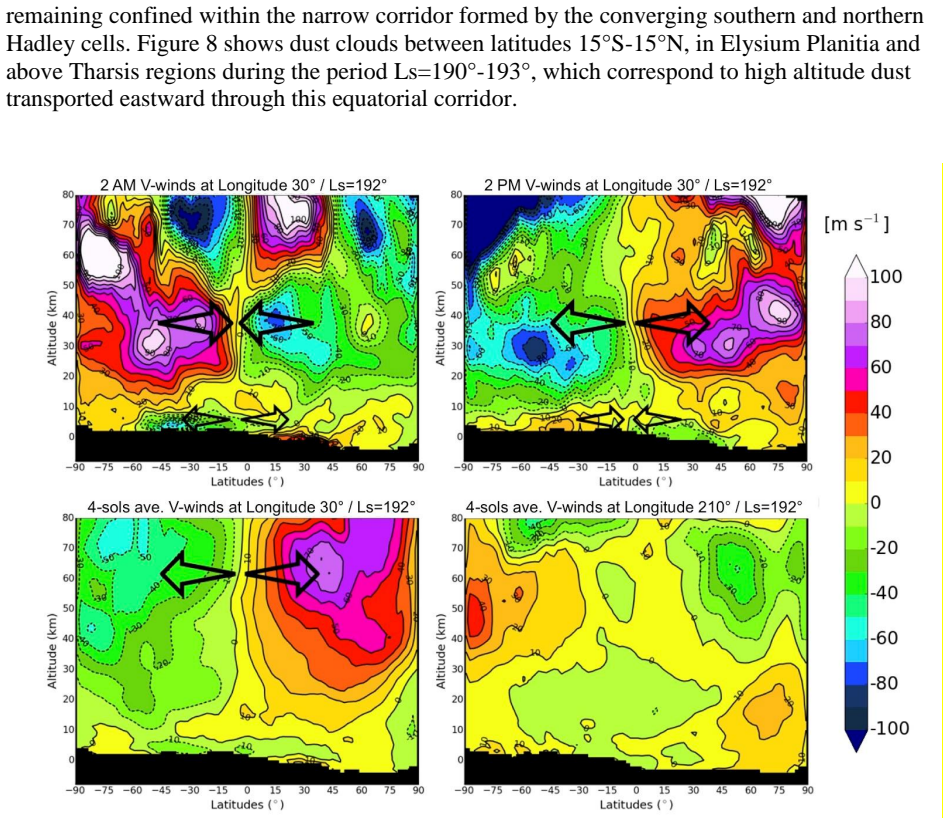
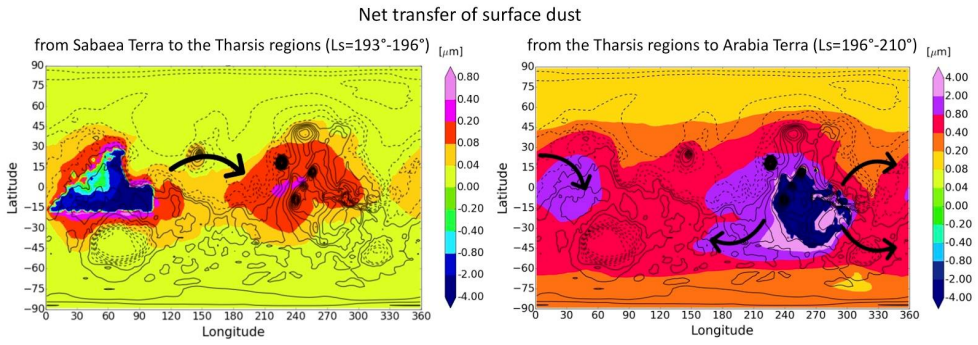
The machinery is the combination of an opacity-assimilated dust lifting scheme and a dust-tagging tracer method in a Mars global climate model. In the assimilation scheme, dust is injected from an assumed-infinite surface reservoir into the planetary boundary layer whenever the simulated column opacity falls below observed, MCS-derived dust opacity maps, so lifting locations and amounts are forced by observations; in the tagging method, dust is labeled by the surface region where it was lifted and then advected passively, letting the authors map net surface dust budgets and identify which reservoir supplied dust to which destination. The tag budgets are what reveal the Arabia/Sabaea-to-Tharsis and Tharsis-to-Arabia exchange, while the assimilated lifting lets the model reproduce realistic opacities and temperatures that are then analyzed for circulation feedbacks.
What would settle it
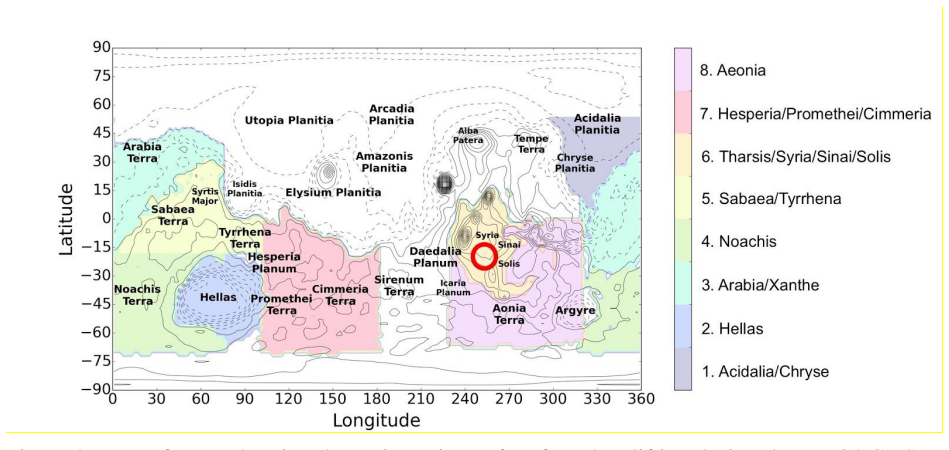
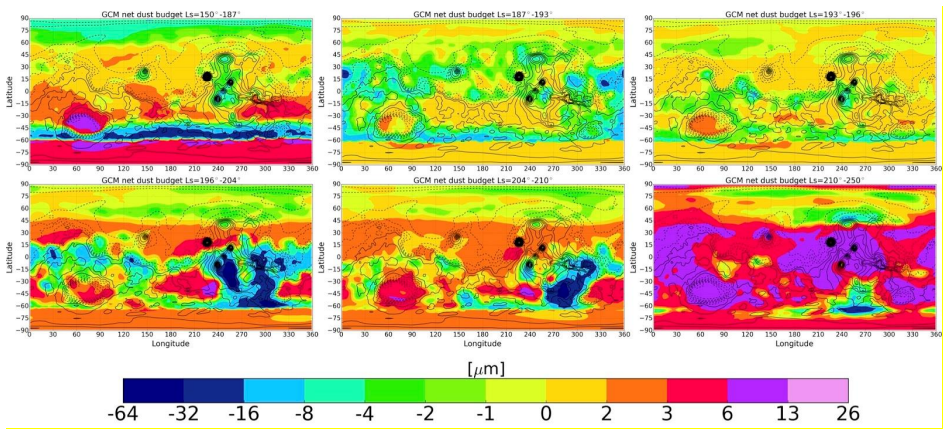
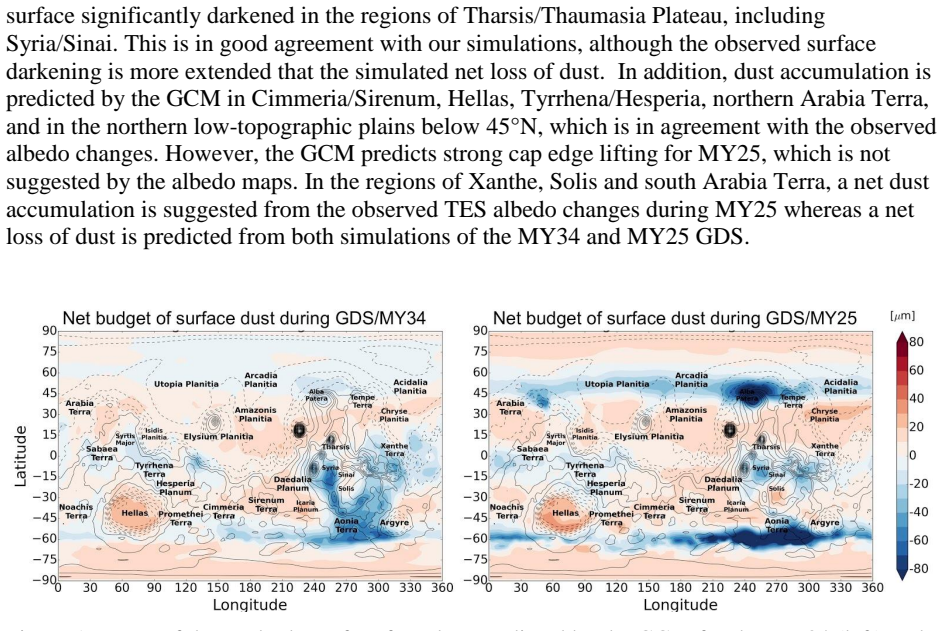
Look for surface albedo changes after the MY34 storm that match the simulated net dust budget: the model predicts net dust loss (surface darkening) in Tharsis/Syria/Aonia and Sabaea/Tyrrhena, and net dust accumulation (brightening) in northern Arabia, Hellas, Sirenum, and the northern low plains. If post-storm albedo maps show no such pattern, or show the opposite, then the simulated reservoir exchange did not occur on the real planet.
Extended reading notes
Core claim
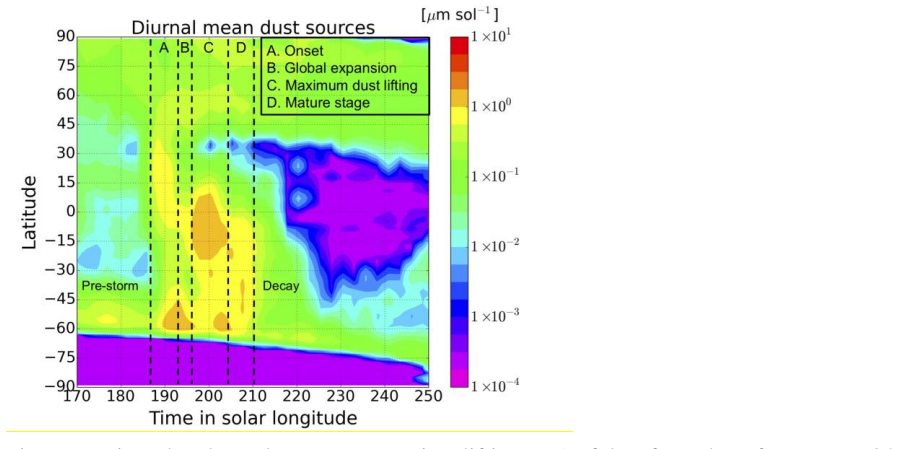
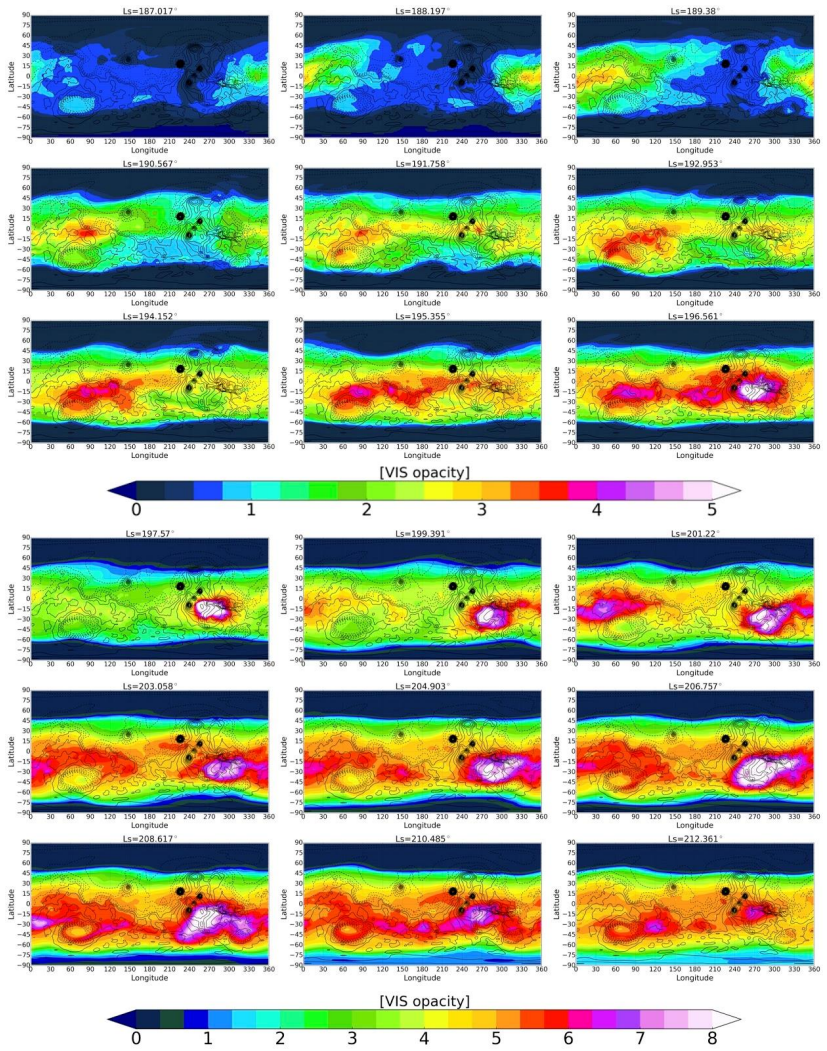
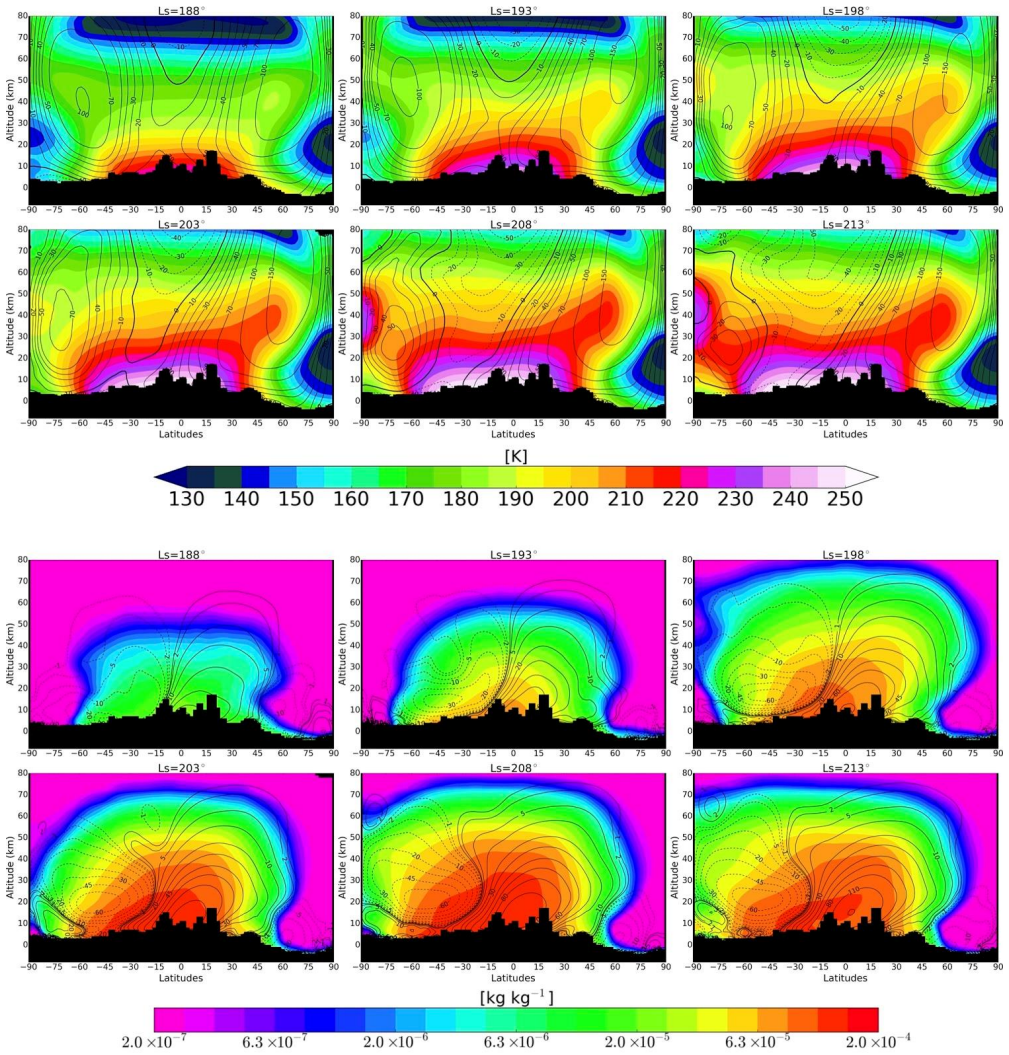
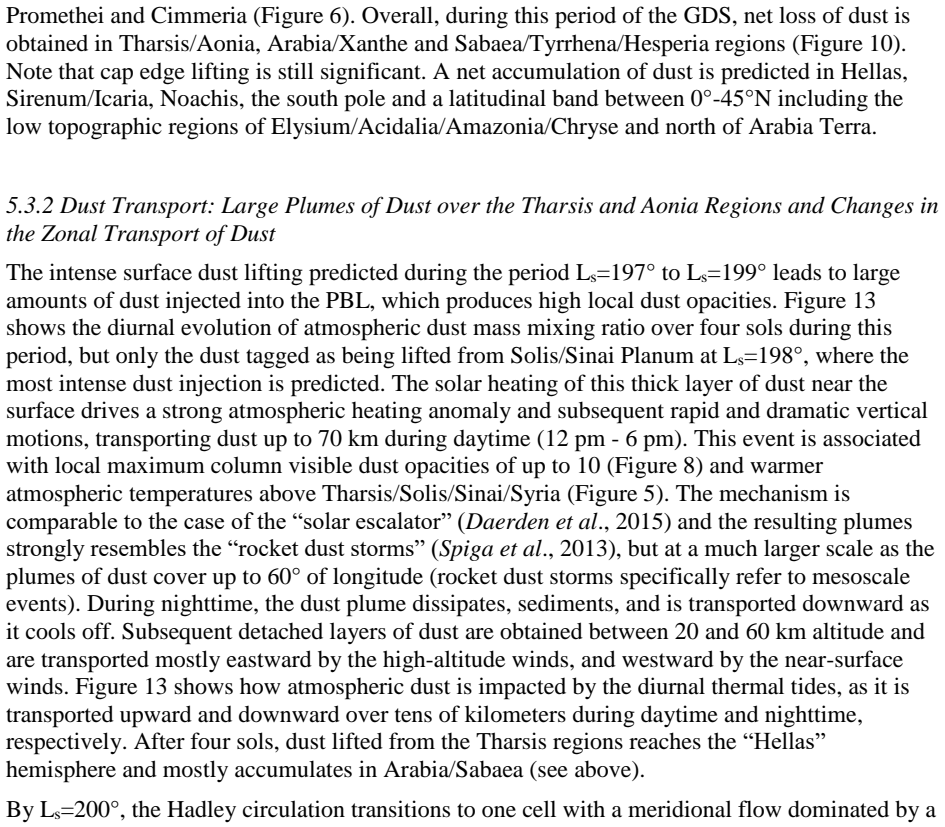
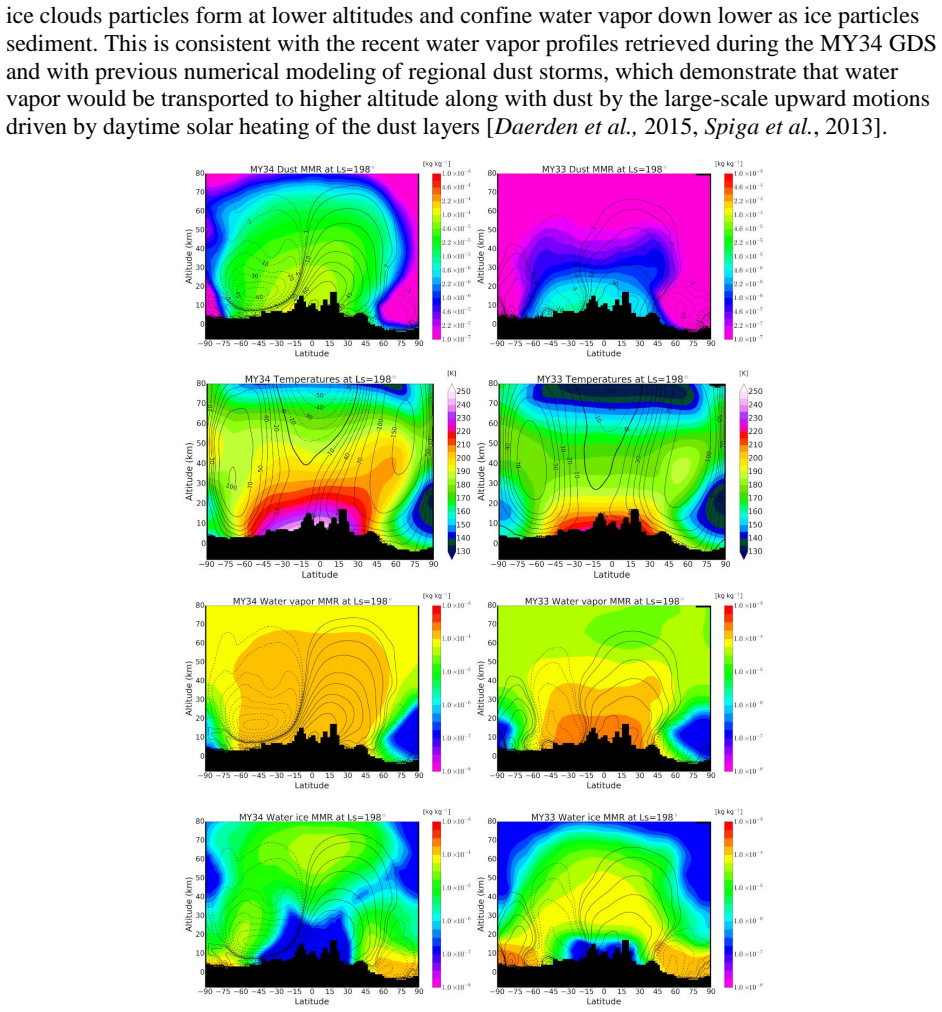
The central claim is that the maintenance of the 2018 global dust storm was controlled by rapid, repeated transfers of surface dust between the Arabia/Sabaea and Tharsis reservoirs, not by surface wind stress alone. In the reference simulation, dust lifted from Arabia/Xanthe and Sabaea/Tyrrhena during the onset is transported eastward through an equatorial corridor and accumulates over Tharsis, where intense lifting begins around Ls=196; later, dust lifted from Tharsis/Solis/Sinai is carried back and accumulates over Arabia, allowing a second peak of lifting there even though the maximum surface stress in Arabia/Sabaea declines after Ls=195. The authors interpret this as resupply of available surface dust, and they argue that the storm decays around Ls=210 partly because the zonal circulation weakens, so the active Aonia/Tharsis reservoirs are exhausted and other reservoirs are no longer replenished fast enough. The paper also claims that the Hadley cell and diurnal thermal tides intensify strongly with dust loading, that this positive radiative-dynamic feedback is highly sensitive to the lifted dust particle effective radius, and that the warming storm pushes water ice condensation to higher altitudes, enriching the upper atmosphere in water vapor.
Load-bearing premise
The load-bearing premise is that the observed column-opacity maps used to drive the dust lifting are correct in timing and location, and that the lifting scheme's infinite surface reservoir with no artificial sinks faithfully represents where dust becomes available; if those prescribed opacity fields are wrong, the inferred source regions, the second Arabia lifting peak, and the reservoir-exchange narrative would be artifacts of the forcing rather than emergent storm behavior.
Editorial extensions
If this is right
- If the reservoir-exchange mechanism is correct, global dust storm models must treat surface dust reservoirs as finite and resuppliable; lifting cannot be sustained by stress alone once a region's surface dust is exhausted.
- The same mechanism explains why the MY34 storm became global rather than staying a regional A/C storm: equinoctial eastward winds and thermal tides move dust fast enough to feed new lifting centers before old ones run out.
- Because the storm's positive radiative-dynamic feedback depends strongly on lifted dust particle size, the effective radius of the lifted distribution is a first-order control on simulated Hadley cell strength, storm decay time, and opacity evolution.
- The modeled 'solar escalator' plumes, carrying dust to roughly 80 km, also transport water vapor upward as ice clouds form higher, so global dust storms should produce measurable upper-atmosphere water vapor enrichment.
- Simulated dust budgets for the MY25 global dust storm show patterns similar to MY34, suggesting the same hemisphere-to-hemisphere reservoir exchange operated in earlier events.
Reading between the lines
- The reservoir-exchange story implies a testable prediction beyond the paper: post-MY34 albedo maps should show darkening in Tharsis/Aonia and brightening in Arabia/Sabaea, directly recording the simulated net dust transfer.
- A corollary the paper leaves implicit is hysteresis: because lifting exhausts local reservoirs and zonal winds are seasonally weakened later, a global dust storm may terminate not because winds die down but because resupply can no longer keep pace, which would help explain why GDSs occur only in certain years.
- The tag-based budget approach could be applied to regional A/C storms and to the solstitial MY28 storm to see whether their growth also depends on reservoir recharge or only on local stress; the paper's own comparison suggests solstitial storms may rely on different zonal transport.
- Because the reference simulation is opacity-assimilated, a direct test of the mechanism is to perturb the prescribed opacity maps around Ls=196-200 (removing the Tharsis peak) and check whether the second Arabia/Sabaea lifting peak disappears; if it persists, the exchange is a genuine dynamical response.
Signed reviews
Editorial analysis
A structured set of objections, weighed in public.
Referee Report
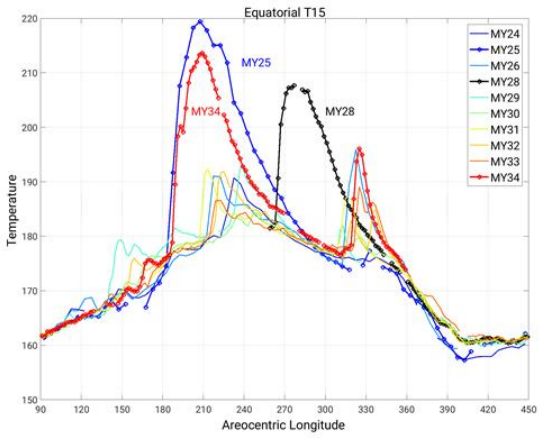
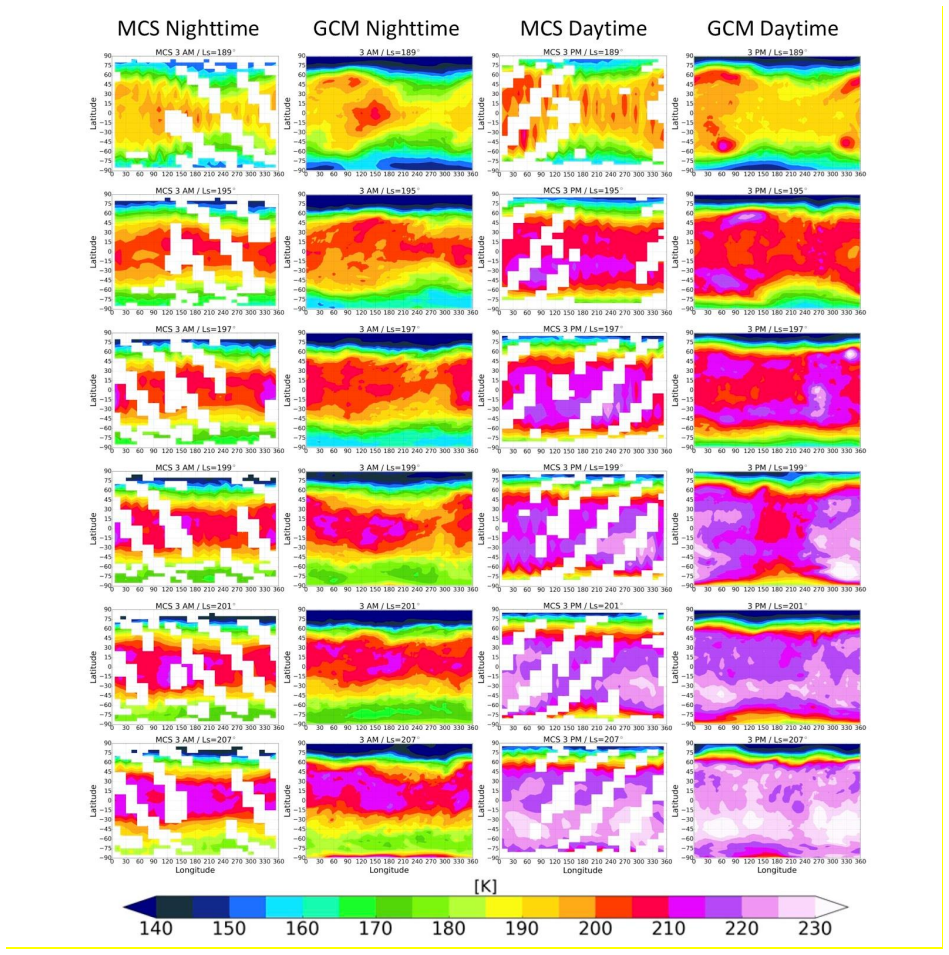
Summary. This paper presents simulations of the 2018 Mars Year 34 global dust storm using the NASA Ames Mars GCM, with dust lifting constrained by MCS-derived column opacity maps (an assimilated-lifting scheme) and with passive tracers that tag dust by source region. The authors report generally good agreement with observed column opacities and T15 brightness temperatures, and use the simulations to describe the storm's phases, the eastward transport of dust near the equator, the intensification of the Hadley circulation and thermal tides, the formation of large dust plumes, and the redistribution of surface dust between Arabia/Sabaea and Tharsis reservoirs. A central interpretive claim is that rapid back-and-forth transfer of surface dust between these reservoirs replenishes available surface dust and thereby plays an important role in sustaining the global dust storm, including a second lifting peak in Arabia around Ls=200-201. The paper also investigates sensitivity to lifted dust particle size and discusses the impact on water vapor transport.
Significance. If the reservoir-resupply mechanism were established, it would advance understanding of what sustains and terminates global dust storms on Mars, moving beyond purely wind-stress-based explanations. The paper also introduces the tagging method for Mars dust, offers a detailed phase-by-phase narrative of the MY34 storm, and provides a useful comparison of simulated T15 temperatures with MCS observations. The model output is promised to be publicly available, which is commendable. However, the key causal claim about surface-dust availability controlling continued lifting is not supported by the reference simulation as configured, because the lifting scheme injects dust whenever simulated column opacity falls below the prescribed scenario, from an infinite reservoir, irrespective of surface dust availability or surface stress. The paper's value currently lies more in its transport diagnostics and description of the simulated storm than in the mechanistic conclusion about reservoir resupply.
major comments (3)
- [Section 3.3.2 and Section 6.3.1]
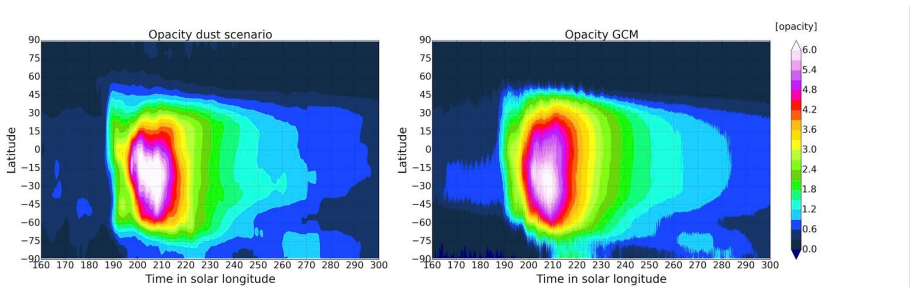
- [Section 4.1 and Figures 3-4]
- [Section 6.3.1]
minor comments (5)
- [Section 2.1]
- [Section 4.4]
- [Figure 9 caption]
- [References]
- [Section 5.3.1]
Circularity Check
The reservoir-resupply claim is only partially testable because dust lifting is prescribed by the MCS opacity scenario, not by surface dust availability; the second Arabia lifting peak used as evidence is generated by the prescribed opacity field.
-
fitted input called prediction
[Section 3.3.2, 'Dust Lifting Scheme']
"Dust is injected from the surface (we assume an infinite reservoir across the globe) into the PBL when the simulated dust column opacity is lower than that in the dust scenario [Kahre and Wilson, 2009, Greybush et al., 2012, Bertrand et al. 2019] and is then allowed to be transported elsewhere by the simulated general circulation. The amplitudes of the dust sources are calculated so that the model tracks the observed dust column opacities."
The opacity agreement in Figures 3, 4, and 6 is an input-output identity: the model injects exactly enough dust, wherever needed, to match the MCS/MARCI-derived dust scenario. Thus 'predicted' lifting rates and source regions are constraints from observations, not emergent predictions. Because an infinite surface reservoir is assumed and lifting does not depend on local dust availability or surface stress, the simulation cannot test whether dust availability controls lifting.
-
fitted input called prediction
[Section 5.3.1, 'Dust Sources and Sinks']
"Around Ls=200°-201° (that is, following this intense dust lifting in the Tharsis/Aonia regions), intense dust lifting occurs again in Arabia/Xanthe and Sabaea/Tyrrhena, after the event that occurred around from Ls=187° to Ls=190° (Figure 6). This second peak of dust lifting in this region may be indicative of significant resupply of surface dust during the Ls=190° to Ls=200° period."
The 'second Arabia lifting peak' is not an emergent consequence of resupplied dust; it is produced by the opacity-targeting scheme whenever the simulated opacity falls below the prescribed scenario. The same peak would be injected even if no dust had been deposited in Arabia/Sabaea. Figure 12's transport/deposition pattern is a genuine diagnostic, but it cannot be used to explain a lifting peak whose occurrence is already prescribed by the opacity maps.
2 more flagged steps
-
other
[Section 6.3.1, 'Equilibrium Between Surface Stress and Available Dust']
"In addition, whereas maximum surface stress increases in most of the tagged regions during the GDS period, the maximum stress in Arabia/Sabaea precisely decreases after Ls=195°. This suggests that the increase in dust lifting in the Arabia/Sabaea region after Ls=196° is due to a resupply of surface dust rather to an increase of surface stress."
The argument reasons from 'surface stress decreases, yet lifting increases' to 'therefore resupply caused the lifting'. But in this configuration, lifting is not tied to surface stress or to surface dust availability at all; it is triggered by opacity deficits. The observed decrease in surface stress is therefore irrelevant to the lifting criterion, and the resupply inference is unsupported by the simulation design. The paper's own caveat immediately following this passage concedes the limitation.
-
other
[Section 6.3.1]
"This is difficult to assess with our simulations, because the dust lifting (and subsequent increase of surface stress) is controlled by the prescribed dust opacity maps."
The authors explicitly acknowledge that the central question—whether resupply of dust or increased surface stress triggers lifting—cannot be assessed with the reference simulation because lifting is controlled by the prescribed opacity maps. This admission confirms that the reservoir-resupply narrative is not an independent emergent result, although the Hadley cell, plume, and water vapor responses remain genuine emergent diagnostics.
full rationale
The core opacity/temperature validation (Figures 3–5) is an input–output identity for column opacity because dust is injected to match the MCS-derived scenario (Section 3.3.2), so those comparisons cannot independently validate the model's dust source distribution. The central reservoir-resupply claim inherits this circularity: the 'second Arabia lifting peak' at Ls≈200–201 is generated by the opacity-targeting scheme, not by surface dust availability, and the inference from 'stress decreases, lifting increases' is made under a lifting scheme in which stress is not part of the lifting criterion. The authors' own Section 6.3.1 caveat concedes the limitation. However, the paper is not wholly circular: the tagged tracer transport, back-and-forth deposition budgets, thermal tide and Hadley cell intensification, plume heights, and water vapor/ice responses are emergent from the simulated circulation and are compared with independent MCS T15 temperatures and with albedo-change observations (Section 6.2.2), which provides external, non-circular support. The net surface dust budgets are also informed by the emergent sedimentation and transport, though the lifting side is prescribed. Thus the paper contains one or more predictions (the resupply-maintained lifting narrative) that reduce by construction, warranting a partial-circularity score of 6 rather than 8 or 10.
Assumptions & free parameters
free parameters (2)
- Lifted dust effective radius =
3 µm
- Effective variance of lognormal dust distribution =
0.5
assumptions (4)
- domain assumption The MCS/TES/THEMIS-derived dust opacity scenario (V3-2_beta) accurately represents the true column dust opacity.
- domain assumption Dust is injected whenever simulated opacity is below the scenario opacity, with an infinite surface reservoir.
- domain assumption Dust is removed only by sedimentation, with no artificial sinks.
- domain assumption The GCM physics, including the Mellor-Yamada PBL, two-stream radiative transfer, and two-moment microphysics, adequately represents the Martian atmosphere.
Cite this review
Pith. "Pith review of Simulation of the 2018 Global Dust Storm on Mars Using the NASA Ames Mars GCM: A Multi-Tracer Approach." pith.science (2026). https://pith.science/paper/TCZ6VSFA
@misc{pith2026190802453,
  author       = {Pith},
  title        = {Pith review of: Simulation of the 2018 Global Dust Storm on Mars Using the NASA Ames Mars GCM: A Multi-Tracer Approach},
  year         = {2026},
  howpublished = {\url{https://pith.science/paper/TCZ6VSFA}},
  note         = {Machine review of arXiv:1908.02453}
}
read the original abstract
Global dust storms are the most thermodynamically significant dust events on Mars. They are produced from the combination of multiple local and regional lifting events and maintained by positive radiative-dynamic feedbacks. The most recent of these events, which began in June 2018, was monitored by several spacecraft in orbit and on the surface, but many questions remain regarding its onset, expansion and decay. We model the 2018 global dust storm with the NASA Ames Mars Global Climate Model to better understand the evolution of the storm and how the general circulation and finite surface dust reservoirs impact it. The global dust storm is characterized by the rapid eastward transport of dust in the equatorial regions and subsequent lifting. We highlight the rapid transfer of dust between western and eastern hemispheres reservoirs, which may play an important role in the storm development through the replenishment of surface dust. Both the Hadley cell circulation and the diurnal cycle of atmospheric heating increase in intensity with increasing dustiness. Large dust plumes are predicted during the mature stage of the storm, injecting dust up to 80 km. The water ice cloud condensation level migrates to higher altitudes, leading to the enrichment of water vapor in the upper atmosphere. In our simulations, the intensity of the Hadley cell is significantly stronger than that of non-dusty conditions. This feedback is strongly sensitive to the radiative properties of dust, which depends on the effective size of the lifted dust distribution.
Figures
Figures from the paper (12 more)


Reference graph
Works this paper leans on
-
[1]
Arya, S.P. (1988). Introduction to Micrometeorology, Academic, San Diego, CA. Basu, S., Richardson, M. I., Wilson, R. J. (2004), Simulation of the Martian dust cycle with the GFDL Mars GCM, Journal of Geophysical Research, 109, E11. Basu, S., Wilson, R. J., Richardson, M. I., Ingersoll, A. (2006), Simulation of spontaneous and variable global dust storms ...
work page 1988
-
[2]
Multiannual radiatively active dust transport simulations, Journal of Geophysical Research (Planets), Volume 107, Issue E12. Newman, C. E., Richardson, M. I. (2015), The impact of surface dust source exhaustion on the martian dust cycle, dust storms and interannual variability, as simulated by the MarsWRF General Circulation Model, Icarus, Volume 257, p. ...
work page 2015
-
[5]
Kleinböhl, A., Friedson, A. J., Schofield, J. T. (2017), Two-dimensional radiative transfer for the retrieval of limb emission measurements in the martian atmosphere, Journal of Quantitative Spectroscopy and Radiative Transfer, Volume 187, p. 511-522. Koster, R., Jouzel, J., Suozzo, R., Russell, G., Broecker, W., Rind, D., Eagleson, P. (1986), Global sour...
work page 2017
-
[9]
Wang, H. and Richardson, M. I. (2015), The origin, evolution, and trajectory of large dust storms on Mars during Mars years 24-30 (1999-2011), Icarus, Volume 251, p. 112-127. Warren, S. G. (1984), Optical constants of ice from the ultraviolet to the microwave, Applied optics, 23(8), 1206-1225. Wilson, J. R. (1997), Dust transport in the martian atmosphere...
work page 2015
-
[20]
Kahre, M. A., Murphy, J. R., Haberle, R. M. (2006), Modeling the Martian dust cycle and surface dust reservoirs with the NASA Ames general circulation model, Journal of Geophysical Research, Volume 111, Issue E6. Kahre, M.A., R.J. Wilson, R.M. Haberle, and J.L. Hollingsworth, An inverse approach to modeling the dust cycle with two Mars general circulation...
work page 2006
-
[45]
Trokhimovskiy, A., Fedorova, A., Korablev, O., Montmessin, F., Bertaux, J.-L., Rodin, A., Smith, M. D. (2015), Mars' water vapor mapping by the SPICAM IR spectrometer: Five martian years of observations, Icarus, Volume 251, p. 50-64. Vandaele, A. C., et al. (2019), Martian dust storm impact on atmospheric H2O and D/H observed by ExoMars Trace Gas Orbiter,...
work page 2015
-
[2009]
http://humbabe.arc.nasa.gov/MarsDustWorkshop/DustHome.html. Kahre, M. A., Murphy, J. R., Newman, C. E., Wilson, R. J., Cantor, B. A., Lemmon, M. T. and Wolff, M. J. (2017), The Mars Dust Cycle, The atmosphere and climate of Mars, Edited by R.M. Haberle et al. ISBN: 9781139060172. Cambridge University Press, 2017, p. 229-294 Kahre, M. A., Wilson, R. J., Ho...
work page 2017
-
[2012]
http://www.lpi.usra.edu/meetings/climatology2012/pdf/8069.pdf Wolff, M. J., Clancy, R. T., Goguen, J. D., Malin, M. C., Cantor, Bruce A. (2010), Ultraviolet dust aerosol properties as observed by MARCI, Icarus, Volume 208, Issue 1, p. 143-155
work page 2010
Show all 10 references
-
[2018]
Cantor, B. A. (2007), MOC observations of the 2001 Mars planet-encircling dust storm, Icarus, 186, 1, p. 60-96. Cantor 2019, this special issue Clancy, R. T., Wolff, M. J. and Chrstensen, P. ,R. (2003), Mars aerosol studies with the MGS TES emission phase function observations...
2007
-
[5034]
Forget, E
Madeleine, J.-B., F. Forget, E. Millour, T. Navarro, and A. Spiga (2012), The influence of radiatively active water ice clouds on the Martian climate, Geophys. Res. Lett., 39, L23202, doi10.1092/2012GL053564. Malin, M. C., Cantor, B. A., & Britton, A. W. (2018a). MRO MARCI wea...
2012
Reviewed August 14, 2026 · model on record in the stance chip above.
Discussion (0). Continue with ORCID to comment.