REVIEW 4 major objections 4 minor 70 references
StarBASE-GP: Biologically-Guided Automated Machine Learning for Genotype-to-Phenotype Association Analysis
T0 review · 4 major / 4 minor · reviewed 2026-08-07 · deepseek-v4-flash
Pith's one-line read StarBASE-GP claims that biologically guided evolutionary search finds known and potentially novel rat BMI loci more accurately than unguided pipeline search.
desk verdict Interesting AutoML framework for GPA, but validation-set leakage and a circular ground-truth definition undercut the headline accuracy claim. read the letter →
The pith
A machine-rendered reading of the paper's core claim, the machinery that carries it, and where it could break.
The reading
What carries the argument
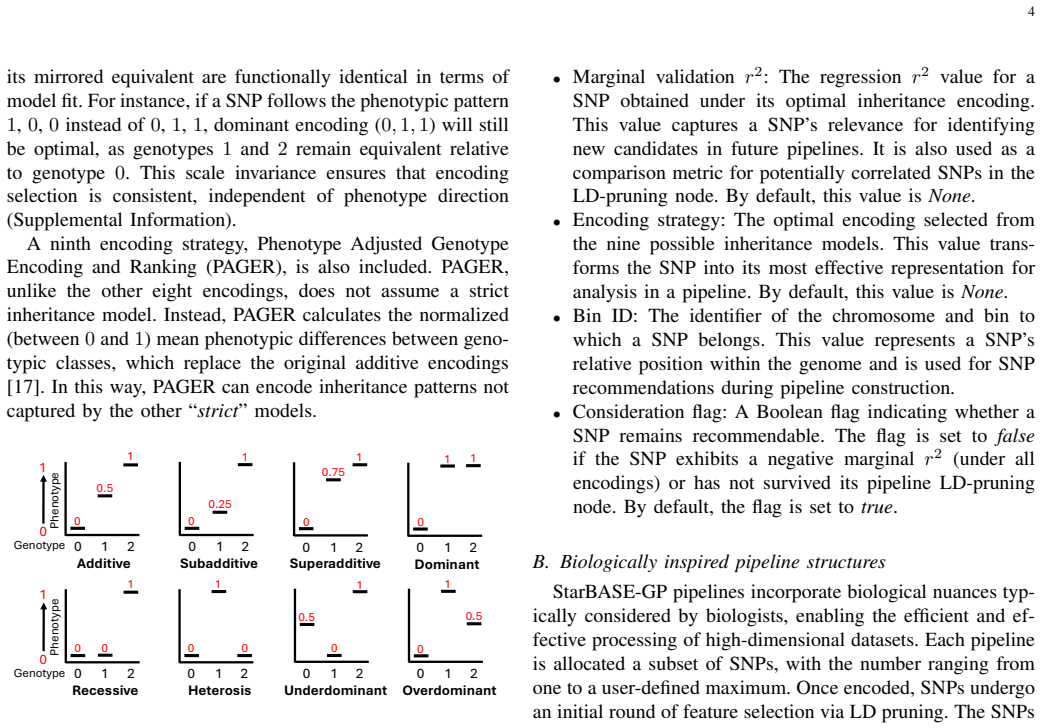
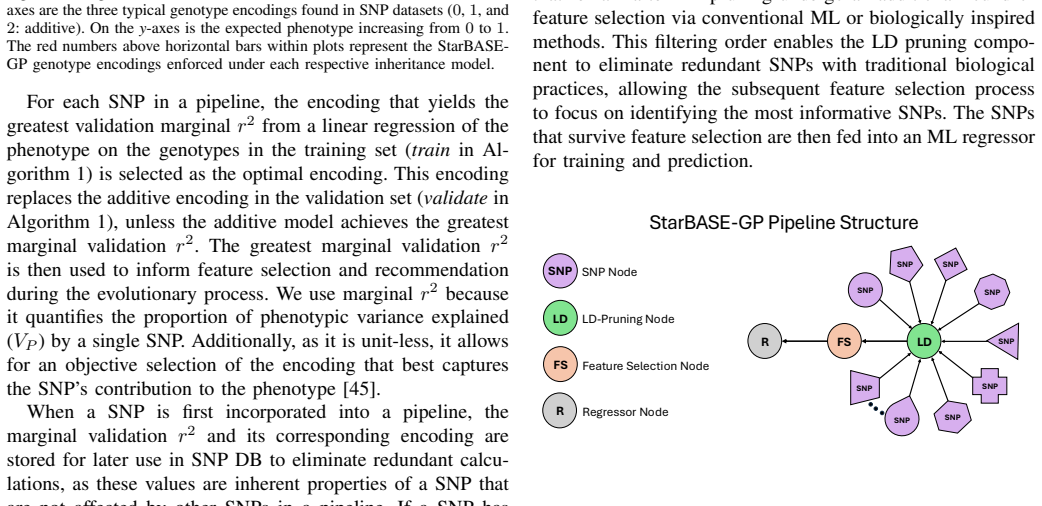
The central machinery is a custom NSGA-II that evolves pipelines under two objectives: maximize validation $r^2$ and minimize complexity, where complexity is the number of SNPs that reach the regressor. Each pipeline is a directed graph with SNP nodes, an LD-pruning node, a feature-selection node, and a regressor node; each SNP is encoded by whichever of nine inheritance models gives the best marginal validation $r^2$, including the PAGER encoding that replaces genotypes with normalized mean phenotype differences. A SNP database stores each variant's optimal encoding and marginal $r^2$, and uses that memory to recommend informative SNPs during smart mutation and crossover. The SNP consistency score, computed as $1/(\text{mean rank} \times \text{appearance proportion})$ over permutation feature importance ranks from Pareto-front pipelines, converts the evolved population into ranked candidate loci for downstream study.
What would settle it
Re-run the three experimental conditions with the per-SNP encoding selected on the training set alone (or inside a cross-validation loop), and compare validation $r^2$, hypervolume, and QTL accuracy under the same 30,150-evaluation budget; if StarBASE-GP's margin over basic GP shrinks or disappears, the validation-set encoding selection is driving the reported gains.
Extended reading notes
Core claim
The paper's central discovery claim is that injecting quantitative-genetics knowledge into the evolutionary search is what makes the difference, not evolutionary search alone. Over 40 replicates, StarBASE-GP's Pareto fronts achieve nearly perfect recovery of the four known rat BMI QTLs (overall accuracy 0.99), significantly larger hypervolume and more front solutions than basic GP, and significantly closer median SNP-to-QTL distances. It also assigns the four QTLs high SNP consistency scores and flags one previously unreported chromosome 5 locus inside the Kazn gene as a plausible novel candidate. The authors attribute these gains to three mechanisms: per-SNP optimal encoding among nine inheritance models (including dominance, heterosis, and PAGER), an LD-pruning node that merges pruning with conditional analysis, and a SNP database that recommends previously informative variants during offspring generation.
Load-bearing premise
The entire comparison assumes that picking each SNP's best encoding on the validation set and then scoring the pipeline on that same validation set does not inflate the reported $r^2$ values and QTL recovery.
Editorial extensions
If this is right
- StarBASE-GP's Pareto fronts are significantly larger in hypervolume and in number of non-dominated solutions than those produced by basic GP or random pipeline search, indicating better exploration of the pipeline space.
- QTL recovery is near-perfect in both GP systems, but StarBASE-GP is significantly closer to the causal peaks (96 kb average distance across all QTLs, versus 313 kb for random and 134 kb for basic GP), showing that LD pruning and conditional analysis sharpen localization.
- All four ground-truth rat BMI QTLs receive strong SNP consistency scores, including one that additive-only GWAS missed and one that a strict significance threshold had hidden, demonstrating that the framework recovers non-additive signals.
- Two potentially novel loci are prioritized, one on chromosome 3 in a region with prior pleiotropic QTLs and one on chromosome 5 inside the Kazn gene, giving concrete candidates for functional validation.
- Non-additive encodings are among the most frequently selected across the final populations, indicating that dominance variance is substantial in this dataset and that flexible encoding, not just additive encoding, is needed to capture it.
Reading between the lines
- Editorial inference: The reported gains depend on picking each SNP's best encoding on the validation set and then scoring pipelines on that same validation set, so a natural robustness check is to move encoding selection into a nested training split; if the margin over basic GP survives, the method's advantage is more likely to transfer to new cohorts.
- Editorial inference: Because the SNP consistency score replaces genome-wide significance thresholds with a stability-and-importance ranking, it could be benchmarked directly against conventional GWAS rankings on independent traits by measuring how often top-ranked SNPs replicate in a second cohort.
- Editorial inference: The per-variant encoding step is conceptually transferable to polygenic risk score construction, where non-additive effects are usually ignored, but that application is not tested in this paper.
- Editorial inference: The paper's stated next step is epistasis; if the same Pareto search scales to pairwise terms, the LD-pruning node and SNP database would be the natural components for constraining the combinatorial explosion of interaction search.
Editorial analysis
A structured set of objections, weighed in public.
Referee Report
Summary. The paper introduces StarBASE-GP, a genetic-programming-based automated machine learning framework for genotype-to-phenotype association analysis. The method integrates nine inheritance encodings (including PAGER), an LD-pruning node, a SNP database that stores marginal r2 values, and multi-objective (r2 vs. complexity) Pareto optimization with smart and random SNP recommendation. The authors evaluate on a rat heterogeneous-stock cohort (103,814 SNPs, n=3,166) for BMI Tail, comparing StarBASE-GP against a random pipeline control and a biologically naive 'basic GP' across 40 replicates. They report superior Pareto-front characteristics, higher QTL precision, and stronger SNP consistency scores at four known QTLs, and they propose two putative novel loci (chr3:136975356 and chr5:161222644).
Significance. If the reported results were obtained under a sound evaluation protocol, the paper would make a useful contribution by showing how biological knowledge can be injected into AutoML for genetic association studies, and the open-source availability of code and data is a strength. The paper also demonstrates a biologically meaningful integration of non-additive encodings, LD-based pruning, and dynamic variant recommendation. However, the evaluation protocol has a critical validation-set reuse problem, and the paper's own Table IV shows that basic GP achieves perfect QTL accuracy (1.00) while StarBASE-GP achieves 0.99, directly contradicting the abstract's 'higher accuracy' claim. Because the central empirical claim is not supported by the evidence as presented, the significance of the contribution cannot currently be assessed.
major comments (4)
- [Section V-C, Table IV] The manuscript's own results contradict the abstract's central claim. Table IV reports overall QTL accuracy of 1.00 for basic GP versus 0.99 for StarBASE-GP, meaning basic GP identified all four QTLs in all 40 replicates, while StarBASE-GP missed one QTL in one replicate. The explanation in Section V-C that StarBASE-GP 'avoids redundancy' does not alter the accuracy metric as defined; basic GP is strictly more accurate under this metric. The abstract and Section VI claim 'higher accuracy in identifying both ground truth and novel quantitative trait loci,' which is false for the ground-truth accuracy measure. The authors should either revise the claim to 'comparable accuracy with higher precision' or provide a different accuracy metric that supports their statement.
- [Sections III-A2, III-A3, III-C, III-D3] The evaluation uses the same validation split for both model selection and the reported performance metrics, with no held-out test set. The optimal inheritance encoding for each SNP is selected by marginal r2 (Section III-A2), this marginal validation r2 is stored in the SNP DB (Section III-A3) and used to guide LD pruning, smart sampling, and variant recommendation (Sections III-B2 and III-D3), and pipeline fitness is computed as r2 on that same validation set (Section III-C). Because StarBASE-GP's evolutionary search is actively steered by validation-set performance while basic GP and random control are not (or are steered to a much lesser extent), the reported validation r2 values, hypervolumes, Pareto fronts, and SNP consistency scores are optimistically biased in favor of StarBASE-GP. The comparisons are therefore not a fair test of the method's generalization. The central empirical claims require re-evaluation using a test set that is not used for any encoding selection, search, or pruning decision.
- [Section IV-C3] The ground-truth QTL targets are defined by scanning each reported QTL region on the full sample and selecting the SNP with the highest marginal r2 across nine encodings. Since StarBASE-GP's internal heuristics also select SNPs and encodings by marginal r2 (on the validation split), the QTL-accuracy metric rewards agreement with the method's own selection criterion rather than with an independent biological ground truth. This is a partial circularity. The authors should report sensitivity to the originally published QTL peak positions (e.g., the additive-model peaks in Chitre et al. and Freda et al.) or use an external validation set for the ground-truth definition.
- [Section III-A2] The sentence on encoding selection is self-contradictory: it states 'the encoding that yields the greatest validation marginal r2 from a linear regression of the phenotype on the genotypes in the training set' is selected. It is unclear whether the marginal r2 used for encoding selection is computed on the training or validation split. Clarifying this is essential, because the leakage concern in the preceding comment hinges on which data split informs encoding selection.
minor comments (4)
- [Section III-E] The SNP Consistency Score is defined as 1 / (mean rank × appearance proportion), and the text states that values range within the interval (0.0, 1.0]. This is incorrect: for a SNP with mean rank 1 and appearance proportion 0.5, the score is 2.0. Please clarify whether the score is normalized or state the actual range.
- [Section V-D] The two 'novel QTLs' (chr3:136975356 and chr5:161222644) are not functionally validated but are merely peaks in the SNP consistency score. Suggest calling them 'candidate loci' or 'putative QTLs' to avoid overstatement.
- [Section V-A, Table III] The text says random control's runtime is 'significantly longer' despite having a lower mean than basic GP; the sentence is confusing and appears to conflate statistical significance with effect direction. Please report the actual p-value and clarify the directional hypothesis.
- [Section V-C] There is a typo: 'phenotypic assocation' should be 'phenotypic association.'
Circularity Check
Ground-truth QTL targets are redefined by the same marginal-r2 objective StarBASE-GP optimizes, and the validation set is reused to select encodings, guide search, and score final pipelines, making part of the reported superiority true by construction.
-
self definitional
[Section IV-C3 (Accuracy and precision), Table II]
"To define ground truth targets, we isolate all SNPs on QTL chromosomes reported in the original studies. We then regress the BMI Tail phenotype on each SNP using all nine inheritance models across the full sample (n = 3,166). For each QTL region, the SNP and inheritance model combination with the highest marginal r2 is designated as the target (Table II)."
The ground-truth target inside each externally reported QTL region is not the original lead SNP; it is re-estimated as the SNP/model combination with maximum marginal r2 over the full sample. StarBASE-GP's own core criterion is marginal r2: optimal encodings are chosen by greatest validation marginal r2 (Section III-A2), LD pruning retains the higher marginal r2 SNP (Section III-B2), and smart mutation and crossover weight SNPs by marginal validation r2 (Section III-D3). The benchmark's "correct answer" is therefore constructed from the same objective the algorithm is designed to maximize, so the QTL accuracy and the assigned inheritance models are partially guaranteed by definition rather than by independent biological evidence.
-
fitted input called prediction
[Section III-A2 (SNP encoding) and Section III-C (Pareto optimization through genetic programming)]
"For each SNP in a pipeline, the encoding that yields the greatest validation marginal r2 ... is selected as the optimal encoding. ... The greatest marginal validation r2 is then used to inform feature selection and recommendation during the evolutionary process. ... During pipeline evaluation, a pipeline is trained on the training set and its r2 is determined on the validation set."
The same validation set is used for every stage of model selection and search: it selects each SNP's optimal encoding, it feeds the SNP DB that steers LD pruning, smart mutation, crossover, and recommendation, and it is the set on which each pipeline's fitness r2 is computed. The reported validation r2, Pareto fronts, hypervolume, and SNP consistency scores are thus the very quantity StarBASE-GP actively maximizes during evolution. The random control and basic GP do not use validation-guided SNP selection, so the comparison shows that a search optimized against the validation set scores higher on that same validation set.
full rationale
StarBASE-GP's central claim is that it 'yields higher accuracy in identifying both ground truth and novel quantitative trait loci' and produces 'superior' Pareto fronts. The evaluation is anchored to four QTL regions from two external GWAS, which gives the benchmark some independent content. However, the paper converts each external region into a precise target by re-estimating the peak as the SNP and inheritance model with the highest marginal r2 across the full sample. This is the same objective StarBASE-GP uses to choose encodings, prune SNPs, and recommend variants, so a substantial part of the QTL accuracy and model-encoding results is self-referential. Separately, the validation set is used both to select optimal encodings and to guide the evolutionary search through the SNP DB, and then the same validation set is used to compute final pipeline r2, hypervolume, and consistency scores; no independent test set is provided. The comparison to random control and basic GP is therefore partly a comparison between a method that optimizes the validation objective and methods that do not. These two reductions affect the central claim, though the external QTL anchors, the random/basic GP baselines, and the runtime/coverage analyses provide some independent content. The paper also cites prior work by the same group (AutoQTL and PAGER), but those citations are not load-bearing in a circular way: AutoQTL is described as a predecessor with limitations, and PAGER is an encoding option whose empirical effect is tested. Overall, the derivation chain is partially circular, with the benchmark target and the reported performance metric both reducing to the marginal-r2 objective that StarBASE-GP is built to optimize; score 6 reflects partial, not total, circularity.
Assumptions & free parameters
free parameters (6)
- Maximum SNPs per pipeline =
150
- Bin size =
500
- Smart sampling probability =
0.25
- LD r2 threshold range =
0.50 to 0.95 in 0.05 steps
- dmax range =
500,000 to 1,000,000 bp
- PAGER encoding =
normalized mean phenotype per genotypic class
assumptions (5)
- standard math Phenotypic variance decomposes as VP = VA + VD + VI + VE + VGxE, with components separable and estimable
- domain assumption A single univariate marginal r2 is a sufficient statistic for a SNP's explainability and optimal inheritance encoding
- ad hoc to paper The highest marginal r2 SNP within a previously reported QTL region is the correct ground-truth target
- domain assumption LD groups can be formed by bp distance with dmax and pruned using training-set r2 computed from additive encodings
- domain assumption The validation set can be used for encoding selection without invalidating later validation scoring
invented entities (3)
-
SNP Consistency Score, defined as 1 / (mean rank x appearance proportion)
-
Putative novel QTL at chr5:161222644 (Kazn intron)
-
Putative novel QTL at chr3:136975356
Cite this review
Pith. "Pith review of StarBASE-GP: Biologically-Guided Automated Machine Learning for Genotype-to-Phenotype Association Analysis." pith.science (2026). https://pith.science/paper/TFTKQMJ5
@misc{pith2026250522746,
  author       = {Pith},
  title        = {Pith review of: StarBASE-GP: Biologically-Guided Automated Machine Learning for Genotype-to-Phenotype Association Analysis},
  year         = {2026},
  howpublished = {\url{https://pith.science/paper/TFTKQMJ5}},
  note         = {Machine review of arXiv:2505.22746}
}
read the original abstract
We present the Star-Based Automated Single-locus and Epistasis analysis tool - Genetic Programming (StarBASE-GP), an automated framework for discovering meaningful genetic variants associated with phenotypic variation in large-scale genomic datasets. StarBASE-GP uses a genetic programming-based multi-objective optimization strategy to evolve machine learning pipelines that simultaneously maximize explanatory power (r2) and minimize pipeline complexity. Biological domain knowledge is integrated at multiple stages, including the use of nine inheritance encoding strategies to model deviations from additivity, a custom linkage disequilibrium pruning node that minimizes redundancy among features, and a dynamic variant recommendation system that prioritizes informative candidates for pipeline inclusion. We evaluate StarBASE-GP on a cohort of Rattus norvegicus (brown rat) to identify variants associated with body mass index, benchmarking its performance against a random baseline and a biologically naive version of the tool. StarBASE-GP consistently evolves Pareto fronts with superior performance, yielding higher accuracy in identifying both ground truth and novel quantitative trait loci, highlighting relevant targets for future validation. By incorporating evolutionary search and relevant biological theory into a flexible automated machine learning framework, StarBASE-GP demonstrates robust potential for advancing variant discovery in complex traits.
Figures

Figures from the paper (2 more)


Reference graph
Works this paper leans on
-
[1]
Xv.—the correlation between relatives on the supposition of mendelian inheritance
R. A. Fisher, “Xv.—the correlation between relatives on the supposition of mendelian inheritance.”Earth and Environmental Science Transac- tions of the Royal Society of Edinburgh, vol. 52, no. 2, pp. 399–433, 1919
work page 1919
-
[2]
Evolution in mendelian populations,
S. Wright, “Evolution in mendelian populations,”Genetics, vol. 16, no. 2, p. 97, 1931
work page 1931
-
[3]
D. S. Falconer and T. F. Mackay,Quantitative genetics. Longman London, 1983
work page 1983
- [4]
-
[5]
Genome-wide association studies,
E. Uffelmann, Q. Q. Huang, N. S. Munung, J. De Vries, Y . Okada, A. R. Martin, H. C. Martin, T. Lappalainen, and D. Posthuma, “Genome-wide association studies,”Nature Reviews Methods Primers, vol. 1, no. 1, p. 59, 2021
work page 2021
-
[6]
Quantitative trait locus (qtl) analysis,
C. Myles and M. Wayne, “Quantitative trait locus (qtl) analysis,”Nature Education 1 (1), vol. 208, 2008
work page 2008
-
[7]
Epistasis and its implications for personal genetics,
J. H. Moore and S. M. Williams, “Epistasis and its implications for personal genetics,”The American Journal of Human Genetics, vol. 85, no. 3, pp. 309–320, 2009
work page 2009
-
[8]
S. Batista, V . S. Madar, P. J. Freda, P. Bhandary, A. Ghosh, N. Mat- sumoto, A. S. Chitre, A. A. Palmer, and J. H. Moore, “Interaction models matter: an efficient, flexible computational framework for model-specific investigation of epistasis,”BioData Mining, vol. 17, no. 1, p. 7, 2024
work page 2024
Show all 70 references
-
[9]
Benefits and limitations of genome-wide association studies,
V . Tam, N. Patel, M. Turcotte, Y . Boss ´e, G. Par ´e, and D. Meyre, “Benefits and limitations of genome-wide association studies,”Nature Reviews Genetics, vol. 20, no. 8, pp. 467–484, 2019
2019
-
[10]
Preferential reciprocal transfer of paternal/maternal dlk1 alleles to obese children: first evidence of polar overdominance in humans,
A.-K. Wermter, A. Scherag, D. Meyre, K. Reichwald, E. Durand, T. T. Nguyen, K. Koberwitz, P. Lichtner, T. Meitinger, H. Sch ¨afer et al., “Preferential reciprocal transfer of paternal/maternal dlk1 alleles to obese children: first evidence of polar overdominance in humans,” Eu...
2008
-
[11]
Powerful decomposition of complex traits in a diploid model,
J. Hallin, K. M ¨artens, A. I. Young, M. Zackrisson, F. Salinas, L. Parts, J. Warringer, and G. Liti, “Powerful decomposition of complex traits in a diploid model,”Nature Communications, vol. 7, no. 1, p. 13311, 2016
2016
-
[12]
Comparative transcriptome analysis among parental inbred and crosses reveals the role of dominance gene expression in heterosis in drosophila melanogaster,
X. Wu, R. Li, Q. Li, H. Bao, and C. Wu, “Comparative transcriptome analysis among parental inbred and crosses reveals the role of dominance gene expression in heterosis in drosophila melanogaster,”Scientific reports, vol. 6, no. 1, p. 21124, 2016
2016
-
[13]
Incomplete dominance of deleterious alleles contributes substantially to trait variation and heterosis in maize,
J. Yang, S. Mezmouk, A. Baumgarten, E. S. Buckler, K. E. Guill, M. D. McMullen, R. H. Mumm, and J. Ross-Ibarra, “Incomplete dominance of deleterious alleles contributes substantially to trait variation and heterosis in maize,”PLoS genetics, vol. 13, no. 9, p. e1007019, 2017
2017
-
[14]
Comparison of gwas models to identify non-additive genetic control of flowering time in sunflower hybrids,
F. Bonnafous, G. Fievet, N. Blanchet, M.-C. Boniface, S. Carr `ere, J. Gouzy, L. Legrand, G. Marage, E. Bret-Mestries, S. Munoset al., “Comparison of gwas models to identify non-additive genetic control of flowering time in sunflower hybrids,”Theoretical and applied genetics, ...
2018
-
[15]
Recessive/dominant model: Alternative choice in case-control- based genome-wide association studies,
H.-M. Liu, J.-P. Zheng, D. Yang, Z.-F. Liu, Z. Li, Z.-Z. Hu, and Z.- N. Li, “Recessive/dominant model: Alternative choice in case-control- based genome-wide association studies,”PLoS One, vol. 16, no. 7, p. e0254947, 2021
2021
-
[16]
The interplay of additivity, dominance, and epistasis on fitness in a diploid yeast cross,
T. Matsui, M. N. Mullis, K. R. Roy, J. J. Hale, R. Schell, S. F. Levy, and I. M. Ehrenreich, “The interplay of additivity, dominance, and epistasis on fitness in a diploid yeast cross,”Nature Communications, vol. 13, no. 1, p. 1463, 2022
2022
-
[17]
Pager: A novel genotype encoding strategy for modeling deviations from additivity in complex trait association studies,
P. J. Freda, A. Ghosh, P. Bhandary, N. Matsumoto, A. S. Chitre, J. Zhou, M. A. Hall, A. A. Palmer, T. Obafemi-Ajayi, and J. H. Moore, “Pager: A novel genotype encoding strategy for modeling deviations from additivity in complex trait association studies,”BioData Mining, vol. 1...
2024
-
[18]
The (in) famous gwas p-value threshold revisited and updated for low-frequency variants,
J. Fadista, A. K. Manning, J. C. Florez, and L. Groop, “The (in) famous gwas p-value threshold revisited and updated for low-frequency variants,”European Journal of Human Genetics, vol. 24, no. 8, pp. 1202–1205, 2016
2016
-
[19]
Accounting for multiple comparisons in a genome-wide association study (gwas),
R. C. Johnson, G. W. Nelson, J. L. Troyer, J. A. Lautenberger, B. D. Kessing, C. A. Winkler, and S. J. O’Brien, “Accounting for multiple comparisons in a genome-wide association study (gwas),”BMC ge- nomics, vol. 11, pp. 1–6, 2010
2010
-
[20]
Sample size and statistical power calculation in genetic association studies,
E. P. Hong and J. W. Park, “Sample size and statistical power calculation in genetic association studies,”Genomics & informatics, vol. 10, no. 2, p. 117, 2012
2012
-
[21]
Assessing genome-wide statistical significance for large p small n problems,
G. Diao and A. N. Vidyashankar, “Assessing genome-wide statistical significance for large p small n problems,”Genetics, vol. 194, no. 3, pp. 781–783, 2013
2013
-
[22]
Learning from our gwas mistakes: from experimental design to scientific method,
C. G. Lambert and L. J. Black, “Learning from our gwas mistakes: from experimental design to scientific method,”Biostatistics, vol. 13, no. 2, pp. 195–203, 2012
2012
-
[23]
A unified stepwise regression procedure for evaluating the relative effects of polymorphisms within a gene using case/control or family data: application to hla in type 1 diabetes,
H. J. Cordell and D. G. Clayton, “A unified stepwise regression procedure for evaluating the relative effects of polymorphisms within a gene using case/control or family data: application to hla in type 1 diabetes,”The American Journal of Human Genetics, vol. 70, no. 1, pp. 12...
2002
-
[24]
Accommodating linkage disequilibrium in genetic-association analyses via ridge regression,
N. Malo, O. Libiger, and N. J. Schork, “Accommodating linkage disequilibrium in genetic-association analyses via ridge regression,”The American Journal of Human Genetics, vol. 82, no. 2, pp. 375–385, 2008
2008
-
[25]
Identifying qtls and epistasis in structured plant populations using adaptive mixed lasso,
D. Wang, K. M. Eskridge, and J. Crossa, “Identifying qtls and epistasis in structured plant populations using adaptive mixed lasso,”Journal of agricultural, biological, and environmental statistics, vol. 16, pp. 170– 184, 2011
2011
-
[26]
Reaching the end-game for gwas: machine learning approaches for the prioritization of complex disease loci,
H. L. Nicholls, C. R. John, D. S. Watson, P. B. Munroe, M. R. Barnes, and C. P. Cabrera, “Reaching the end-game for gwas: machine learning approaches for the prioritization of complex disease loci,”Frontiers in genetics, vol. 11, p. 350, 2020
2020
-
[27]
Machine learning to advance human genome-wide association studies,
R. E. Sigala, V . Lagou, A. Shmeliov, S. Atito, S. Kouchaki, M. Awais, I. Prokopenko, A. Mahdi, and A. Demirkan, “Machine learning to advance human genome-wide association studies,”Genes, vol. 15, no. 1, p. 34, 2023
2023
-
[28]
Random forests approach for identifying additive and epistatic single nucleotide polymorphisms associated with residual feed intake in dairy cattle,
C. Yao, D. Spurlock, L. Armentano, C. Page Jr, M. VandeHaar, D. Bick- hart, and K. Weigel, “Random forests approach for identifying additive and epistatic single nucleotide polymorphisms associated with residual feed intake in dairy cattle,”Journal of Dairy Science, vol. 96, n...
2013
-
[29]
Genome- wide association data classification and snps selection using two-stage quality-based random forests,
T.-T. Nguyen, J. Z. Huang, Q. Wu, T. T. Nguyen, and M. J. Li, “Genome- wide association data classification and snps selection using two-stage quality-based random forests,” inBMC genomics, vol. 16. Springer, 2015, pp. 1–11
2015
-
[30]
Machine learning identifies inter- 15 acting genetic variants contributing to breast cancer risk: A case study in finnish cases and controls,
H. Behravan, J. M. Hartikainen, M. Tengstr ¨om, K. Pylk ¨as, R. Winqvist, V .-M. Kosma, and A. Mannermaa, “Machine learning identifies inter- 15 acting genetic variants contributing to breast cancer risk: A case study in finnish cases and controls,”Scientific reports, vol. 8, ...
2018
-
[31]
Random forests,
L. Breiman, “Random forests,”Machine learning, vol. 45, pp. 5–32, 2001
2001
-
[32]
A unified approach to interpreting model predictions,
S. M. Lundberg and S.-I. Lee, “A unified approach to interpreting model predictions,”Advances in neural information processing systems, vol. 30, 2017
2017
-
[33]
Molnar,Interpretable machine learning
C. Molnar,Interpretable machine learning. Lulu. com, 2020
2020
-
[34]
Permutation importance: a corrected feature importance measure,
A. Altmann, L. Tolos ¸i, O. Sander, and T. Lengauer, “Permutation importance: a corrected feature importance measure,”Bioinformatics, vol. 26, no. 10, pp. 1340–1347, 2010
2010
-
[35]
Automated quantitative trait locus analysis (autoqtl),
P. J. Freda, A. Ghosh, E. Zhang, T. Luo, A. S. Chitre, O. Polesskaya, C. L. St. Pierre, J. Gao, C. D. Martin, H. Chen, A. G. Garcia-Martinez, T. Wang, W. Han, K. Ishiwari, P. Meyer, A. Lamparelli, C. P. King, A. A. Palmer, R. Li, and J. H. Moore, “Automated quantitative trait ...
-
[36]
The promise of automated machine learning for the genetic analysis of complex traits,
E. Manduchi, J. D. Romano, and J. H. Moore, “The promise of automated machine learning for the genetic analysis of complex traits,” Human Genetics, vol. 141, no. 9, pp. 1529–1544, 2022
2022
-
[37]
Scaling tree-based automated machine learning to biomedical big data with a feature set selector,
T. T. Le, W. Fu, and J. H. Moore, “Scaling tree-based automated machine learning to biomedical big data with a feature set selector,” Bioinformatics, vol. 36, no. 1, pp. 250–256, 2020
2020
-
[38]
Toward the automated analysis of complex diseases in genome-wide association studies using genetic programming,
A. Sohn, R. S. Olson, and J. H. Moore, “Toward the automated analysis of complex diseases in genome-wide association studies using genetic programming,” inProceedings of the genetic and evolutionary computation conference, 2017, pp. 489–496
2017
-
[39]
Knowledge-guided deep learning models of drug toxicity improve interpretation,
Y . Hao, J. D. Romano, and J. H. Moore, “Knowledge-guided deep learning models of drug toxicity improve interpretation,”Patterns, vol. 3, no. 9, 2022
2022
-
[40]
Machine learning: Models, chal- lenges, and research directions,
T. Talaei Khoei and N. Kaabouch, “Machine learning: Models, chal- lenges, and research directions,”Future Internet, vol. 15, no. 10, p. 332, 2023
2023
-
[41]
Hands-on training about overfitting,
J. Dem ˇsar and B. Zupan, “Hands-on training about overfitting,”PLoS Computational Biology, vol. 17, no. 3, p. e1008671, 2021
2021
-
[42]
Interpreting black-box models: a review on explainable artificial intelligence,
V . Hassija, V . Chamola, A. Mahapatra, A. Singal, D. Goel, K. Huang, S. Scardapane, I. Spinelli, M. Mahmud, and A. Hussain, “Interpreting black-box models: a review on explainable artificial intelligence,”Cog- nitive Computation, vol. 16, no. 1, pp. 45–74, 2024
2024
-
[43]
Hutter, L
F. Hutter, L. Kotthoff, and J. Vanschoren,Automated machine learning: methods, systems, challenges. Springer Nature, 2019
2019
-
[44]
N. R. Draper and H. Smith,Applied Regression Analysis: A Research Tool. John Wiley and Sons, 1981
1981
-
[45]
The coefficient of determi- nation r-squared is more informative than smape, mae, mape, mse and rmse in regression analysis evaluation,
D. Chicco, M. J. Warrens, and G. Jurman, “The coefficient of determi- nation r-squared is more informative than smape, mae, mape, mse and rmse in regression analysis evaluation,”Peerj computer science, vol. 7, p. e623, 2021
2021
-
[46]
A simulation study of the number of events per variable in logistic regression analysis,
P. Peduzzi, J. Concato, E. Kemper, T. R. Holford, and A. R. Feinstein, “A simulation study of the number of events per variable in logistic regression analysis,”Journal of clinical epidemiology, vol. 49, no. 12, pp. 1373–1379, 1996
1996
-
[47]
Conditional and joint multiple-snp analysis of gwas summary statistics identifies additional variants influencing complex traits,
J. Yang, T. Ferreira, A. P. Morris, S. E. Medland, G. I. of ANthro- pometric Traits (GIANT) Consortium, D. G. Replication, M. analysis (DIAGRAM) Consortium, P. A. Madden, A. C. Heath, N. G. Martin, G. W. Montgomeryet al., “Conditional and joint multiple-snp analysis of gwas su...
2012
-
[48]
Regression models,
L. Fahrmeir, T. Kneib, S. Lang, and B. D. Marx, “Regression models,” inRegression: Models, methods and applications. Springer, 2022, pp. 23–84
2022
-
[49]
Scikit-learn: Machine learning in python,
F. Pedregosa, G. Varoquaux, A. Gramfort, V . Michel, B. Thirion, O. Grisel, M. Blondel, P. Prettenhofer, R. Weiss, V . Dubourget al., “Scikit-learn: Machine learning in python,”the Journal of machine Learning research, vol. 12, pp. 2825–2830, 2011
2011
-
[50]
J. F. Crow,An introduction to population genetics theory. Scientific Publishers, 2017
2017
-
[51]
A fast and elitist multiobjective genetic algorithm: Nsga-ii,
K. Deb, A. Pratap, S. Agarwal, and T. Meyarivan, “A fast and elitist multiobjective genetic algorithm: Nsga-ii,”IEEE Transactions on Evo- lutionary Computation, vol. 6, no. 2, pp. 182–197, 2002
2002
-
[52]
Development of the national institutes of health genetically heterogeneous rat stock,
C. Hansen and K. Spuhler, “Development of the national institutes of health genetically heterogeneous rat stock,”Alcoholism: Clinical and Experimental Research, vol. 8, no. 5, pp. 477–479, 1984
1984
-
[53]
Genome- wide association study in 3,173 outbred rats identifies multiple loci for body weight, adiposity, and fasting glucose,
A. S. Chitre, O. Polesskaya, K. Holl, J. Gao, R. Cheng, H. Bimschleger, A. Garcia Martinez, T. George, A. F. Gileta, W. Hanet al., “Genome- wide association study in 3,173 outbred rats identifies multiple loci for body weight, adiposity, and fasting glucose,”Obesity, vol. 28, ...
1964
-
[54]
Plink: a tool set for whole-genome association and population-based linkage analyses,
S. Purcell, B. Neale, K. Todd-Brown, L. Thomas, M. A. Ferreira, D. Bender, J. Maller, P. Sklar, P. I. De Bakker, M. J. Dalyet al., “Plink: a tool set for whole-genome association and population-based linkage analyses,”The American journal of human genetics, vol. 81, no. 3, pp....
2007
-
[55]
R Core Team,R: A Language and Environment for Statistical Computing, R Foundation for Statistical Computing, Vienna, Austria,
-
[56]
Principal components analysis corrects for strat- ification in genome-wide association studies,
A. L. Price, N. J. Patterson, R. M. Plenge, M. E. Weinblatt, N. A. Shadick, and D. Reich, “Principal components analysis corrects for strat- ification in genome-wide association studies,”Nature genetics, vol. 38, no. 8, pp. 904–909, 2006
2006
-
[57]
Evolutionary algorithms for multiobjective optimization: Methods and applications,
E. Zitzler, “Evolutionary algorithms for multiobjective optimization: Methods and applications,”PhD thesis, Swiss Federal Institute of Technology, 1999
1999
-
[58]
Comparison of multiobjective evolutionary algorithms: Empirical results,
E. Zitzler, K. Deb, and L. Thiele, “Comparison of multiobjective evolutionary algorithms: Empirical results,”Evolutionary Computation, vol. 8, no. 2, pp. 173–195, 2000
2000
-
[59]
2022 updates to the rat genome database: a findable, accessible, interoperable, and reusable (fair) resource,
M. Vedi, J. R. Smith, G. Thomas Hayman, M. Tutaj, K. C. Brodie, J. L. De Pons, W. M. Demos, A. C. Gibson, M. L. Kaldunski, L. Lamers et al., “2022 updates to the rat genome database: a findable, accessible, interoperable, and reusable (fair) resource,”Genetics, vol. 224, no. 1...
2022
-
[60]
How introns enhance gene expression,
O. Shaul, “How introns enhance gene expression,”The international journal of biochemistry & cell biology, vol. 91, pp. 145–155, 2017
2017
-
[61]
Obe- sity and inflammation: the linking mechanism and the complications,
M. S. Ellulu, I. Patimah, H. Khaza’ai, A. Rahmat, and Y . Abed, “Obe- sity and inflammation: the linking mechanism and the complications,” Archives of medical science, vol. 13, no. 4, pp. 851–863, 2017
2017
-
[62]
Kazrin, a novel periplakin-interacting protein associated with desmosomes and the keratinocyte plasma membrane,
K. R. Groot, L. M. Sevilla, K. Nishi, T. DiColandrea, and F. M. Watt, “Kazrin, a novel periplakin-interacting protein associated with desmosomes and the keratinocyte plasma membrane,”The Journal of cell biology, vol. 166, no. 5, pp. 653–659, 2004
2004
-
[63]
Desmosomes: new perspectives on a classic,
K. J. Green and C. L. Simpson, “Desmosomes: new perspectives on a classic,”Journal of Investigative Dermatology, vol. 127, no. 11, pp. 2499–2515, 2007
2007
-
[64]
Accelerating genetic algorithms with gpu computing: A selective overview,
J. R. Cheng and M. Gen, “Accelerating genetic algorithms with gpu computing: A selective overview,”Computers & Industrial Engineering, vol. 128, pp. 514–525, 2019
2019
-
[65]
Multifactor-dimensionality reduction reveals high-order interactions among estrogen-metabolism genes in sporadic breast cancer,
M. D. Ritchie, L. W. Hahn, N. Roodi, L. R. Bailey, W. D. Dupont, F. F. Parl, and J. H. Moore, “Multifactor-dimensionality reduction reveals high-order interactions among estrogen-metabolism genes in sporadic breast cancer,”The American Journal of Human Genetics, vol. 69, no. 1...
2001
-
[66]
The alzheimer’s knowledge base: A knowledge graph for alzheimer disease research,
J. D. Romano, V . Truong, R. Kumar, M. Venkatesan, B. E. Graham, Y . Hao, N. Matsumoto, X. Li, Z. Wang, M. D. Ritchieet al., “The alzheimer’s knowledge base: A knowledge graph for alzheimer disease research,”Journal of Medical Internet Research, vol. 26, p. e46777, 2024
2024
-
[67]
Kragen: a knowledge graph-enhanced rag framework for biomedical problem solving using large language models,
N. Matsumoto, J. Moran, H. Choi, M. E. Hernandez, M. Venkatesan, P. Wang, and J. H. Moore, “Kragen: a knowledge graph-enhanced rag framework for biomedical problem solving using large language models,”Bioinformatics, vol. 40, no. 6, p. btae353, 2024
2024
-
[68]
Escargot: an ai agent leveraging large language models, dynamic graph of thoughts, and biomedical knowledge graphs for enhanced reasoning,
N. Matsumoto, H. Choi, J. Moran, M. E. Hernandez, M. Venkatesan, X. Li, J.-H. Chang, P. Wang, and J. H. Moore, “Escargot: an ai agent leveraging large language models, dynamic graph of thoughts, and biomedical knowledge graphs for enhanced reasoning,”Bioinformatics, vol. 41, n...
2025
-
[2023]
Available: https://doi.org/10.1186/s13040-023-00331-3
[Online]. Available: https://doi.org/10.1186/s13040-023-00331-3
-
[2025]
Available: https://www.R-project.org/
[Online]. Available: https://www.R-project.org/
Reviewed August 7, 2026 · model on record in the stance chip above.
Discussion (0). Sign in to comment.